Nov 14
DYDX has a chance to become a strong narrative for the coming weeks. The strength of this narrative depends on what's happening on the market, will we see a next wave of liquidations or not. It's good to have a chart layout prepared. We did it for you.
https://app.santiment.net/charts/dydx-review-and-smart-money-17838
Our eye catching a few pieces, but especially looking into the last one, token holders balance trend, with accumulation with of perhaps a smartest group of DYDX token holders so far:

They were able to do a great job, adjusting their position at the right time. Having strong nerves, they sometimes buy during a crash. They seem to be knowing what they doing so far.

Oct 31
While we see kind of bit worrying pattern on many coins, like ETH...

... where there is divergence with latest growth which often leads to decline, AAVE tries to do something different:


If it will not be enough to keep the price, we dump. But we never know.
Oct 10
We're observing spikes in multiple metrics for 1INCH token:

Sep 7
Santiment has a powerful feature, called "Screener".
Entry point - https://app.santiment.net/screener/new, short guide - https://www.youtube.com/watch?v=4H5FlcJwi5A.
It allows to produce a live list of tokens, filtered by specific criteria.
One of our public screeners, "Exchange Inflow" is set to highlight assets with increased exchange inflow, x3 compared to yesterday.
And there was DYDX on the list.
Looking into DyDx we found out that there was indeed a high exchange inflow, interestingly, a few hours prior to dump:

The top transactions table reveals a whale address initiatiting this move:

This is how his DYDX holdings chart looks like:

His funds ended up on Binance.
Yeah, even whales are getting desperate.
Charts used:
https://app.santiment.net/charts/dydx-exchange-inflow-and-a-whale-16838
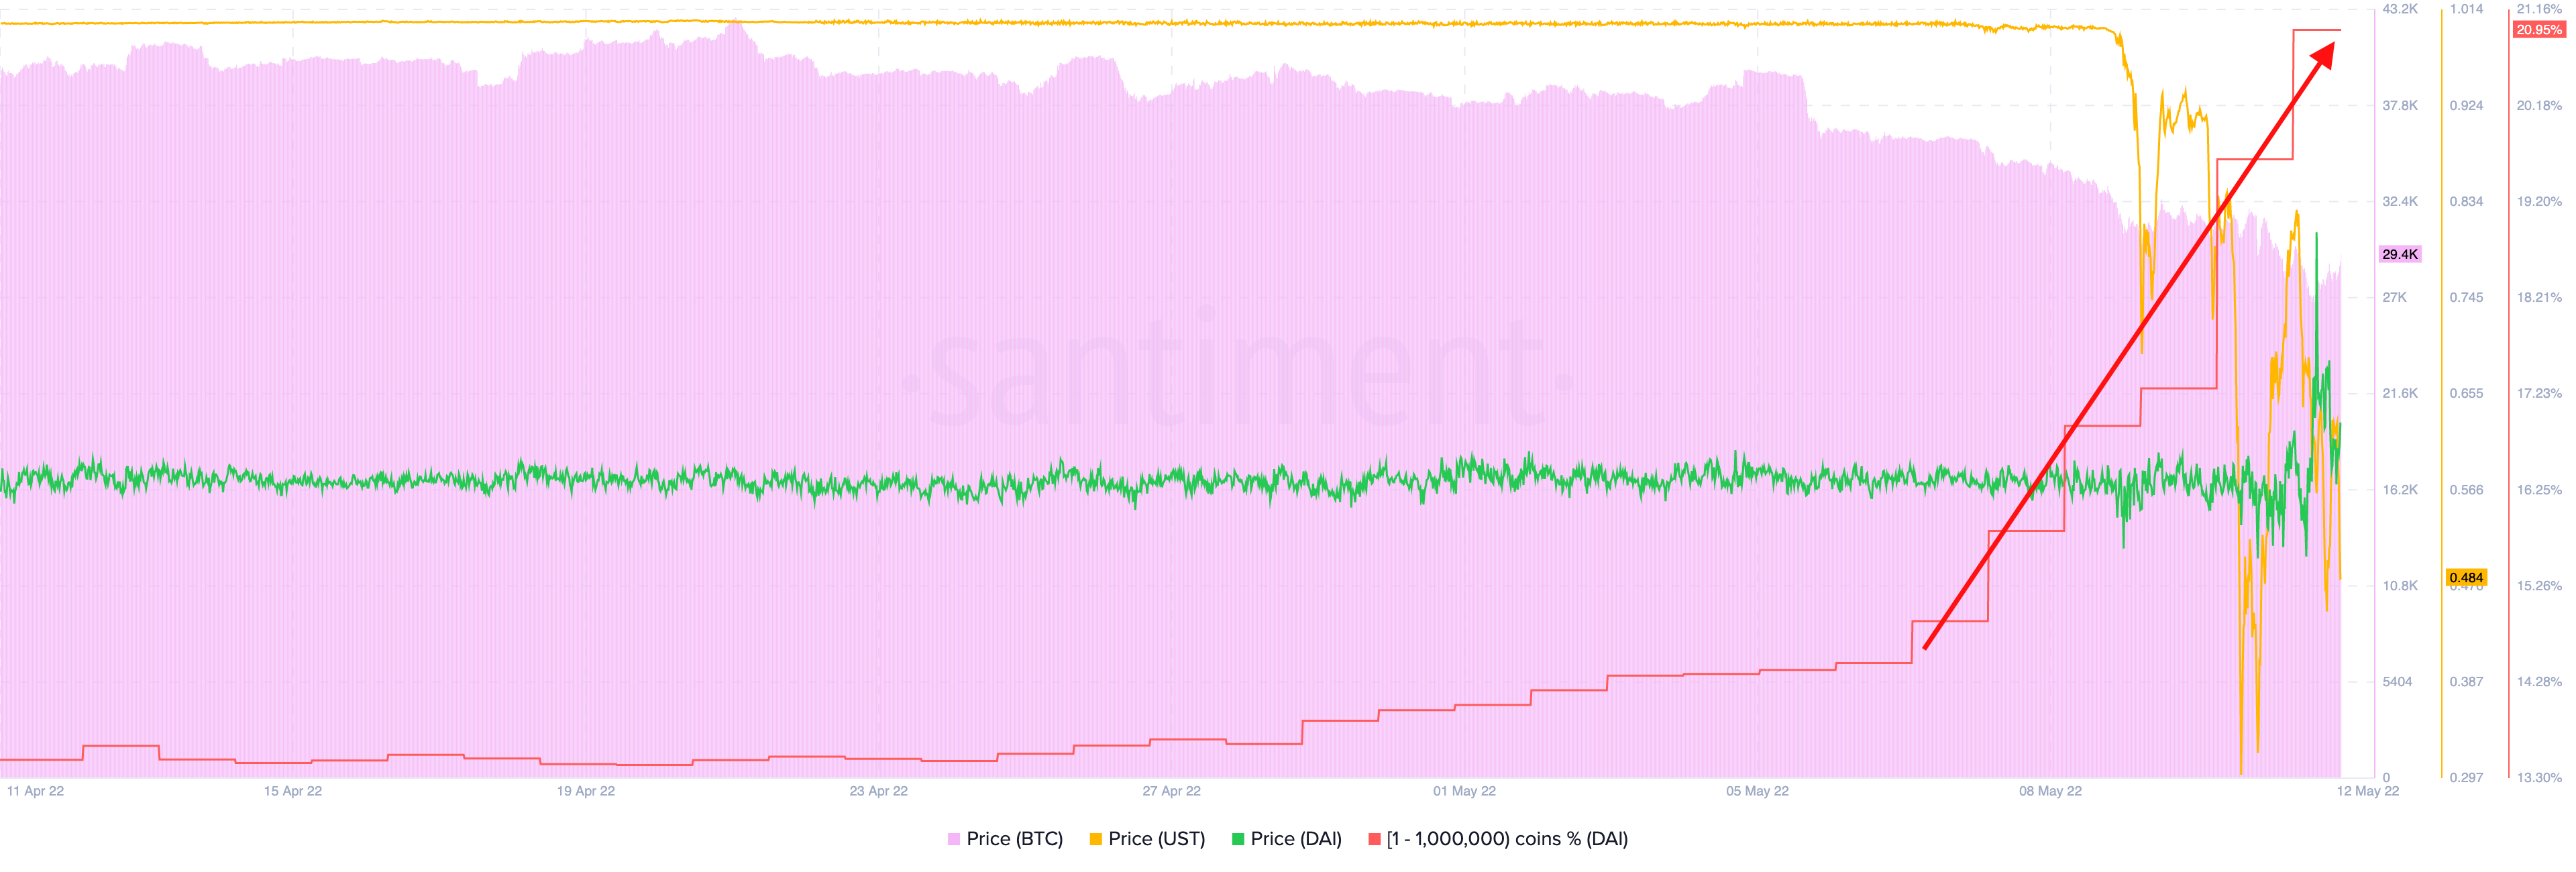
May 12
Do you want to see a flight to quality? This is how it looks like.
Stablecoin (DAI) holder's balance rapidly growing since market started to crash.
And it has only increased since LUNA drama started.
A history of the market on one chart.
Mar 30
Aave has been one of top pumping coins last days.
Digging into it's metrics we might notice that most AAVE metrics are looking good and healthy. Confident whales in 'buy' mode, network activity increasing - all good.
However a couple of red flags are clearly visible.
- MVRV 30d:

MVRV is too high. There is a high risk of short term traders taking profits and therefore pressing the price down. Cause this is exactly what MVRV 30d metric is about - average profit of 30d AAVE holders.
2. Whale Transaction Count

Whales transactions count seem to spike around price tops, this is what historical performance shows on the chart above. And the lates spike could also mark a local price top.
Complete onchain metrics AAVE overview: https://app.santiment.net/s/sVbKorXj
Mar 24
One of Santiment screeners has brought DYDX to our attention earlier today.
It was the "DAA Anomalies" screener where DYDX flashed a spike in Daily Active Addresses:

The last spike seems quite unusual indeed for a stagnant price. Bullish divergence?
Then we found an astonishing Network Growth for DYDX. Have a look at this beauty:

It's in a very strong uptrend potentially able to pick up the price, along with strong Active Addresses. Previous attempts to pump took place on even lower Network Growth.
Possible confidence markers:
- Price breaking 5.4 USD (above resistance)
- Network Growth remaining over 118 (current value)
- Active Addresses more than 380 (current level)
Charts: https://app.santiment.net/s/hHfIelnr
Disclaimer: The opinions expressed in the post are for general informational purposes only and are not intended to provide specific advice or recommendations for any individual or on any specific security or investment product.
Mar 15
Chainlink has our attention today because of a long period of losses visible on Network Profit Loss:

What does it mean? Since January, most LINK tokens were moved at a loss. Of course if we assume their previous moves as purchases, last moves as sells. Basically it's one of a bottom indicators. Just one.
Then we discovered an interesting token circulation pattern:

There were a few times when circulation increased, then dumped, and then price surged.
There is a chance we are now in a similar pattern.
If we compare it to LINK and it's circulation one year before...

...Then we could notice some difference. The pattern above working a bit differently. That could be the sign of a bull market itself. Circulation increases, then a lag happens, and then the price grows. Do you notice anything else?
Chart used: https://app.santiment.net/s/4ofkTD-H
Dec 29
MATIC's on another all-time high binge, so here are 4 quick metrics to watch:
1) Daily active addresses look very choppy - isolated spikes around local pumps, possibly a signal of increased sell-offs:

Unless we see a sustained uptick in address activity, we may expect volatile PA and a quick-fire correction with every new ATH push.
2) Daily deposits confirm the above - latest two price tops were marked by a clear uptick in deposits. These indicate rising sell-offs that may obstruct the rally:

3) Network Profit/Loss had a massive spike right as MATIC hit new ATH, suggesting significant profit-taking activity. Keep an eye on these if MATIC rallies once more:

4) Finally, last two price tops were marked with upticks in MATIC-related chatter, as the social sentiment hit 'peak hype'. This should be a good gauge of retail fear/greed as (or if) MATIC continues to pump:

Stay safe out there!

Jul 1
Some of the largest DeFi tokens are experiencing quite the uptick in unique addresses activity over the past few days:

- AAVE's daily active addresses are up +24.1% since Monday.
- MKR's daily active addresses are up +97% since Monday.
- UNI's daily active addresses are up +72.5% since Monday.
- COMP's daily active addresses are up +72.8% since Monday.
Could this be the start of a new demand wave for DeFi?
It's still (way) too early to tell, but I'd keep an eye on these charts in the coming days. A sustained rise in address activity may be an early signal of growing network confidence and a possible 'return to form' for DeFi's blue chips.
Still a long way to go, but a decent start!