UniSwap, Bitcoin, and elections in the US. How on-chain and fundamental data brings these pieces into one salad together

As cryptomarket goes through a rollercoaster of DeFi hype caused by Sushi controversy and Uniswap distribution, it's important to look at some fundamentals and navigate through informational and speculative buzz around Bitcoin and altcoins. In this article, I decided to make an overview of important metrics and determine the state of the market.
BTC
The first and foremost important metric for me is DAA (Daily Active Addresses) vs Price and its divergence coefficient, which is provided by Santiment. The reason why I pick these metrics is that it indicates the fundamental activity level. If I would extrapolate this onto traditional business, it would equal to a number of attendants of the Disneyworld parks, that purchase tickets, merchandise products, and food inside of the park. In a way, high DAA is similar to Disneyworld peak seasons. The more visitors you have, the more sales you can anticipate in the park itself. But for how long would the park operate, if the prices would continue to grow while the number of customers would continue to reduce?
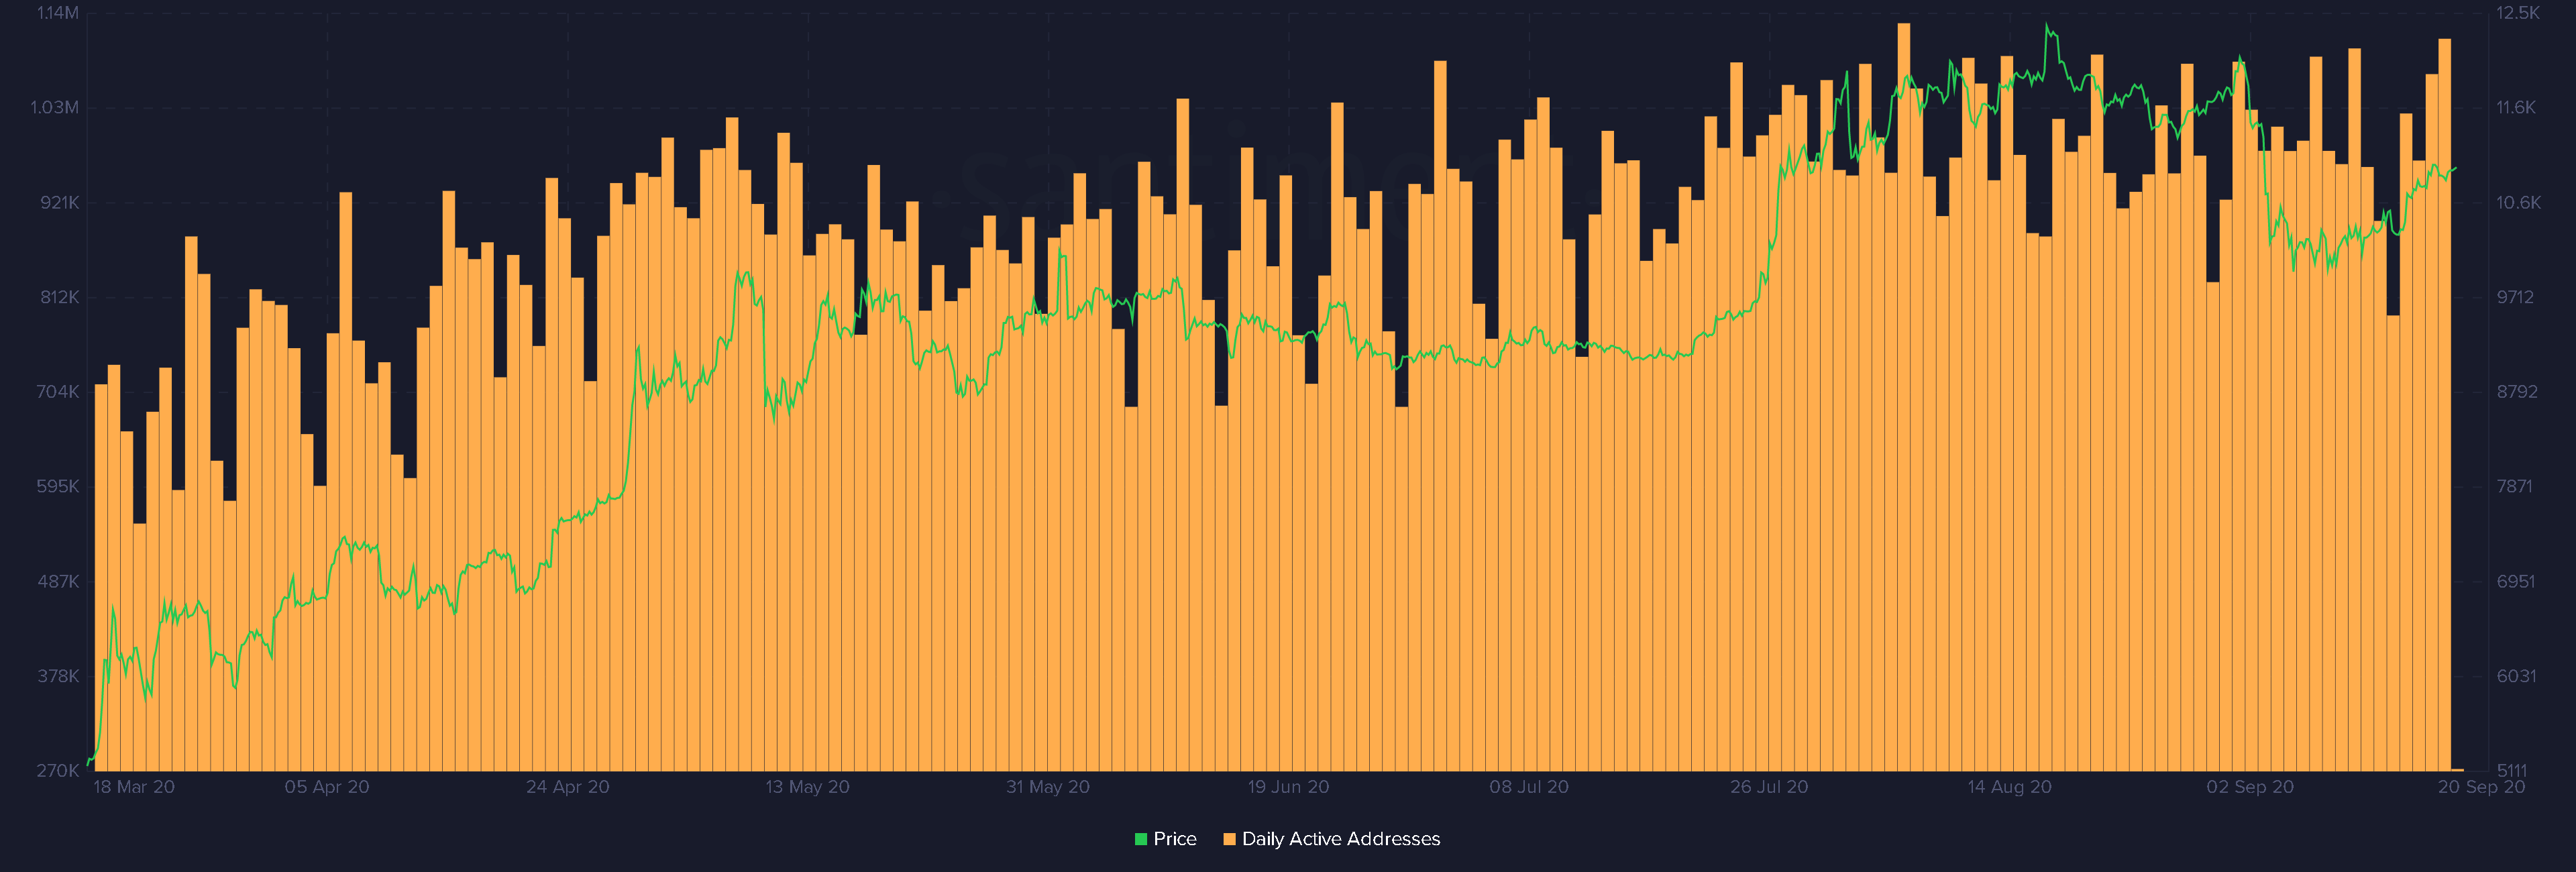
After slow weekends, BTC picked up the pace yesterday and its DAA steadily demonstrates growth since Monday. This is a good bullish indicator, that being said, it’s still quite weak to fuel an anticipated bull rally to $20,000 unless Bitcoin will suddenly increase its daily activity due to some large shifts in traditional markets or fundamentally vital crypto market changes. The current price perfectly corresponds with the DAA, which indicates that bears are getting weaker but at the same time it doesn’t look enough convincing to make a significant breakout move.
Why did I mention traditional markets?
When we try to forecast one or another asset behavior, we can always refer to correlation coefficients that are used to measure the strength of the relationship between two assets. Values always range between -1 (indicates a strong negative relationship) and +1 ( indicates a strong positive relationship). The current correlation coefficient between BTC and stocks remains over 0.82, which indicates quite a close correlation between these types of assets. This high correlation was established in March 2020 and it remains highly correlated to this day.

Unfortunately, that just adds another unknown variable to the market equation - a direct consequence of BTC institutionalization and worldwide adoption. That being said, on-chain data can still help us to determine whether the asset is undervalued or it grows due to a speculative bubble, so let's take a look at MVRV that shows us the average profit/loss of the coin to the current price.

MVRV(60) shows us a neutral/weak bullish sentiment for BTC which creates a strong support level against bears and in combination with DAA indicates that we are unlikely to see another massive BTC correction that will leave BTC below $9000.
Ethereum
The DAA vs Price situation looks quite controversial. Overall, the ETH price vs DAA shows us a weak bearish trend and significant activity drop since August. At the same time, due to UNI token airdrop, the DAA of ETH significantly increased for the past 24 hours, sending a bullish signal.

In case if you missed this massive news and UNI tokens “airdrop”, I recommend you to read this Santiment.Insights article to get a general understanding of the Uniswap token airdrop (distribution).
So how do I interpret this data? The answer is straightforward: if ETH will be able to sustain this DAA continuously for the next 7-14 days, then we can talk about a strong bullish signal. To get a more detailed picture, we need to check other on-chain indicators.

Network Growth is a great indicator, as it allows us to determine upcoming trend changes. For example, when the network stops growing but the price continues to increase, it indicates that the asset is very likely to have a correction, which we can observe on the graph above. Since mid-August, network growth dropped and a couple of weeks later, ETH followed this trend. The current Network growth indicator signals about network growth recovery and gives ETH bulls some hope to re-test $475 and $500 if ETH will be able to sustain this growth. Until then, ETH network growth remains weak and needs more action for a solid bull run.
Another fundamental indicator that I use is transaction volume. Transaction volume in general shows us the aggregate amount of ETH tokens across all transactions that happened on the network during a day. This indicator doesn’t necessarily show whether the market is bearish or bullish but it can indicate the strength of one of another trend.

In this particular case, we can see a significant increase in ETH volume for the past week, which is a good sign and might give bulls some fuel for another attempt to move over $400. Another positive signal comes from an Ethereum Daily transaction Chart, which shows us record high values since 2018.

So what’s next?
Overall, ETH looks much better than it was a couple of weeks ago. This a good opportunity for bulls to push the price over $400 mark again. That being said, it’s important to keep in mind that this sudden spike of DAA and volume caused by Uni hype, can vanish by the end of next week, causing a 10-20% correction. In this particular case, I will continue to watch ETH DAA, network growth, and transaction volume to determine the longevity of this bullish sentiment, which I am skeptical about until I get a solid confirmation that this is not just a temporary rendezvous between ETH and Uniswap hype.
UNISWAP
As the UNI token was distributed among Uniswap participants, the market capitalization of UniSwap has reached $500,000,000 when the price peaked at $5.74 per token. Such a sudden growth, caused mostly by vivid speculation, might leave some investors with a bitter aftertaste. On-chain data suggests that there are over 65 million unclaimed UNI tokens or $325 million in dollar equivalent at the current UNI rate. As the price grows, the incentive to “HODL” free, airdropped token decreases.
An additional red flag comes from the token distribution itself. Some users reported insanely large airdrops for active liquidity providers. For example, one Twitter user reported that some liquidity providers received UNI worth half a million US dollars.

With such a massive sale incentive, I doubt that token can keep any sustainable growth and will likely go through a series of corrections. Keep in mind that for a price to grow, you need somebody on the other end willing to buy it and it’s hard to avoid a massive correction when you have more incentivized people to sell than you have people willing to buy.
On a positive note, Uniswap triggered another boom in liquidity mining and had a very healthy impact on the DeFi market and UniSwap ecosystem:

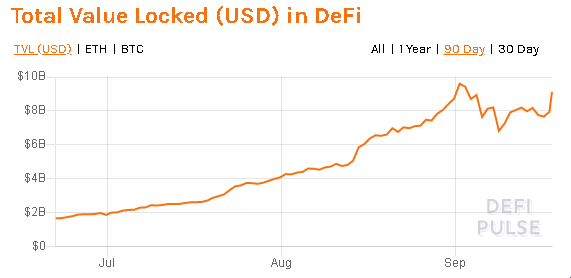
Should we anticipate another bull run caused by a second-wave of the DeFi boom?
In my opinion, November 2020 will be far more crucial for crypto markets for two reasons:
- - On Tuesday, November 3, 2020, The presidential election will take place in the US. The outcome will have a significant influence on stock markets, hence it will directly affect Bitcoin due to a high correlation coefficient. According to the survey by Hartford Fund, 93% of investors believe the presidential race will affect the stock market, hence it can easily transform into a self-fulfilling prophecy. Another interesting point made by
Hartford Fund research is that stock prices have on average fallen in the final three months leading up to an election whenever the incumbent political party lost but rallied if the incumbent party won (regardless if it were Republicans or Democrats) - - Raul Jordan, an Ethereum 2.0 developer with Ethereum infrastructure builder stated that “November is still looking good for a launch from our perspective.”. When the proposal will be approved by Ethereum core developers, the Serenity Phase 0 will occur, which will bring the PoS consensus model on the Ethereum blockchain. While many people remain skeptical over ETH ability to have an update on time, it is still a feasible possibility that we might see ETH in late November.
Summary:
Overall, the market looks much better than it did at the beginning of the month. The DAA, MVRV, and Volume is definitely on the bullish side. At the same time, all these changes happened only during the past 5 days, hence it's way too early to make any bullish statements as it might change at any time. In my opinion, due to the absence of strong bullish signals, BTC won't be able to move over $12000 in the near days. At the same time, Uniswap-fueled Ethereum may move above the $400 price mark. The major question is whether this volume and activity spike is sustainable or not. Because if the answer is no, then we have all chances to see ETH back to $320-340 levels again.
CTO at TheFutureIsNow
Author of a subscription-based telegram channel “Octopus”
Vlad Antonov
Contacts
Telegram: @GoldmanTrade
Conversations (0)