Santrends spotlight - FTM


So recently FTM popped up as #3 on Santrends - Let's take a quick look at how things are.
Social volume and Santrends

Social volume
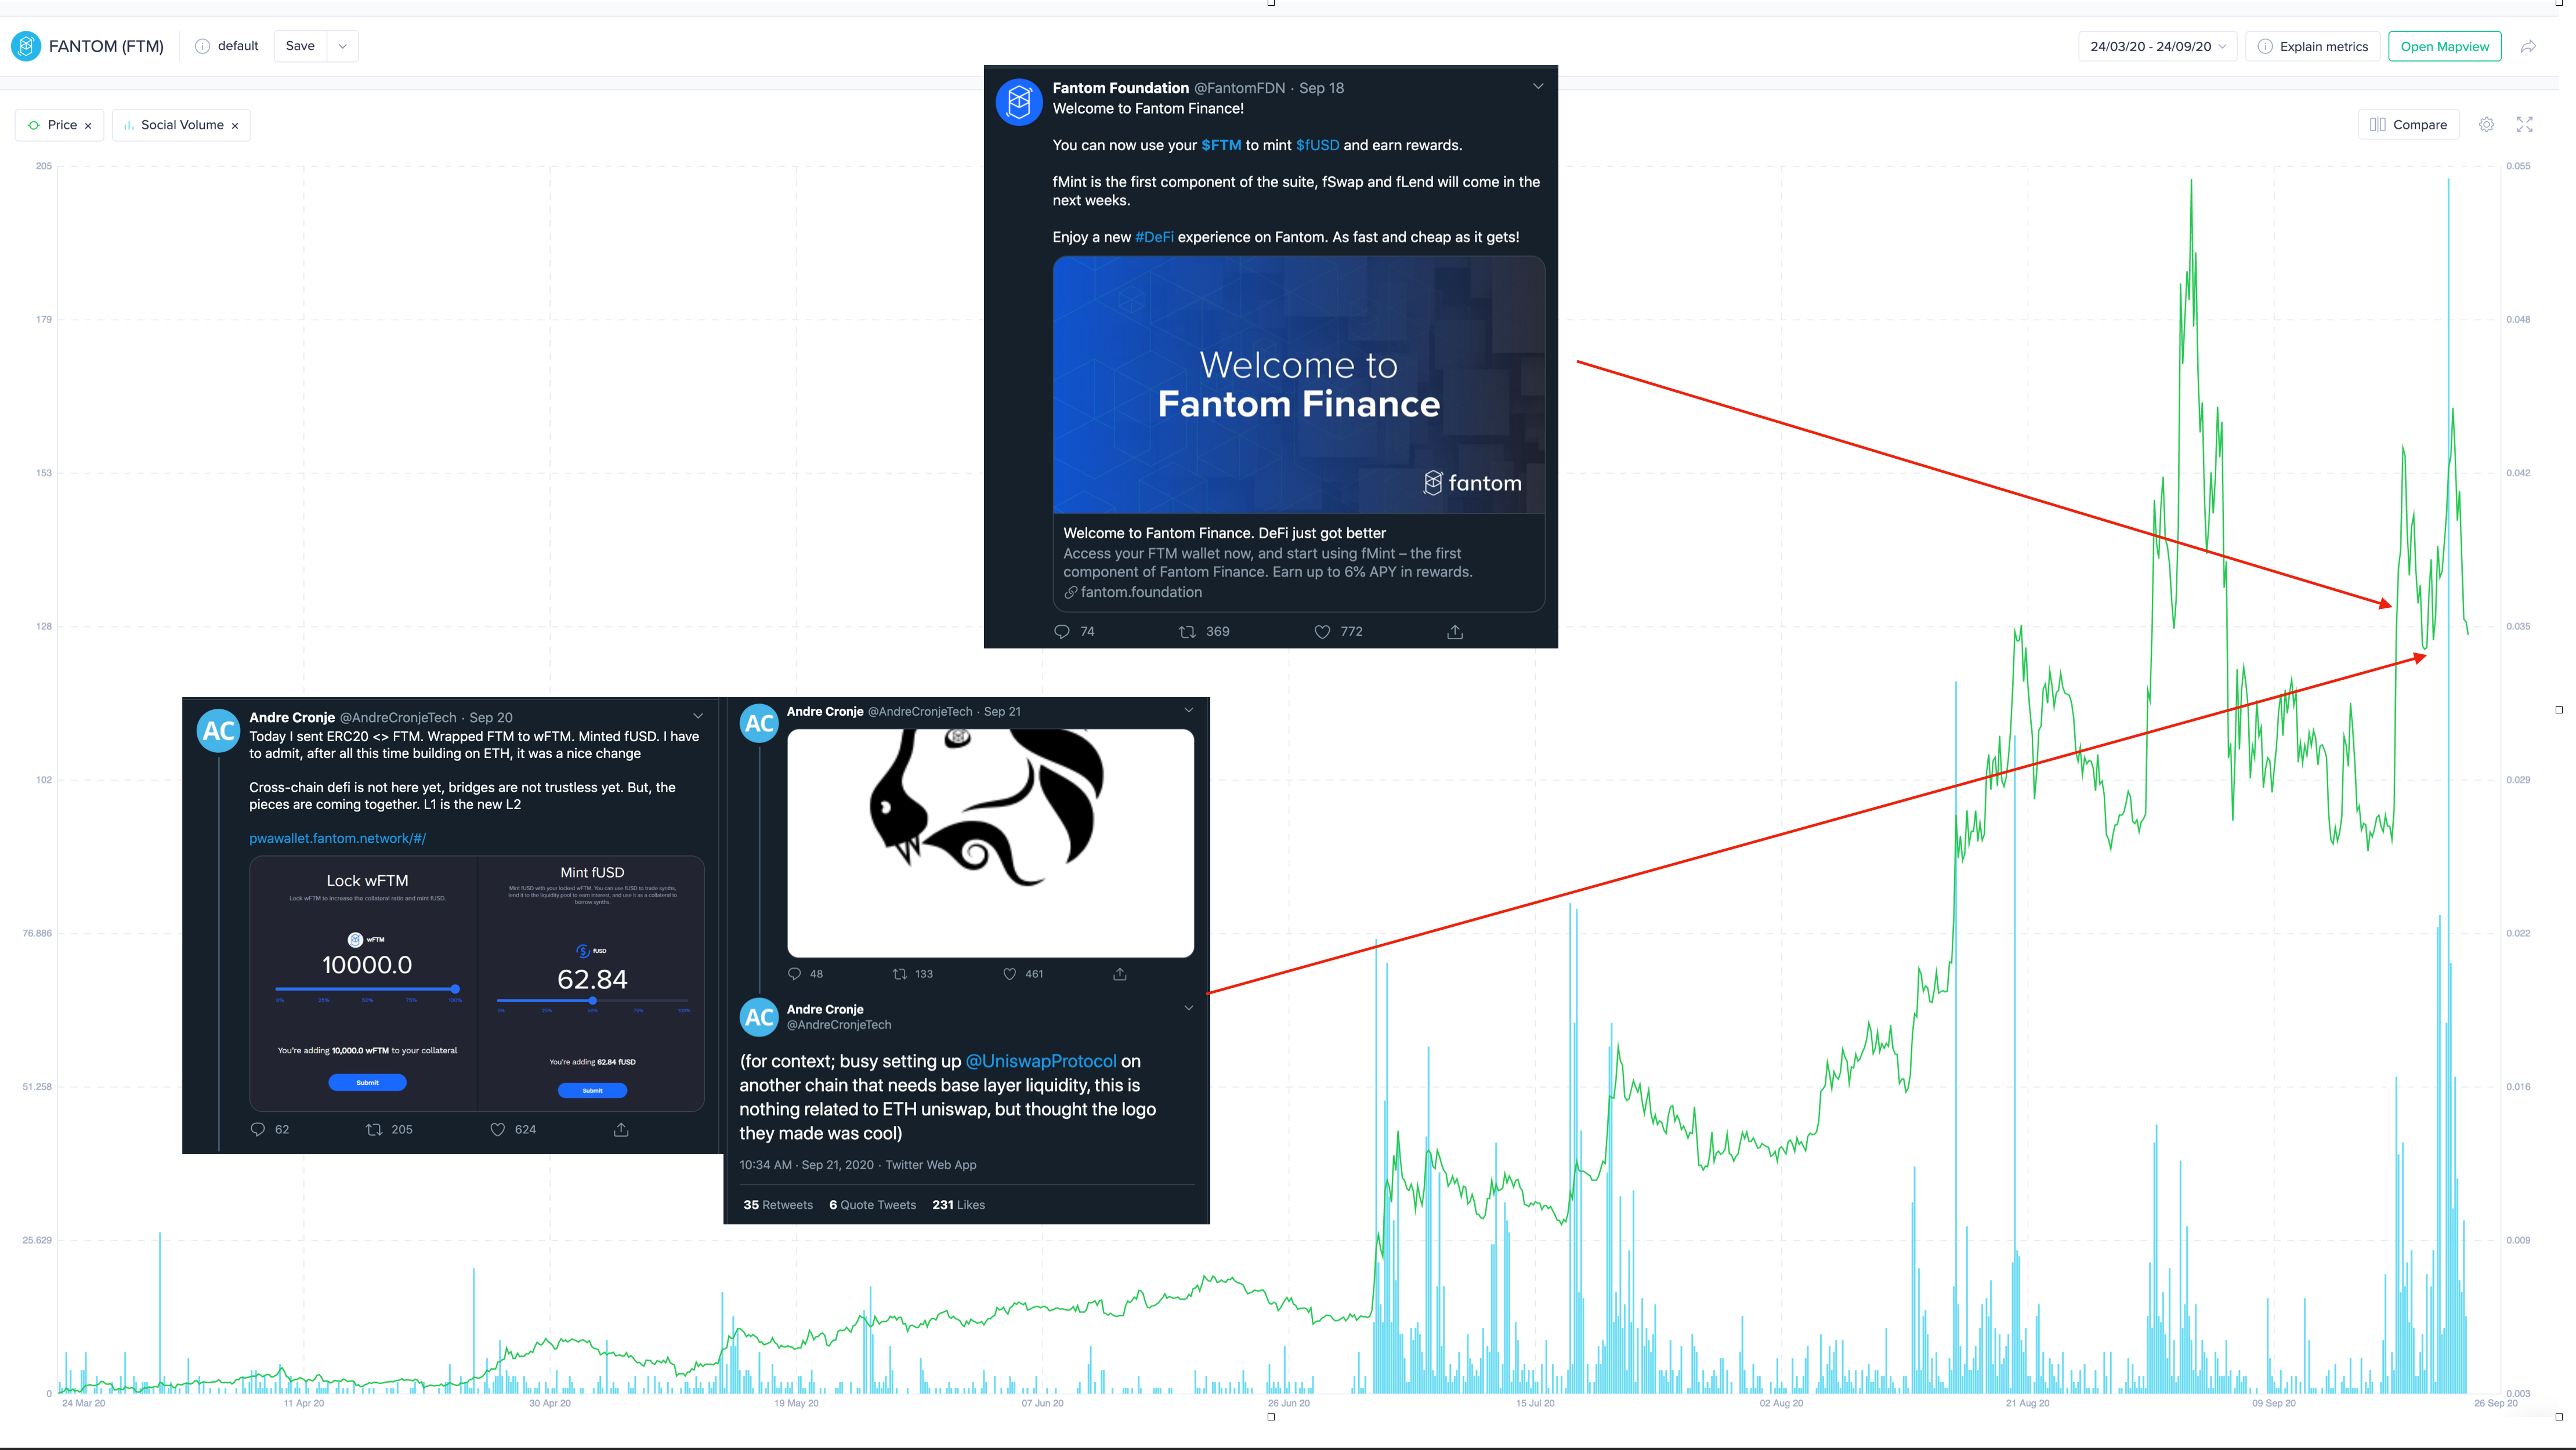
For the past 3 months, FTM had a nice rally and with each leg up, we saw huge spikes in Social volume which signalled local tops.
This becomes more apparent when there's:
- Big spike in Price (Let's FOMO in!!)
- Big spike in Social volume (Crowd is excited)
- Followed by big drop in Social volume
This usually indicates that less participants are coming in.
In the most recent spike, we are also seeing the same pattern playing out, which isn't good sign for FTM in the short term.
Santrends
So what could be driving the recent increase in social chatter?

It appears to be two major events:
- The launch of Fantom Finance - fMint is just one part of a larger suite of products that's to come.
- Andre Cronje (founder of YFI) trying out fMint and mentioning that he's working on implementing Uniswap for another chain. Which, in this case, only makes that it's going to be Fantom since he's the technical advisor for them. Keen eyed folks would also notice something titled "Fantom-Uniswap" appearing in Fantom's github just 2 days ago.

Both of the above events gives room for the market to speculate and sets the stage for a "Buy the rumour , sell the news".
That said, in the short-term, FTM appearing on Santrends isn't a good thing as we have seen in the past that the appearance of a coin in the top 3 words on our Santrends list suggests an average downtrend of 8.2% for automated signals and 18.1% for human-created signals.
Also, it's important to note that Binance Futures launched FTM margin trading on 2020/09/24 7:00 AM (UTC), lending to the volatility during this period.
Price DAA divergence

One of our most popular indicator for timing tops, the Price DAA divergence, is showing worrying signs of a local top with the recent spikes.
Looking at past spikes, we observe that a huge spike in Price DAA divergence have preceded price corrections. Could history repeat again? Given the other indicators (Social volume/ Santrends) showing similar signs, we might just see a further correction.
Top holders vs Exchanges

Over the past 3 months, the Top 30 holders have been consistently reducing their holdings. Going from 452.06M to 321.92M (-28.7%)
In the same period, we also see increasing supply on Exchanges - from 784.19M to 915.81M (+16.78%), suggesting that it is likely that a decent amount of the outflow from Top holders eventually ends up on Exchanges.
The mounting sell pressure available on exchanges isn't an encouraging sign. However, it is interesting to note that, there's a slight change in behaviour during the recent price action. Top holders saw a spike in holdings and Exchanges a drop, suggesting some accumulating from the dips are happening.
Likely due to the two events mentioned earlier in Social voume/Santrends section.
Going forward
All signs seem to point towards a healthy correction in the short-term, especially with the huge uncertainty in the macro environment. However, there remains enough speculative juice to fuel the "Buy the rumour, sell the news" to help buffer things out.
Top holders are showing signs of "buying the dip" and adding to their stash with each correction. Keeping an eye out on what they are doing over the coming weeks or any further correction might be worth while.
The main "Sell the news" have yet to occur, which means that we should see a nice run up (once price corrected, not surprised if we go beyond the most recent ATH if macro conditions allow) leading to that and a blow off top. And when that happens, the usual signs of a top (as mentioned in this post) should show itself again, presenting yet another chance to short/derisk.