Is the Roller Coaster Over yet?

Hello and Welcome to NeuroInvest!
Twitter Handle:
NeuroInvest
@Daily__Dopamine
Introduction
A little while back I began blogging short summaries about my current interpretations of the Cryptocurrency market on Santiment. Since then I have taken much of that time to study valuable research and understand the unconventional science behind on-chain metrics. All the research I’ve collected is from researchers that I found to be the least subjective, open-minded and critical of their work. These blogs will include not only Bitcoin analysis, but also research regarding interesting macro-economic studies, bitcoin adoption and more. So here we go, let's dive in.
For discretionary purposes, I am not an economist. I am an individual who loves research, finding the most optimal method of interpreting data, and getting to the bottom of what I find most compelling. In the last couple years it has been about cryptocurrencies, bitcoin adoption and macro-economics.
* All metrics are taken from the Santiment database and analyzed on excel. *
Why Bitcoin?
This will be a brief summary only because I want to merely convey why my conviction is strong for bitcoin, which will hopefully give you a better understanding why most of my spotlight is focused on the king himself. Also, I think it is just incredibly fascinating that the ledger is transparent and that we can engineer data models to interpret the behavior of participants in a complex monetary network.
Anytime I explained Bitcoin to friends/family it became clear to me - nobody understood why it could be a part of our world, but it was clear that I had to explain the cracks and holes in our monetary system to truly get to the bone of Bitcoin’s inevitable adoption. This is why it is pivotal to understand the nature of our fiat system and why Bitcoin helps shift this narrative. The Fiat system is problematic because it lacks audibility and it is fully centralized without any transparency, therefore allowing the ones sitting at the top of the pyramid to benefit from the system the most. History has proven this time and time again, our intuitive nature to trust these monetary governors is conditioned into us. We are primed to believe in the system, but only because behind the curtains the global macro database still sits in a foggy window. Why not disclose the information publicly? This topic is very interesting and I will do a separate write up about the flaws in the centralized banking systems. So now to the simple question, why bitcoin and how can it improve this system?
Let us define one important thing, what makes an asset? According to Investopedia, the definition of an asset has three particular characteristics:
- "An asset is a resource with economic value that an individual, corporation, or country owns or controls with the expectation that it will provide a future benefit."
- "Assets are reported on a company's balance sheet and are bought or created to increase a firm's value or benefit the firm's operations."
- "An asset can be thought of as something that, in the future, can generate cash flow, reduce expenses or improve sales, regardless of whether it's manufacturing equipment or a patent."
Bitcoin provides economic value and it cannot be governed. Therefore is only empowered by the collective trust among participants utilizing the network. Bitcoin has achieved that collective tangibility and much more - for one, it is already undergoing national/institutional adoption. Global adoption increases because bitcoin carries the functional characteristics of an asset, and therefore has increasingly and patiently built this sophisticated network to store value in a safe and impermeable system. Essentially, bitcoin is an improved gold. Think about it this way, why was gold or why does fiat have value in the first place? These monetary systems are necessary but the system tends to favor those who are already privileged and forget those who need it most. It is sickening to watch these policy makers and central bankers play monopoly with the world we live in. When these giant conglomerates hold these monopolies, what can the middle and lower class do to compete when the hurdles are just too large to cross? These topics definitely requires professional research to back up my claims, and therefore will be left as a topic for another day. I will leave you with this short summary before we jump into on-chain metrics and take a look at the data from Santiment.
On-chain Analysis: How are the mice behaving inside the glass box?
On-chain analysis refers to the method of using mathematical assumptions from the publicly available blockchain ledger to determine how investors are currently behaving, hence why I say, mice (participants on bitcoin's blockchain) inside the glass box (the publicly available ledger). Bitcoin for example uses a UTXO based accounting model to monitor transactions on the network and from this we can engineer mathematical models that give the best possible representations of investor sentiment.
Analytic Structure: How I will provide you with a structure to my analysis?
- Part 1.0 - I will give you an introduction into one metric initially coined by Dhruv Bansal, of Unchained Capital - Realized Cap HODL waves with a detailed explanation.
- Part 1.1 - How to use the metric?
- Part 1.2 - Deep dive into the mice behavior
- Part 1.3 - Mathematical Assumptions
- Part 2.0 - Take a view into a dashboard I created using Santiment data on excel to use quantitative approaches for investing into cryptocurrencies.
Part 1.0: Realized Cap + HODL Waves = Realized Cap HODL Waves
Realized cap HODL waves (Santiment definition = circulation) a metric which requires two explanations: one part of the equation models the time an investor spends with their asset, and the second being the economic part of the equation which values the cost basis of the purchases you made to buy BTC (time of creation based on this UTXO modelling system). For a clear and concise explanation on Realized cap, I would highly recommend reading the article written by Coinmetrics on realized capitalization (https://coinmetrics.io/realized-capitalization/). Realized cap is one of the most important and valuable metrics utilized on-chain as many metrics like realized cap HODL waves, MVRV are built upon the idea that you can extract the aggregate cost basis of investors and determine how over valued or undervalued the current market. If you are new to on-chain, really take the time to understand how the UTXO account model functions. I promise you it is pivotal to understand concepts like creation, destruction, realized value, etc.
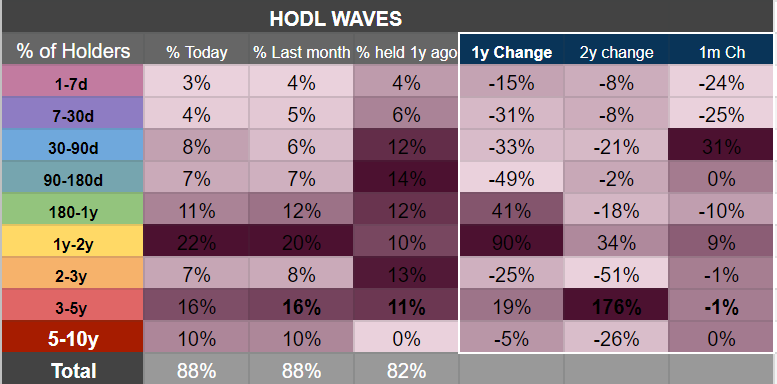
Now that you hopefully have a descent understanding of the mathematical reasoning governing realized cap and HODL waves, let's skip ahead here and take a look at the combination of the two. The X-ray snapshot of Realized cap HODL waves provides great insight into the length of time that investors decide to hold their coin on-chain before they make the decision to sell (move their coin). Lets categorize these cohorts as demonstrated in figure 1.1 (1-7d, 7-30d, 30-90d, etc), and get an X-ray snapshot into asset holders and their decision making process.
Part 1.1: How can we model investor behavior from this?
By modeling the time held we can statistically analyze the behavior of these bitcoin holders and quantify the point in time these various cohorts decide to move their coin. Glassnode’s statistical research quantified short-term holders (STH) as those that are likely to move their coin within 155 days of their initial purchase, and vice-versa for long-term holders (LTH) are those which hold their coin >155 days and are less likely to sell after that 155d holding period is breached. Take a look at the top graph below (Figure 1.0: Realized Cap HODL waves - STH & LTH):
📷

Part 1.2: Deep Dive into the mice behavior
Whoa that's a mouthful! But a very interesting and mathematical way to quantify human behavior distinctively, and don't take my word for it, just take a look at the graph above in Figure 1.0 and 1.1. Take a look at LT holders, they start moving their coin as the price of BTC was rising and peaking. WHY? At this point we can make theoretical assumptions that they are more likely to understand the cyclical waves of BTC. They have weathered the ups and downs and they are more likely to advantageously realize profits on net average in comparison to their amateur holders (A.K.A. the short-term holders). If we were to look at Bitcoin's history, you will see the nature of investor behavior and the very cyclical pattern oscillating throughout the course of history.
In the graph below (Figure 1.2), take a look at the visible oscillations these cohorts presented historically - oscillation, almost as clear as a sinusoidal wave made when you play that guitar string, just not as visible to our naked eye. Historically when BTC's price was in bull mode (white line), the LT mature holders (red line) were periodically selling to the immature ST holders that were buying when the peak of misleading media was shooting for the moon. Note, the media can be biggest propaganda engine, so institutions attempting to propel mice action know exactly how to do so.
I guess this is why I have become so fascinated with BTC in the first place. It is purely mathematical, a pure description of human behaviors buying and selling a digital asset, which up to this the current date had only been experimental. Although given that at this time the realization for a safe monetary storage becoming increasingly relevant, more institutional buyers are in line to make larger purchases, and as time goes on this network will only become harder to predict.

Part 1.3 Mathematical Assumptions
Alright... Now the part where we interpret the market's behavior in comparison to other historical measures. According to the current results, a larger % of holders today fall under the category of LT holders. 22% of holders have held their coin for 1-2 years, which is the majority of holders. When comparing the results from a year ago, we had almost equal contribution from ST holders which held a total of 36% out of 88% of coin currently circulating on the market. So we can infer the retail market is not interested in the current purchase of BTC and has not been over the last (roughly) 180 days.
Let's hypothesize!
Is it the price? is the the fact that so many cryptocurrencies are shilling their coin promising riches, is it that liquidity is dwindling or are people scared to invest at these unsure times. Honestly the more I hypothesize about retail behavior the more I am primed to think these to be true, but it is fun to come up with scientific assumptions based on data you study, just take it with the grain of salt. :) This is just what the data shows, and if we are to compare it to other historical measures, I would be more inclined to HODL and DCA. Holder activity can give us clues into bull and bear market behavior, but lets also dive into more metrics to give solidity in our thesis.
My opinion? remember grain of salt, I think we are currently experience bear market activity based on behavioral aspects of hodler cycles.
Part 2.0 - Quick Metric Dashboard View.
This will just be features of metrics I use in my database on excel. There will be more information regarding these metrics so do let me know which you would like me to be more descriptive on in my next analysis.


Also follow me on twitter for more updates on macro/BTC and more!
Thanks for reading! please let me know what you think and how I can improve on my work, what else you would like to see and ask questions if you got them!
Best Regards,
NeuroInvest 😎
Twitter Handle:
NeuroInvest
@Daily__Dopamine
Thanks for reading!
If you enjoyed this insight please leave a like, join discussion in the comments and share it with your friends!
Never miss a post from NeuroInvest!
Get 'early bird' alerts for new insights from this author

Conversations (0)