
Green SUSHI bounce and a red background

Assets covered: SushiSwap (SUSHI)
Metrics used: Active Addresses, Trading Volume, Token Velocity, Exchange Inflow, Whale Transaction Count, Network Profit Loss, MVRV, Supply Distribution, Daily Active Deposits
Oh, what a Monday! Market is blossoming. One of the coins bouncing nicely is SUSHI. It is also showing some strength on metrics. Which ones?
Active addresses in a steady uptrend
The amount of addresses interacting with the network continues to be very strong. 2.5K addresses is not bad, especially when it didn't really dip during a weekend. Quite impressive.
Trading volume seems aligned with growing network activity

This chart also continues to rise. Falling a bit on a weekend but coming out strong lately. So there's definitely some amount of demand/interaction with SUSHI.
Token velocity

Shows the average number of times that a single SUSHI token changes addresses daily. Higher token velocity means that a single token is used more often in daily transactions.
And it's highest since January!
Exchange Inflow

A big spike at the bottom should be a good sign for SUSHI overall. Cause it's clearly showing some amount of crowd capitulation. Lots of people depositing tokens to exchanges to exit positions.
Whale Transaction Count

This chart is spiking like crazy, and spiking at the bottom. Based on our backtest, usually this metric spikes around local tops. But here it would suggest that whales were exiting the market. If you combine this with exchange inflow, it paints a picture of whales capitulation.
Network profit loss

Capitulation is here too. A dip in this metric is indicating that a huge amount of SUSHI is moved (to exchanges) at a loss. It's good for possible price recovery. Cause it's another sign that people giving up on Sushi.
MVRV

This onchain metric aims to quantify the average profit or loss of all addresses that have acquired SUSHI within a certain time frame. SUSHI’s 30-day MVRV ratio have dipped to almost -44%, indicating that all addresses that have acquired SUSHI in the past 30 days were - on average - down 44% on their initial investment. And MVRV is still very low. A potential for bounce back isn't guaranteed. But we're quite undervalued.
Supply distribution by balance of addresses
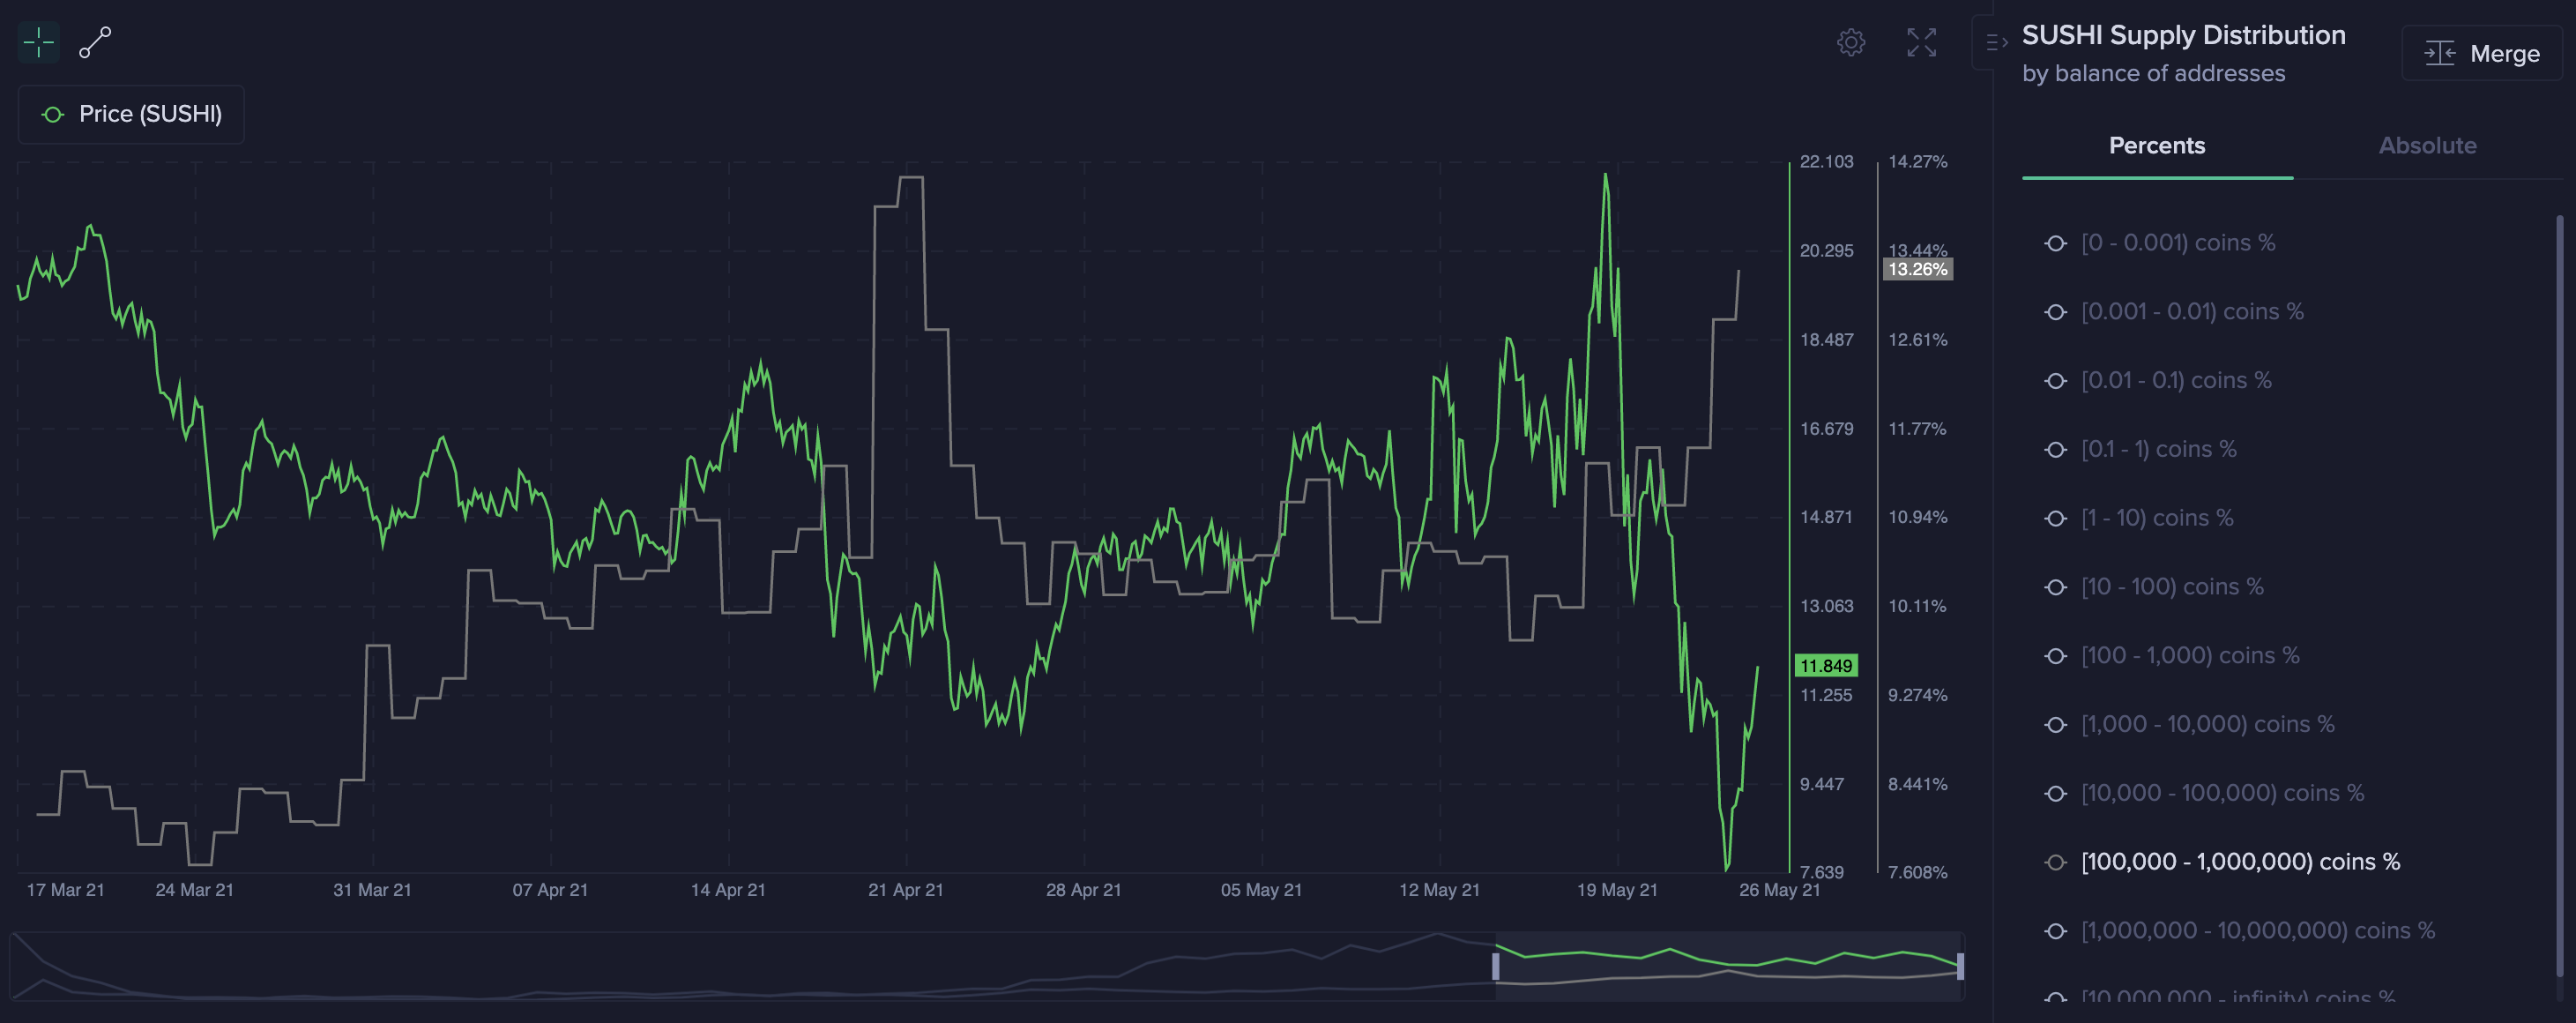
From 100K to 1M SUSHI - last time this group of holders accumulated seems to have been around the dip, so it's not necessarily that bad. The thing is we're seeing spikes in exchange inflow and the only group that we are really seeing increasing their balance is 100K to 1M. So these could be exchange wallets rather than general whales.
Daily Active Deposits

A strong increase in DAD is concerning. More and more transactions are being made to deposit SUSHI to exchanges. It's a sign of growing sell pressure.
Summing up
There might be a chance for potential SUSHI price recovery. And a chance to keep dumping too. Volumes are good, but behaviour part is lacking some confidence yet.
Watch this space.
Disclaimer: The opinions expressed in the post are for general informational purposes only and are not intended to provide specific advice or recommendations for any individual or on any specific security or investment product.
Conversations (0)