Gauging Bitcoin’s end-of-year potential | Santiment Weekly Report

Following another (failed) attempt to reclaim the $50k mark, Bitcoin is down -6.7% to start the week and hovering around $47,000 at the time of writing.
In light of the upcoming FOMC meeting, it seems like the retail sentiment towards the top coin is starting to turn south in a hurry.
But what could the growing bearish bias mean for Bitcoin’s end-of-year potential?
In Santiment’s weekly Pro report, we dive deep into Bitcoin’s latest social and on-chain data, and what it suggests about the current state of the crypto market:
Bears (re)awaken
With Bitcoin’s ongoing struggles to breach $50k, it seems the retail patience may be starting to wear thin.
According to text data collected from over 1000 crypto-related social media channels (including Telegram, Reddit, Twitter and more), the average sentiment towards Bitcoin is currently at a 30-day low, pivoting from bullish to predominantly bearish in a span of one week:

As you can see, the average BTC bias briefly spiked to positive over the weekend, as the top coin managed to hold an established support level. The excitement waned quickly, however, possibly (at least in part) due to the upcoming Federal Open Market Committee (FOMC) meeting scheduled for this Wednesday.
Whatever the catalyst, today marks the lowest that Bitcoin’s sentiment has been since the start of the correction, perhaps signaling a wider shift in retail confidence to end the year.
Further signs of this may be found in the amount of ‘buy the dip’ mentions collected by our servers, which soared around the December 4th crash but have struggled to maintain the same momentum since:

Overall, it seems that the crowd may finally be giving in to Bitcoin FUD, which may not be the worst news for the market. Based on several backtests of our social data, it is the overwhelmingly bullish sentiment and high retail confidence that have marked periods of price depreciation for Bitcoin in the past.
As we mentioned in last week’s report, a sustained drop in BTC-related sentiment may help provide fertile ground for price recovery, especially if other fundamentals remain solid.
And it’s not just the retail sector that’s turning bearish; on several high-volume exchanges, Bitcoin’s funding rates have evidently started to slide downward over the past 24 hours:


Bitcoin’s funding rate is the fee paid by one side of the perpetual contract to the other. When the funding rate is positive, it suggests a net bullish bias among derivative traders, since BTC longs are paying BTC shorts. When it’s negative, it signals a more negative outlook as BTC shorts are paying BTC longs.
At the time of writing, Bitcoin’s funding rate sits at -0.007% on Huobi, -0.025% on OkEX and hovers at or slightly below breakeven on Binance, Bitmex and several others.
For Binance, this is the first time that its BTC funding rate has turned negative since the December 4th crash. For others, the drop is even more pronounced; Huobi’s latest dip into negative funding rates, for instance, is its first since early October.
On the whole, a sustained decline in funding rates may signal a loss of confidence among derivative traders, as they pivot to net short in the near term. As for what that could mean for the market, it’s worth noting that extremely high funding rates have coincided with local price tops and periods of price consolidation for BTC throughout the past year, as seen on the above charts. On the other hand, Bitcoin’s July and October bottoms (respectively) occurred at a time when funding rates were decidedly negative on several high-volume exchanges.
All that said, the latest drop to negative funding rates is still minimal, and has only started to emerge on most exchanges in the past 12 to 24 hours. A more sustained drop-off in the coming days (and weeks) may well be needed before proclaiming a clear bearish consensus among derivative traders.
Signs of network tenacity?
While Bitcoin-related sentiment seems to be tanking, its network-level activity has recorded another strong week.
Since the December 4th crash, the amount of addresses sending or receiving BTC has actually been on a steady incline, peaking at 1.11m last Friday. For context, this is only the fifth day since the May correction that Bitcoin’s daily active addresses have managed to break above 1.1 million:
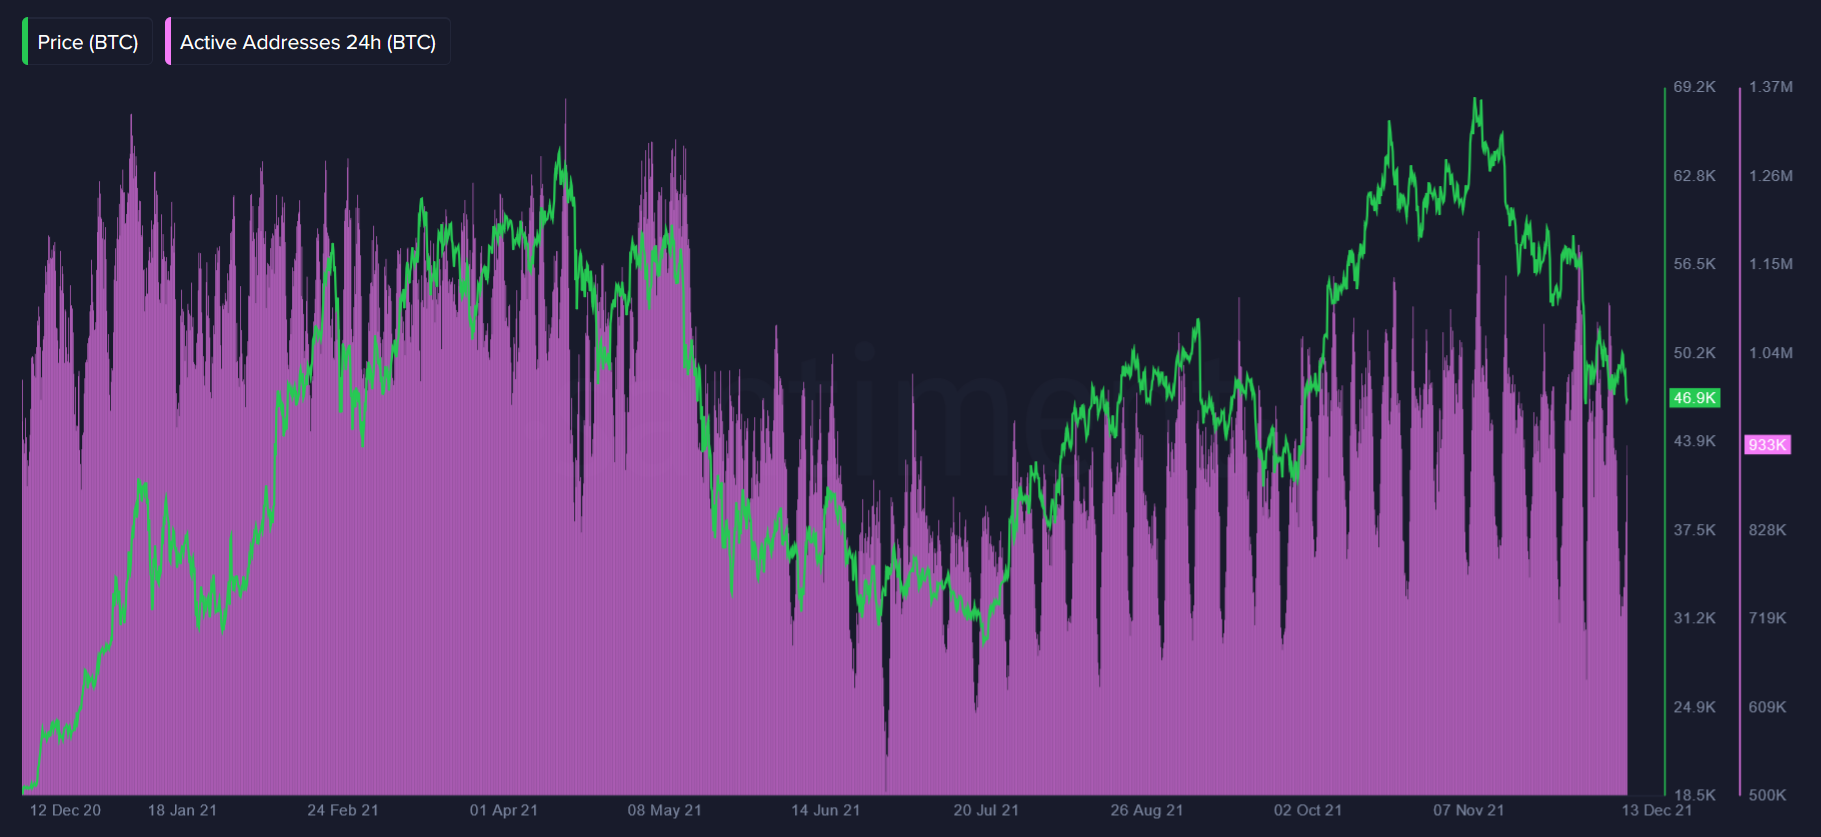
And yes, Bitcoin’s daily active addresses have deflated in the past 48 hours, but that’s an expected weekend dip.
The real question is what happens with Bitcoin’s network-level activity in days to come. Should Bitcoin’s addresses prove to be able to maintain the same upward momentum - especially if its PA remains flat - it could signal a potential bullish divergence and fundamental support for another bounceback.
Along the same lines, the amount of unique BTC moving addresses daily has remained relatively unchanged despite a month-long correction, suggesting a lively network and plenty of intraday value transfer despite the tanking market capitalization:

As mentioned on our Friday market stream, this is also why Bitcoin’s NVT model has been flashing bright green as of late, suggesting potentially undervalued conditions based on the dynamic between Bitcoin’s market cap and its on-chain circulation:
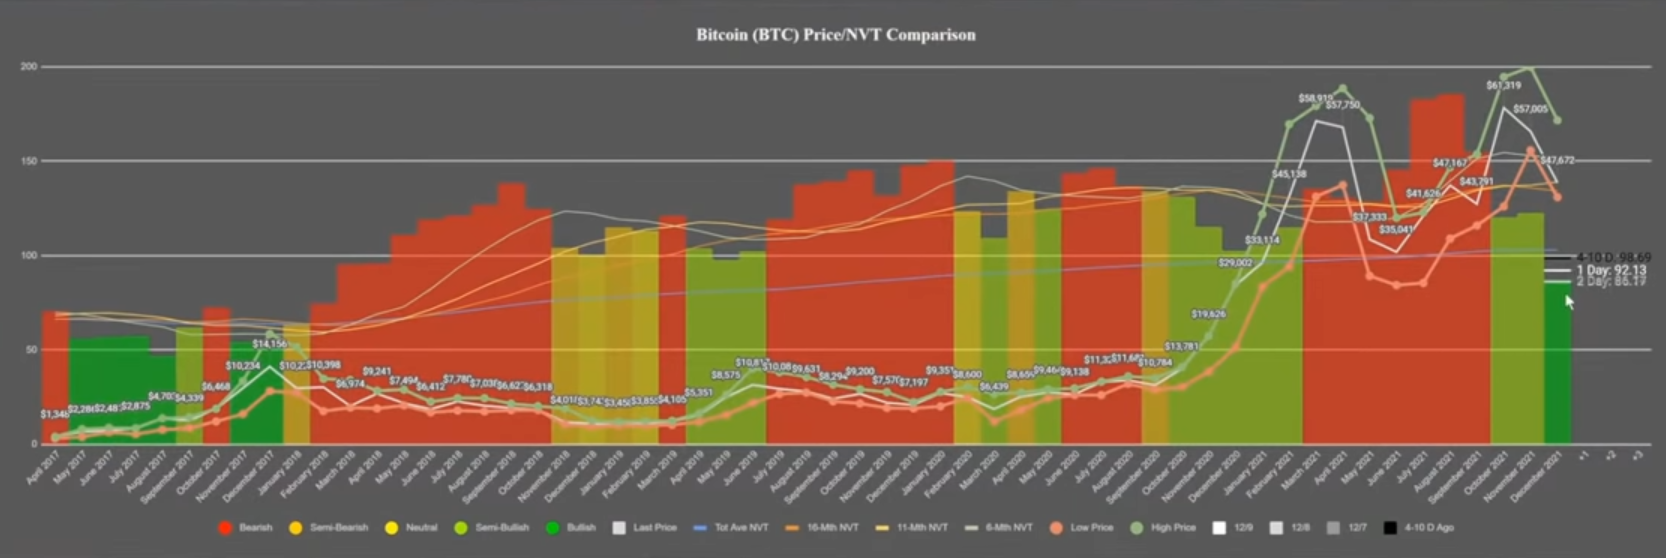
On the whole, it is certainly notable - if not surprising - that Bitcoin’s on-chain activity hasn’t slowed down much despite its ongoing price woes. But will the trend continue even as market sentiment starts to ostensibly turn on the benchmark coin? Watch this space.
Perhaps slightly more concerning is the recent behavior of large BTC addresses in particular. In the past 7 days, the combined balance of addresses holding between 100 and 10,000 BTC has dropped by roughly 40,000 BTC, or ~$1.86bn at the time of writing:

The decline may point to short-term profit taking by some BTC ‘whales’, and a lack of confidence in the coin’s end-of-year potential. Looking at the behavior of large BTC addresses over the past 18 months, it’s worth noting that several ‘accumulation sprees’ have coincided with periods of price appreciation for Bitcoin - and vice versa.
As for the potential sell-side pressure moving forward, it’s good to take a look at Bitcoin’s MVRV ratio, an on-chain metric that attempts to quantify the average profit or loss of all addresses that have acquired BTC within a certain time frame.
At the time of writing, Bitcoin’s 30-day MVRV ratio sits at -12.46%, suggesting that the average loss of all addresses that have acquired BTC in the previous month is -12.46%:
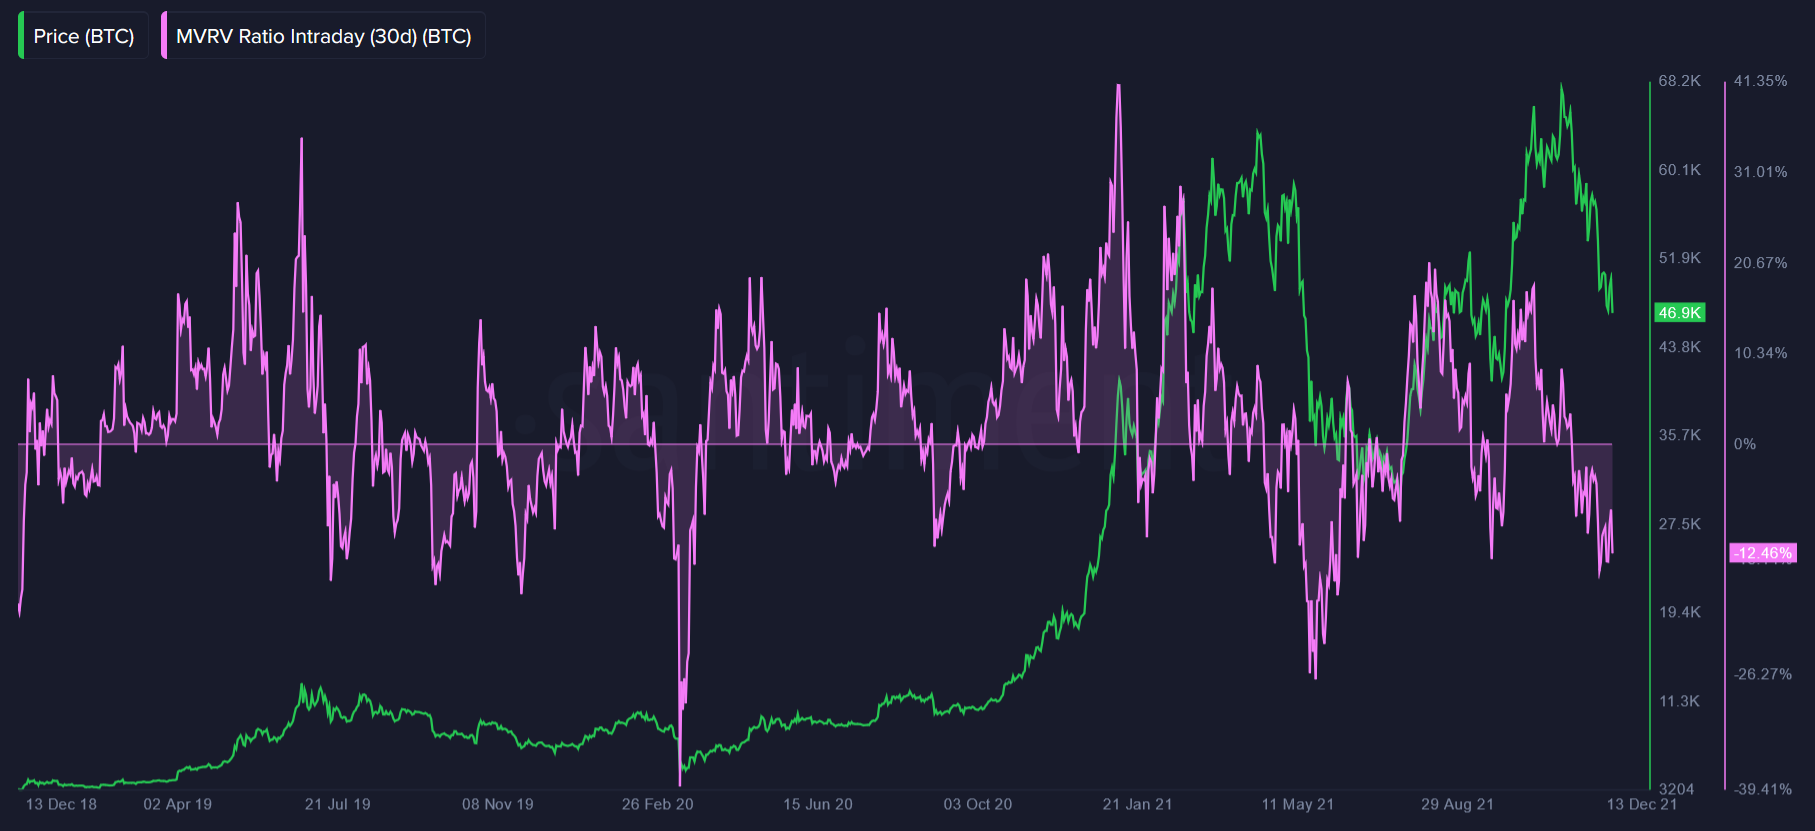
As a rule of thumb, the higher the MVRV ratio, the greater the unclaimed profits and - in turn - the higher the risk that BTC holders will begin to sell and reduce their exposure. This is why some on-chain analysts believe that extremely high MVRV ratios indicate ‘overvalued’ conditions, while very low MVRV ratios may present an opportune time to accumulate.
As noted in last week’s report, Bitcoin’s 30-day MVRV has shown a tendency to ‘bottom out’ between -15% and -25% in the past, suggesting, at least in a vacuum, potentially undervalued conditions. With the latest drop back to $46k, Bitcoin is once again approaching the historical ‘bounceback’ zone for its short-term MVRV ratio. Still, past performance is not necessarily indicative of future results.
Furthermore, Bitcoin’s 365-day MVRV ratio has also dipped into negative and now sits at a 4-month low of -1.6%:

As seen above, Bitcoin’s long-term MVRV ratio is still some ways away from reaching its historical bottoms. That being said, the correction has still done much to reset the uncomfortably high MVRV ratios for the top coin (and most other cryptocurrencies), allowing for some breathing room to the upside before we reach overvalued conditions once again.
Overall, as the wholesale sentiment starts to turn sour, it is at least hopeful to see Bitcoin’s network-level metrics hold their ground for the time being. Still, the ongoing decline in ‘whale’ balance remains a cause for concern, especially in light of the upcoming FOMC meeting.
In days to come, we’d suggest keeping an eye on social sentiment and funding rates in particular - a more sustained decline could suggest a fast-forming bearish consensus, which may provide space for another end-of-year price push.
Disclaimer: The opinions expressed in the post are for general informational purposes only and are not intended to provide specific advice or recommendations for any individual or on any specific security or investment product.
Thanks for reading!
If you enjoyed this insight please leave a like, join discussion in the comments and share it with your friends!
Never miss a post from Ibis!
Get 'early bird' alerts for new insights from this author

Conversations (0)