Ethereum Health Checkup: Are Prices at a 55% Discount, or is This the Middle of a Long Decline?

For the many who presumed that sub-$2,000 Ethereum could never be a thing again as prices were soaring about $4,000 just six weeks ago, it's been a wild ride. Here's how things look now:
Bullish Signs
MVRV (30-day)

Historically, an average MVRV (30d) of -16.9% implies a less risky opportunity to buy than normal.
Weighted Social Sentiment (Twitter)

The crowd sentiment toward Ethereum is historically low now, a great potential opportunity to buy against the masses.
Average Fees

ETH fees are at their lowest point since December, 2020, clearly allowing more flexibility for users to move assets.
Neutral Signs
Active Addresses vs. Deposits

There was a pretty large uptick in active deposits a few days ago, but more or less, non-active addresses vs. active deposits are about even with one another, historically.
Bearish Signs
Supply on Exchanges
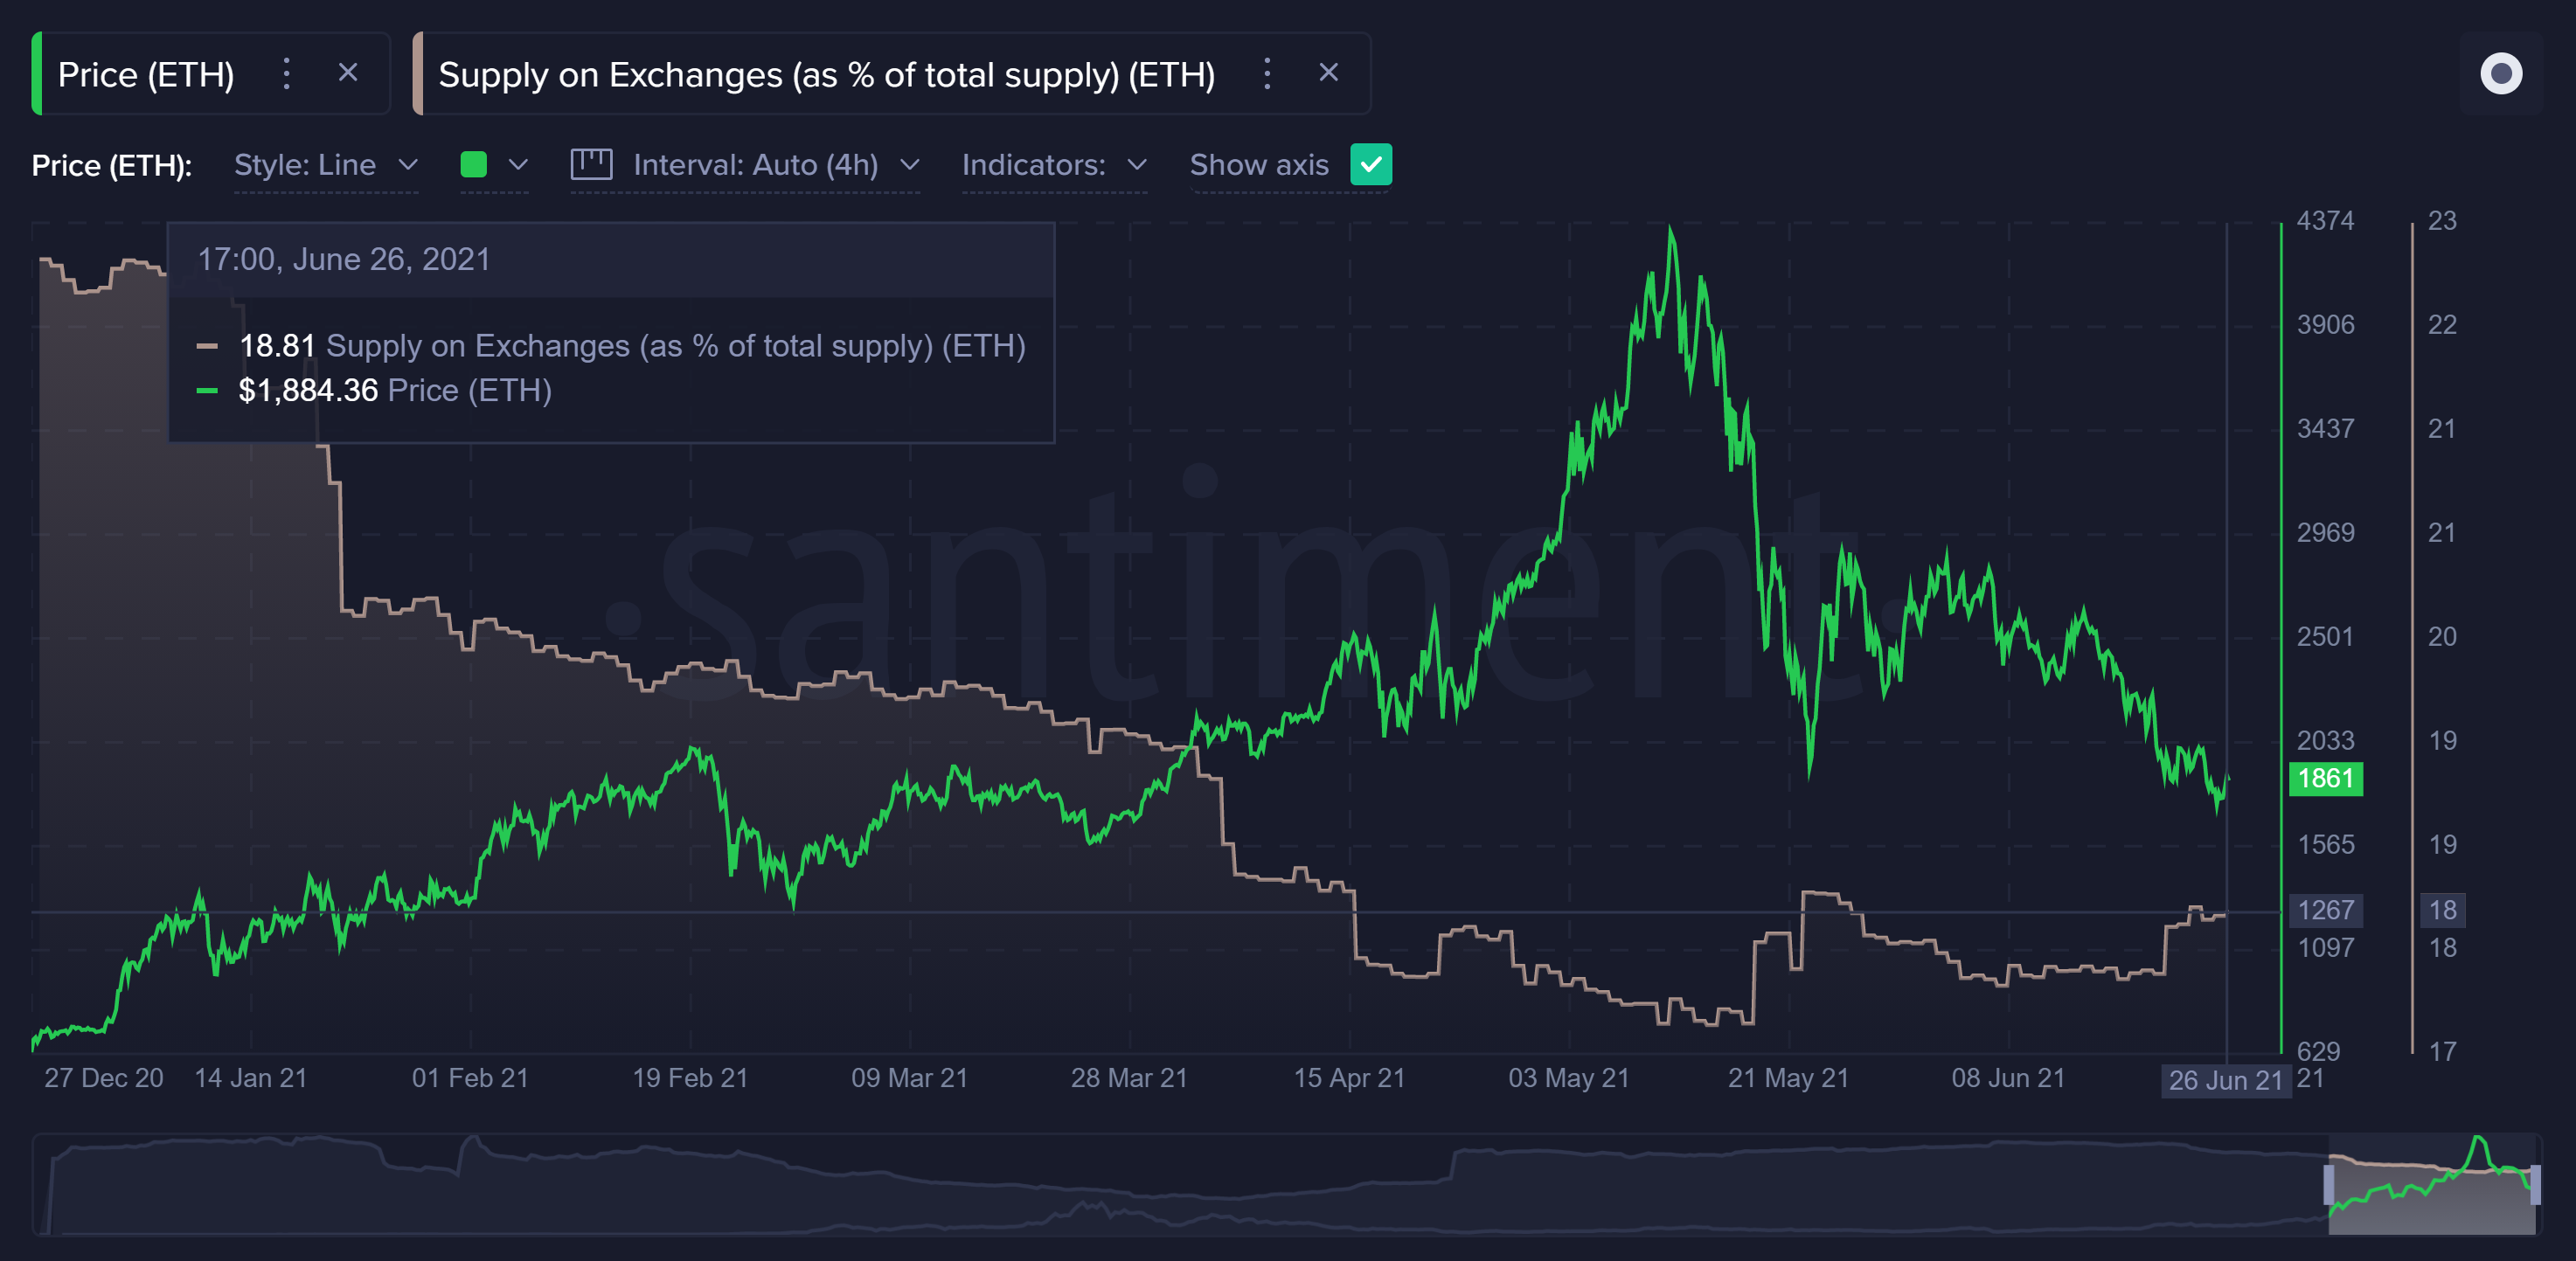
Supply has moved back to exchanges considerably since May's all-time high.
NVT

Token circulation has dried up heavily compared to market cap.
Thanks for reading!
If you enjoyed this insight please leave a like, join discussion in the comments and share it with your friends!
Never miss a post from brianq!
Get 'early bird' alerts for new insights from this author

Conversations (0)