Bold Predictions, Vol. XI - Bitcoin Ranging Leading to Order Book Estranging

SANBASE SIGNALS
June 30, 2020
Welp, the $9k ranging of Bitcoin seems to refuse to end. And as we turn our calendars to July, there is one thing that is certain... uncertainty is high. Social sentiment has gradually turned from positive to negative over the past month, and the two-month swinging in the $9,000 range (which a 10% ranging over 2 months would be acceptable and normal in pretty much any other asset class) has caused BTC traders to begin getting restless and impatient. Transaction volume has taken a mild dip, and even daily active addresses are starting to show signs of inconsistency. Regardless, another week is in the books, and there are always new developments in the crypto world to explore in our Bold Predictions series.
As always, we continue to offer 25% off your first month's subscription on any Santiment subscription you have your eye on! Just take 15 seconds to provide feedback for us on this poll. Then just visit the Sanbase pricing page to get started with your 25% discount now, and enter SIGNALS25 at checkout!
Any help needed on redeeming this, just email us at support@santiment.net. With every weekly volume we release of our Bold Predictions series, we are taking a look at the most recent three-day averages (or percent changes) for each metric we're covering. As a reminder, these signals are for intra-day traders to assess local tops and bottoms based on historically solid leading indicators. Our rating system is simplified for this week. A 0 to 10 scale, with 0 being as bearish as possible and 10 being as bullish as possible. This would mean that a 5 would be neutral and imply sideways movement estimates over the next week. Whether we call a project bullish or bearish for the next week or two, please remember that this has no relevance to what we think of the asset's long-term viability as an investment.
----------------------------------------------------------------------------------
This Week’s Assets:
- BTC, ETH, BAT, LINK
This Week’s Metric Breakdowns:
- DAA vs. Price Divergence, MVRV Long/Short Diff, NVT (Token Circulation), Sentiment Volume Consumed
----------------------------------------------------------------------------------
Bitcoin ($BTC) - #1 Ranked Market Cap
Daily Active Addresses vs. Price Divergence
- 3-Day Movement: +1.4%
- 30-Day Movement: -3.1%
- 90-Day Movement: +38.8%
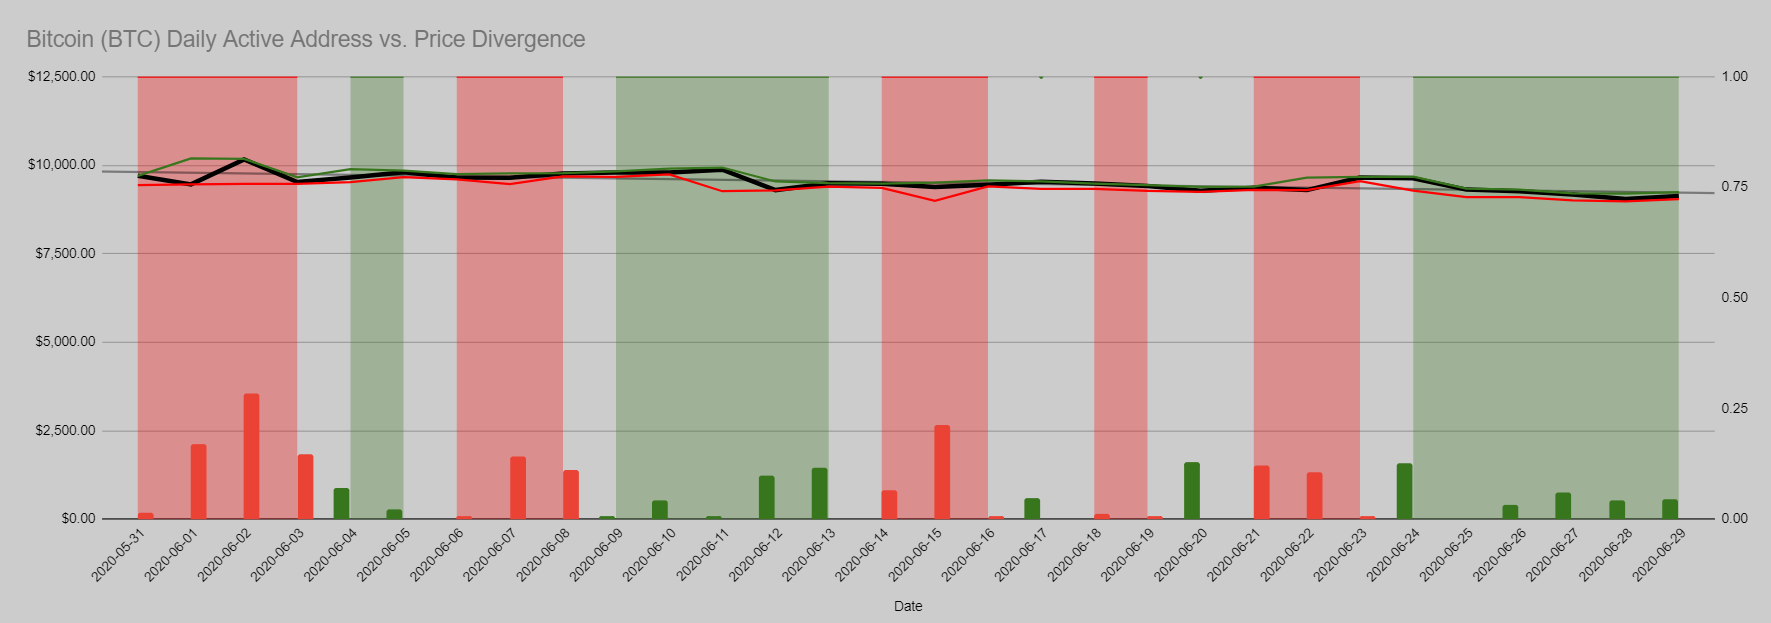
With a drop from $9,650 to $9,150 over the past week, daily active addresses have more or less dropped around the same level on a rolling average basis. There doesn't appear to be any outliers forming, which is a sign that this model is accurately showing that BTC is more or less staying in line with its daily active addresses as its price has mildly pulled back. We'll give it just a hair toward the bullish side since the last 4 days have shown a very minor bullish divergence.
Rating: 5.5
MVRV Long/Short Diff.

The average investor, when combining long-term and short-term traders, are actually at their highest level of return since Black Thursday, in spite of the back and forth ranging that can often lead to investor mistakes. As discussed in a Tweet we posted earlier today, the average trader is +6.1%, as this MVRV Long/Short Diff. metric indicates. This matches the 2020 high that was last seen in late February. Unfortunately, from a foreshadowing standpoint, we like the chances of an asset rising best when the average investor is under water. They aren't seriously in the green by any means, but considering the psychological influence of matching its year-to-date high, a pullback on this metric (and the price) is a bit more likely than usual heading into next week.
Rating: 3.0
NVT (Token Circulation)
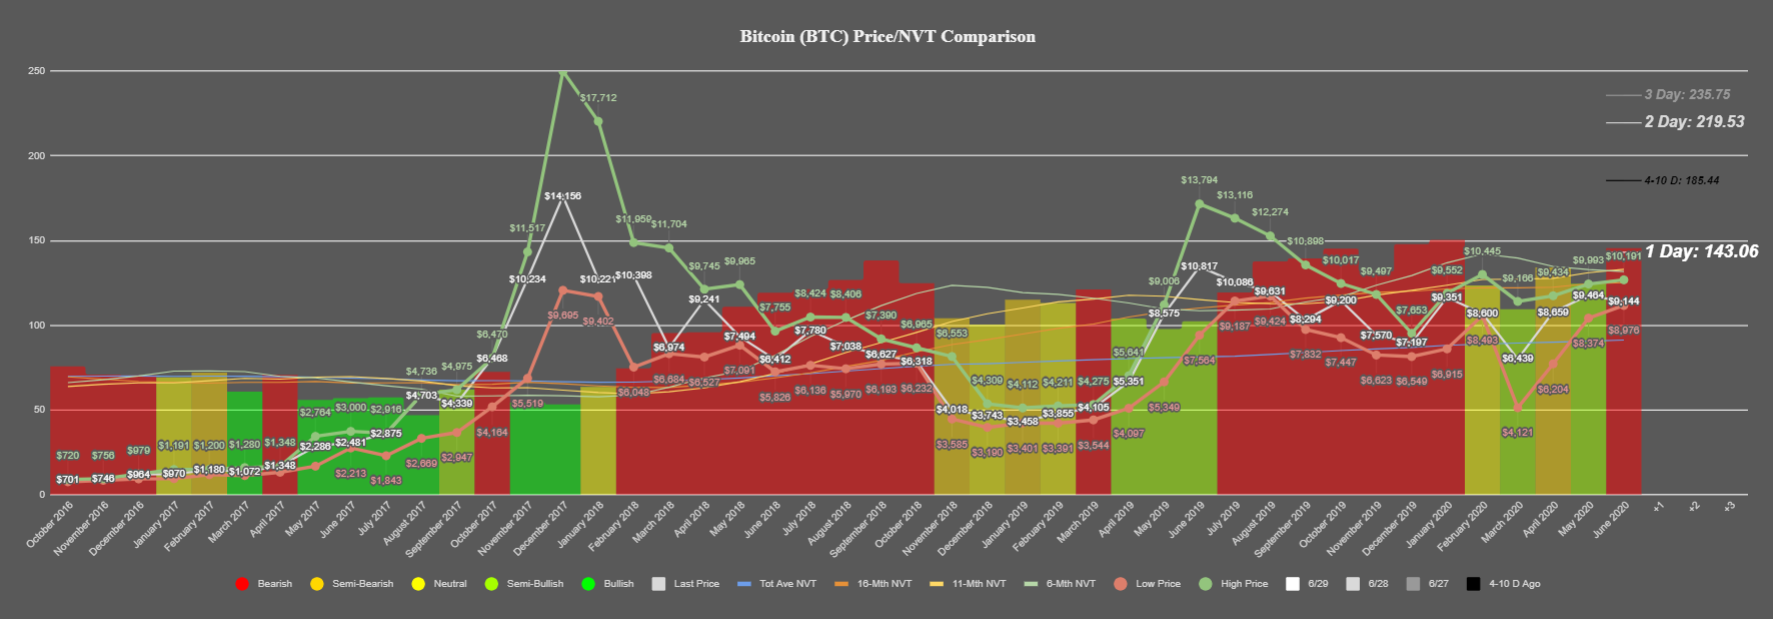
Bitcoin's unique tokens circulating on its network was looking promising in mid-June, but over the past week in particular, token circulation has significantly dropped off. This indicates complacency and uncertainty in the market, which those two combined descriptors are usually a bad sign for bulls. Our NVT model is now indicating that a bearish divergence has formed after the past 10 days have all been well above our NVT model's trendlines, which imply that we are getting a serious deficit as of late in comparison to Bitcoin's current market cap. After peaking at 492k tokens on Mar 12, Bitcoin's highest June peak in token circulation was just 274k, occurring about four weeks ago.
Rating: 2.0
Sentiment Volume Consumed

If there is a solace to Bitcoin's concerning lack of on-chain activity over the past week, it's the fact that people appear to be more inactive due to fear of a drop, as opposed to contentment due to an anticipated surge up to $10k again. The Sentiment Volume Consumed appears to show that the negative expectations that began in early June have only grown slightly as the month progressed. And with a standard deviation below the mean of about -0.59, this is in the ballpark of as low as it has been for the past year. So buy opportunities could be approaching with anymore movement toward -1.00.
Rating: 7.5
BTC Average Rating: 4.5 (Neutral/Slightly Bearish)
----------------------------------------------------------------------------------
Ethereum ($ETH) - #2 Ranked Market Cap
Daily Active Addresses vs. Price Divergence
- 3-Day Movement: +1.3%
- 30-Day Movement: -2.4%
- 90-Day Movement: +66.1%

Ethereum's daily active addresses have been ascending quite incredibly, and things actually hit a 2-year high for single day unique transacting addresses. Nine straight days of a mild bullish divergence are great to see on this chart, but it would be nice if things were a bit closer to +0.5, which is typically the threshold we wait to look for as an indication for a serious buy opportunity. Obviously with a slightly bearish outlook on BTC right now, this needs to be taken with a grain of salt. But it's still wonderful to see a continuously rising DAA divergence for ETH.
Rating: 7.0
MVRV Long/Short Diff.

The average long and short-term Ethereum trader is estimated to be up roughly +15% on their positions right now, and this has likely brought a level of satisfaction for many holders, traders, and believers of the #2 market cap project. Unfortunately, satisfaction is generally bad in crypto markets. Things move up when fear is at its highest, and things move down when contentment is at its highest. Right now, we are much closer to the latter than the former, and +15% is a high enough return level where we need to be fairly skeptical of things moving higher, especially with it on a downtrend in the past week.
Rating: 2.0
NVT (Token Circulation)

Lending to the rising daily active addresses of Ethereum, token circulation is naturally going to be quite healthy when we've just hit a 2-year DAA high. For its third month in the last four, it looks like ETH has a legitimate bullish divergence in terms of its token circulation compared to its market cap. It seems highly likely that Bitcoin's NVT being on the other side of the spectrum is one of the key things holding back ETH and continuing to make this simply a divergence without a surge toward $300 just yet.
Rating: 9.0
Sentiment Volume Consumed

Ethereum's sentiment was hitting some pretty high positive levels earlier this month, but as June is coming to a close and prices have sunk from a month-high of $251 to a market value of $225 at the time of this writing, it appears that the stagnation has shifted the mood from extremely positive to mildly negative. At similar levels from the mean compared to Bitcoin's, Ethereum's negative sentiment sitting at -0.51 is significant enough to really catch some detractors of ETH off guard right now.
Rating: 7.0
ETH Average Rating: 6.3 (Slightly Bullish)
----------------------------------------------------------------------------------
Basic Attention Token ($BAT) - #32 Ranked Market Cap
Daily Active Addresses vs. Price Divergence
- 3-Day Movement: -6.6%
- 30-Day Movement: +20.4%
- 90-Day Movement: +76.5%

BAT saw some serious decoupling from Bitcoin over the past week, as its DAA surged and prices followed with some upward movement and increased volatility. With a jump in standard deviations from the mean above 1.0, this was a pretty serious boost in active addresses. However, by last Saturday, this surge had stopped. And we're actually now back in negative territory on the rolling 21-day average that this model reads the DAA output through to find divergences.
Rating: 4.5
MVRV Long/Short Diff.

BAT's MVRV Long/Short Diff. is essentially right at the break-even level, indicating that price movement could break either way heading into July. Often times, right at this 0% level, we'll see FOMO'ing occurring with many investors finally getting back into the green on their original positions. But with no confident MVRV crossover into positive territory yet, this is a complete crapshoot and a clear wait-and-see for now.
Rating: 5.0
NVT (Token Circulation)

Yep, you're seeing this right. Thanks to some DeFi hype and assistance via Compound over the past couple of weeks, BAT is closing out June with a likely all-time high bullish NVT signal. Not just this, but it's Basic Attention Token's fifth straight month with this bullish level, and each month of token circulation has improved upon the last. As an altcoin, the 32nd marktet cap coin will be reliant on BTC staying stable enough. And if it does, we can expect some almost certain future decouplings for BAT.
Rating: 10.0
Sentiment Volume Consumed
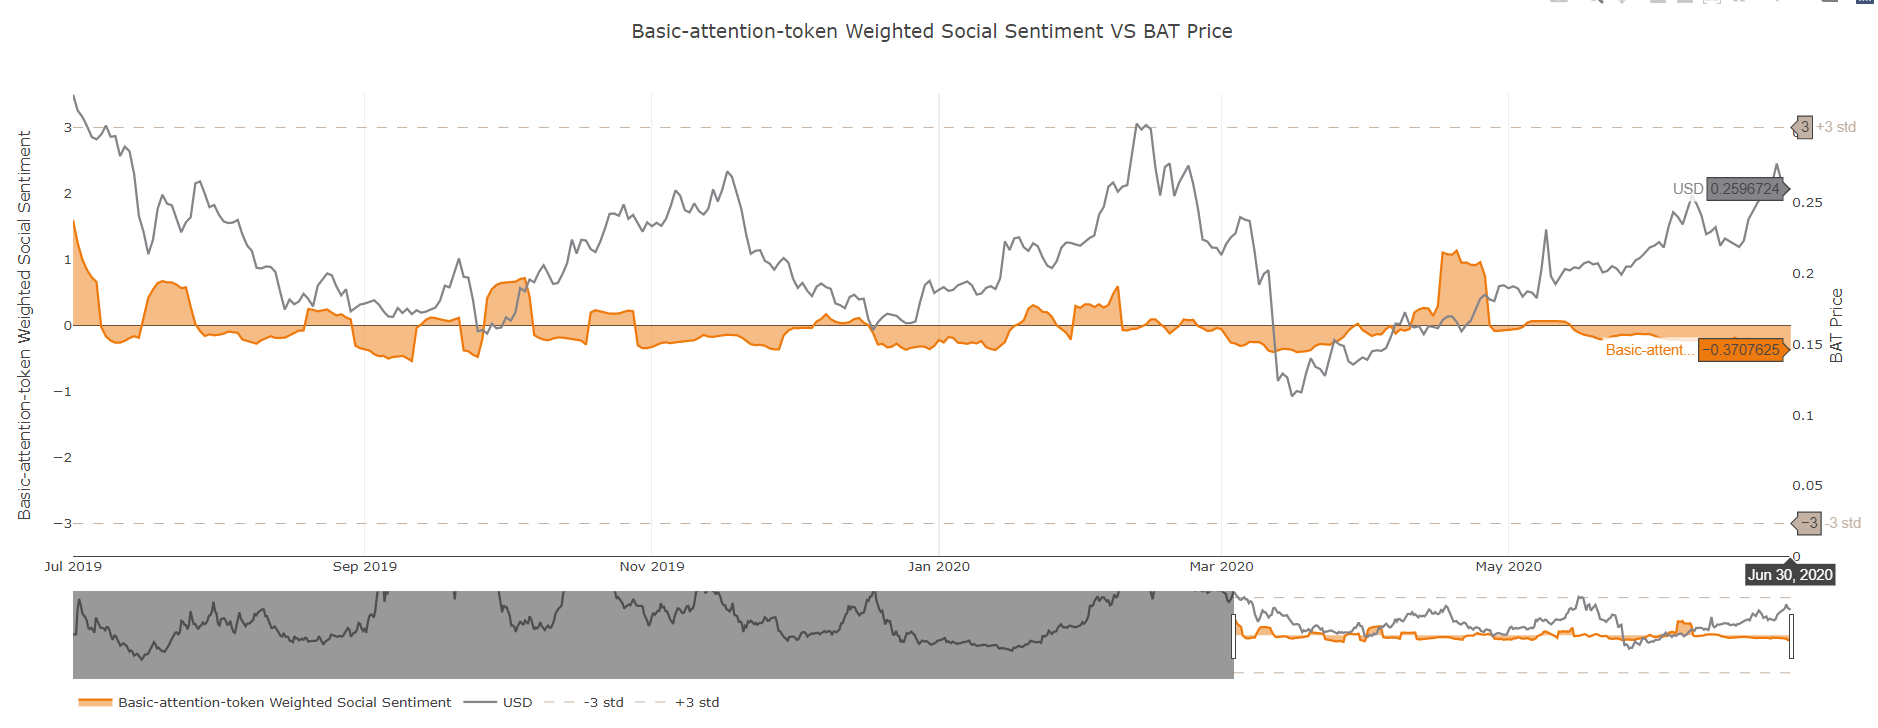
BAT doesn't always get the level of discussion it deserves, and that may be one of the reasons that its Sentiment Volume Consumed has more or less shown a slight negative bias pretty consistently for the past two months. The deviation below the mean of -0.37 isn't incredibly significant, and this can break positive very quickly like we saw in late April. But for now, it's actually a great sign that they positive hype has been so suppressed and overshadowed by other projects, in spite of BAT's +76.5% return over the past three months.
Rating: 7.0
BAT Average Rating: 6.6 (Slightly Bullish)
----------------------------------------------------------------------------------
Chainlink ($LINK) - #13 Ranked Market Cap
Daily Active Addresses vs. Price Divergence
- 3-Day Movement: +4.1%
- 30-Day Movement: +11.5%
- 90-Day Movement: +101.2%

LINK has been in a pretty similar situation to ETH in terms of its daily active address divergence from its price, and it's been a similarly modest 9 consecutive days of slightly bullish upward movement. It isn't quite rising steadily these past few days the way Ethereum's DAA is, but it's still nice to see that the ever-popular Chainlink is hovering close to around a +0.25 bullish divergence on this model.
Rating: 6.5
MVRV Long/Short Diff.

Chainlink's MVRV Long/Short Diff. has been hovering between +15% and +25% since late April, and it currently sits at a +17.8% return for the average LINK investor. Interesting to see that this metric has stayed in a pretty narrow range in spite of a +101% price return over the past three months. It's indicating that many have been profit taking on this incredible run by the 13th ranked market cap asset. However, not enough to merit a great buy opportunity here.
Rating: 3.5
NVT (Token Circulation)

Just like BAT, LINK is getting an abundance of token circulation right now. Five straight months of being well under the trendlines is great to see. And as long as things continue to look green heading into July, expect to see plenty more independent surges from Chainlink.
Rating: 9.5
Sentiment Volume Consumed

The consensus for LINK investors appears to be that a top has come in and we're bound to finally see one of the best performing assets since Black Thursday start to retrace on its large gains it saw in April, May, and June. A deviation from the mean of -0.71 on our Sentiment Volume Consumed model means that we are right about even with the lowest levels we have seen for sentiment in the past year. So this is an extra promising sign that something may be boosting Chainlink back upwards in the near future.
Rating: 8.0
LINK Average Rating: 6.9 (Semi Bullish)
----------------------------------------------------------------------------------
Ethereum and altcoins frankly look quite strong right now thanks to a big boost from all of the DeFi hype, and several other factors related to independent fundamental news for many projects. However, none of it will matter much if Bitcoin finally breaks down toward $8,000 again as many people are expecting. Just remember that when the crowd is expecting a break in one direction too universally, the opposite outcome is significantly more likely to come true. But no matter how "great" it is for the bulls that there is so much pessimism related to Bitcoin, the network still needs on-chain volume to succeed. And right now, this volume is painfully low. We predict a slightly negative week for crypto up ahead, if not another very neutral one like we've been seeing the past couple months. Let's see how things shake out!
Click this survey link to receive your 25% discount for your first month’s subscription to Sanbase, make your comments, and cast your votes for next week!
Thanks for reading!
If you enjoyed this insight please leave a like, join discussion in the comments and share it with your friends!
Never miss a post from brianq!
Get 'early bird' alerts for new insights from this author

Conversations (0)