Bold Predictions, Week XIII - Did the Crypto Markets Just Forget About the Top Two Blockchains?

SANBASE SIGNALS
July 15, 2020
Bitcoin and Ethereum continue to drive people nuts with their refusal to move. But for the altcoin enthusiasts, July has been a continued party full of decouplings, individual achievements, mainnets launching, and pumps... Lots and lots of pumps. However, our focus this week is going to be on what BTC and ETH look like they'll be doing once they finally break out of their $9,000-$9,500 range, and $225-$250 range, respectively. Also, we're going to take a look at the hottest alt under the sun, Chainlink, which recently cracked the top 10 on the market cap rankings for the first time in its roughly three year history.
We continue to offer 25% off your first month's subscription on any Santiment service you have your eye on! Just take 15 seconds to provide feedback for us on this poll. Then just visit the Sanbase pricing page to get started with your 25% discount now, and enter SIGNALS25 at checkout!
Any help needed on redeeming this, just email us at support@santiment.net. With every weekly volume we release of our Bold Predictions series, we are taking a look at the most recent three-day averages (or percent changes) for each metric we're covering. As a reminder, these signals are for intra-day traders to assess local tops and bottoms based on historically solid leading indicators. Our rating system is simplified for this week. A 0 to 10 scale, with 0 being as bearish as possible and 10 being as bullish as possible. This would mean that a 5 would be neutral and imply sideways movement estimates over the next week. Whether we call a project bullish or bearish for the next week or two, please remember that this has no relevance to what we think of the asset's long-term viability as an investment.
----------------------------------------------------------------------------------
This Week’s Assets:
- BTC, ETH, LINK
This Week’s Metric Breakdowns:
- NVT (Token Circulation), DAA vs. Price Divergence (2-Year Deviation From Mean), Sentiment Volume Consumed
----------------------------------------------------------------------------------
Bitcoin ($BTC) - #1 Ranked Market Cap
- 3-Day Movement: -0.7%
- 30-Day Movement: -2.5%
- 90-Day Movement: +29.5%
NVT (Token Circulation)

Bitcoin's NVT is continuing to look underwhelming, with token circulation not quite meeting the qualified expectations for the low $9,000 price level that it has been in for closing in on 4 weeks now, ever since the price plunged from $9,600 on June 24th. Part of the reason it plunged in the first place is because the month of June was signaling a bearish divergence on our NVT model as well. And with so much attention heavily weighted on altcoins right now, it's not surprise that BTC is starting to see some concerning neglect.
Rating: 2.5
DAA vs. Price Divergence (Long-Term Deviation)

Daily active addresses continue to look a bit more encouraging than token circulation for Bitcoin. But not by much. As is often the case during ranging periods, we will see assets fluctuate between slightly bullish signals during the week, followed by slightly bearish signals on weekends (where crypto as a whole tends to get lower volume). As a result of nearly three month pattern of no major extreme movement in either direction (excluding a particularly low amount of DAA in early June and a 2020 high in DAA on July 1st), things continue to look quiet and inconclusive on the Santiment DAA Divergence Model.
Rating: 5.0
Sentiment Volume Consumed
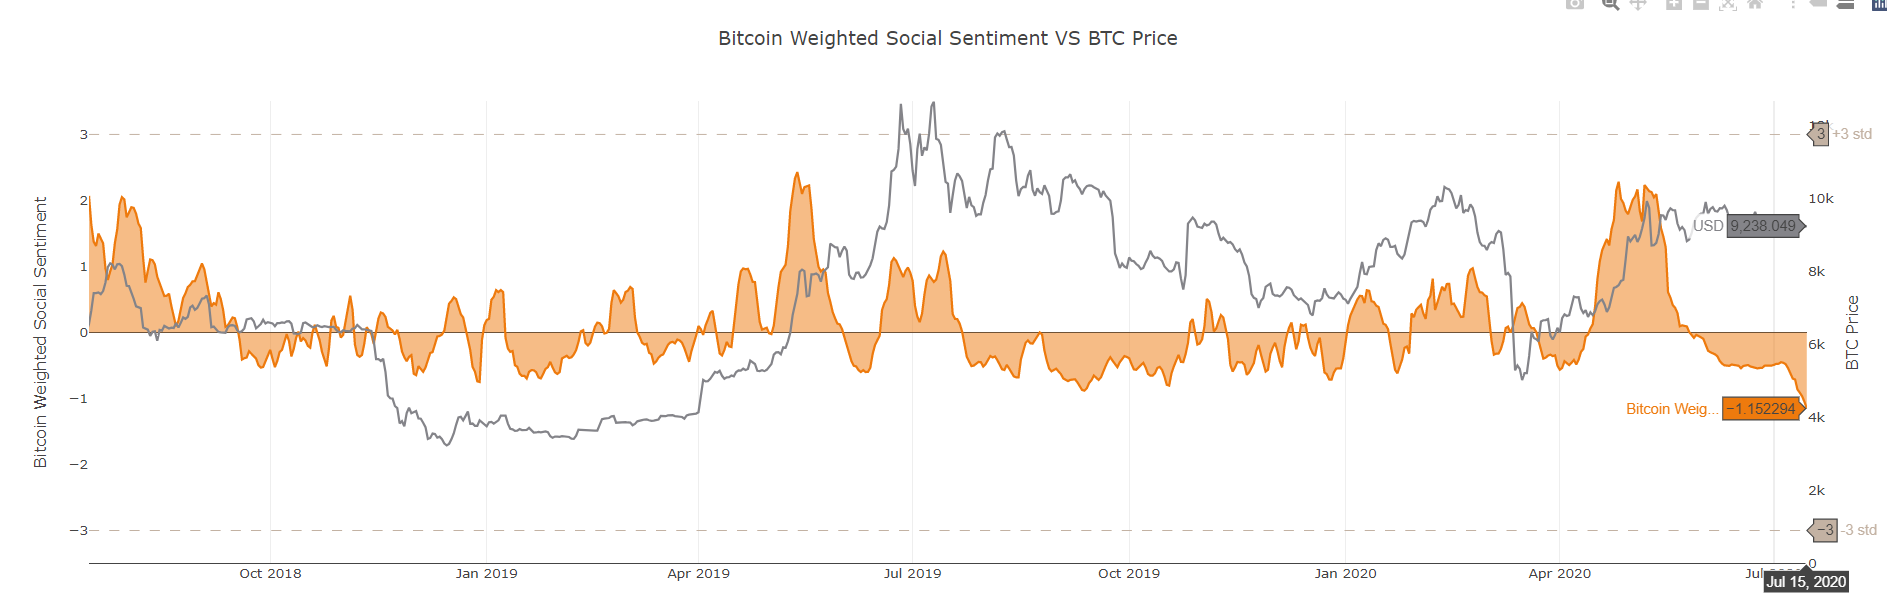
Sentiment has actually dropped significantly for BTC in the past week, and we are now at the most negative social sentiment for Bitcoin in the past two years, shockingly. This is likely being caused by a downswing in overall mentions, as social dominance has shifted over to altcoins so much since the Bitcoin halvening concluded two months ago. The net result of this is actually good for the bulls, as assets perform best when social perception is poor.
Rating: 8.0
BTC Average Rating: 5.2 (Neutral)
----------------------------------------------------------------------------------
Ethereum ($ETH) - #2 Ranked Market Cap
- 3-Day Movement: -1.2%
- 30-Day Movement: +4.1%
- 90-Day Movement: +38.9%
NVT (Token Circulation)

Ethereum is continuing to exceed Bitcoin significantly in the token circulation department. For an asset that is just itching to break free, it has been stuck in limbo as lower cap assets continue to shine at the expense of ETH following BTC's lead of... doing nothing. But the results of Santiment's NVT Model that when Ethereum finally begins moving again, it will move upward in a big way (barring a BTC collapse).
Rating: 8.0
DAA vs. Price Divergence (Long-Term Deviation)

We're seeing a whole lot of neon green on the DAA Divergence Model, indicating there is a top 10% divergence going on for Ethereum compared to every day over the past two years. And the model is indicating a super bullish divergence for good reason. Ethereum just had its 3rd and 4th highest daily active addresses in the past 13 months on Monday and Tuesday. In each instance of these groups of neon green bullish signals on Ethereum's past two years of history, it has been followed by a jump up in price soon afterward! Take this as objective, historical evidence of course. And not investment advice.
Rating: 9.5
Sentiment Volume Consumed

Ethereum's weighted social sentiment isn't quite as negative as Bitcoin's right now. But it's getting there after passing -0.5 deviations lower than its expected mean just yesterday for the first time since late March. The increasing negativity is likely due to the stagnation, just like we're seeing with Bitcoin. And the indifference to the #2 market cap token can be considered a positive sign. With enough people ignoring ETH while keeping their eyes on smaller caps, there will be an opportunity to catch the crowd off guard to make whale investors maximize their gains when they finally make their moves.
Rating: 7.0
ETH Average Rating: 8.2 (Bullish)
----------------------------------------------------------------------------------
Chainlink ($LINK) - #9 Ranked Market Cap
- 3-Day Movement: +9.2%
- 30-Day Movement: +103.0%
- 90-Day Movement: +129.8%
NVT (Token Circulation)
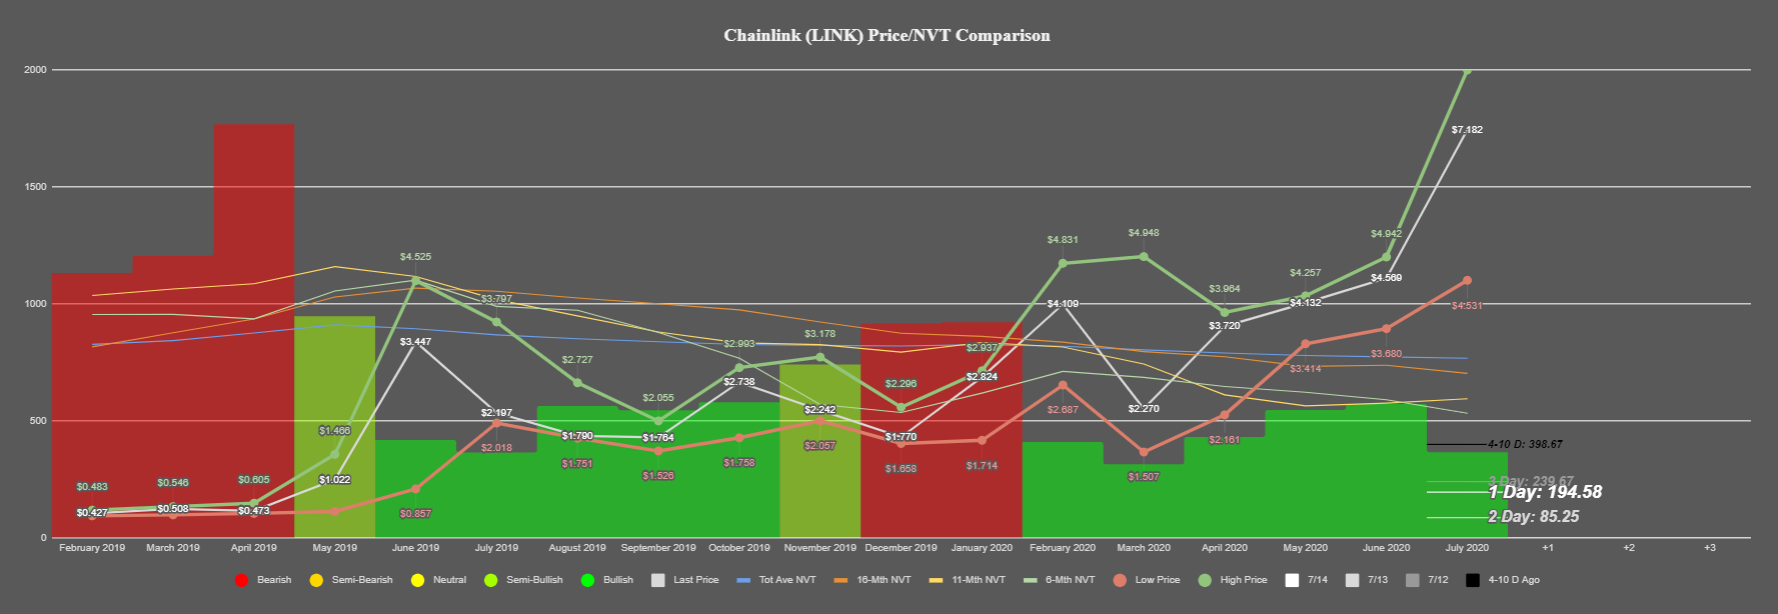
If you're wondering whether LINK's absolute surge into outer space these past couple weeks has been occurring in spite of minimal token activity, the answer is a definitive "no". Chainlink has been propelled by unique tokens soaring across the network at record high rates in July. Our NVT model shows that regardless of whether a lot of this was caused by FOMO, the fact of the matter is addresses are swapping LINK tokens right and left right now, and should keep volatility high over the next week at minimum.
Rating: 9.0
DAA vs. Price Divergence (Long-Term Deviation)

Monday set an all-time high for LINK with 14.3k active addresses, and Tuesday showed a nice encore with the second most of all-time with 10.5k. The pumps here have been no fluke, and the first initial neon green signal on July 4th was this model's first initial hint to our Sanbase PRO users that something big was about to be in the works. Due to the price jumping as high as it did, combined with a lowered DAA bullish signal on Tuesday compared to Monday, we are ticking down just how bullish this continues to look, by just a bit.
Rating: 7.5
Sentiment Volume Consumed

With so many things going right for LINK in July, the positivity toward the now 9th ranked market cap asset had to turn positive on Twitter... no matter how much disbelief there is that a rally like this can actually continue for such a sustained amount of time. With things surging into positive territory in just the past week, this is one of the few concerning signs for Chainlink right now. FOMO is very likely contributing to this rally, and if we see things drift into +1 deviations from the mean or more, it's a good sign to profit take for even the most stubborn (and profitable) of LINK holders right now.
Rating: 2.5
LINK Average Rating: 6.3 (Slightly Bullish)
----------------------------------------------------------------------------------
It's looking a lot like what many in the crypto community probably expect. Chainlink is off on its own planet right now, other altcoins are continuing to fair quite nicely, while Bitcoin and Ethereum are doing a whole lot of nothing. However, it may come as a surprise as to what different stories BTC and ETH are telling right now in their metrics. Bitcoin is doing what it often does during "alt seasons" (which now would definitely qualify as) and staying as flat as possible to allow smaller caps to separate from one another and distinguish the true perceived values by the crypto community before the next cycle of Bitcoin and Ethereum dominance. The big story in all this is that Ethereum's fundamentals look significantly better than Bitcoin's, in spite of the fact that it's performing nearly identically. So keep a close eye on Bitcoin, because any move toward $10,000 again will likely mean an even more rapid move toward $300 for Ethereum.
Thanks for reading!
If you enjoyed this insight please leave a like, join discussion in the comments and share it with your friends!
Never miss a post from brianq!
Get 'early bird' alerts for new insights from this author

Conversations (0)