Bitcoin’s $8400 Crash: What On-Chain and Social Data Tell Us
Note: this Santiment report was also featured on The Daily Chain. Be sure to check them out - and thanks for having us guys!
Another Bitcoin crash is in the books. Crypto’s top coin dropped more than 11% in 3 hours, crashing from the interim $9500 all the way down to $8404 before attempting a limp recovery. It has since mostly been trading sideways, with some pundits warning the worst may be yet to come.
And while there will be many an article written on which TA indicator was most to blame for the correction, here are several on-chain, social and other peculiarities surrounding the recent drop, taken from Santiment’s data:
MVRV paints a grim picture
The MVRV ratio shows the average profit or loss across all holders for a select time frame.
Our time-bound MVRV (accounting only for coins that moved in a certain time band) gives us a good overview of the current ROI for both long and short-term HODLers.In case of BTC, the latest dip has – on average – put short-term Bitcoin buyers (anyone that got their coins in the last year) decidedly under water:

The numbers on the right show how much the Bitcoins that last moved within the given time frames (past day, month, 2 months, 3 months, half a year) are down relative to their acquisition price.
As we can see, various short-term BTC holders are – on average – realizing losses between 9% and 18% on their initial investment following yesterday’s dip.
Long(er)-term HODLers are, on average, still in the green, although the ratios have still taken quite a hit:

All BTC that moved within the last year is – on average – still up 10% on their acquisition price. That number, however, shrinks down to just 2% when looking at coins that moved within the last 2 years, approaching break-even territory.
It will be interesting to keep an eye on the MVRV ratio for different HODLers moving forward – if long-time investors keep inching towards negative ROI, it may signal a long-term shift towards the bear market.
Tether activity suggests rising FUD
Some 24 hours prior to Bitcoin’s dump, there was a notable spike in the cumulative balance of Top 100 Tether wallets. In particular, personal (non-exchange wallets) increased their Tether holdings from 411 million on September 22nd to 558 million at present.
In percentages, smart Tether money went from owning 20% to 28% of Tether’s total supply over the span of 2 and a half days.

Could whales have been bracing for a correction?
Exchange data for Tether also reveals quite a bit about recent holder behavior. Over the past 24 hours, we’ve been seeing record amounts of ERC-20 Tether leaving exchanges.
Discounting for arbitrage, we can presume at least part of this activity to indicate traders liquidating their BTC positions and looking to exit the market into stablecoins.
Here are the daily active Tether withdrawals over the last year on Bitfinex:

And Binance:

And Poloniex:

Seems like some traders are running out of dodge until the market stabilizes. It’s worth noting that tether deposits to exchanges have also been on the rise, although the outflow volumes currently dwarf the inflows.
Speaking of people exiting the market into stablecoins:
DEXes overflow
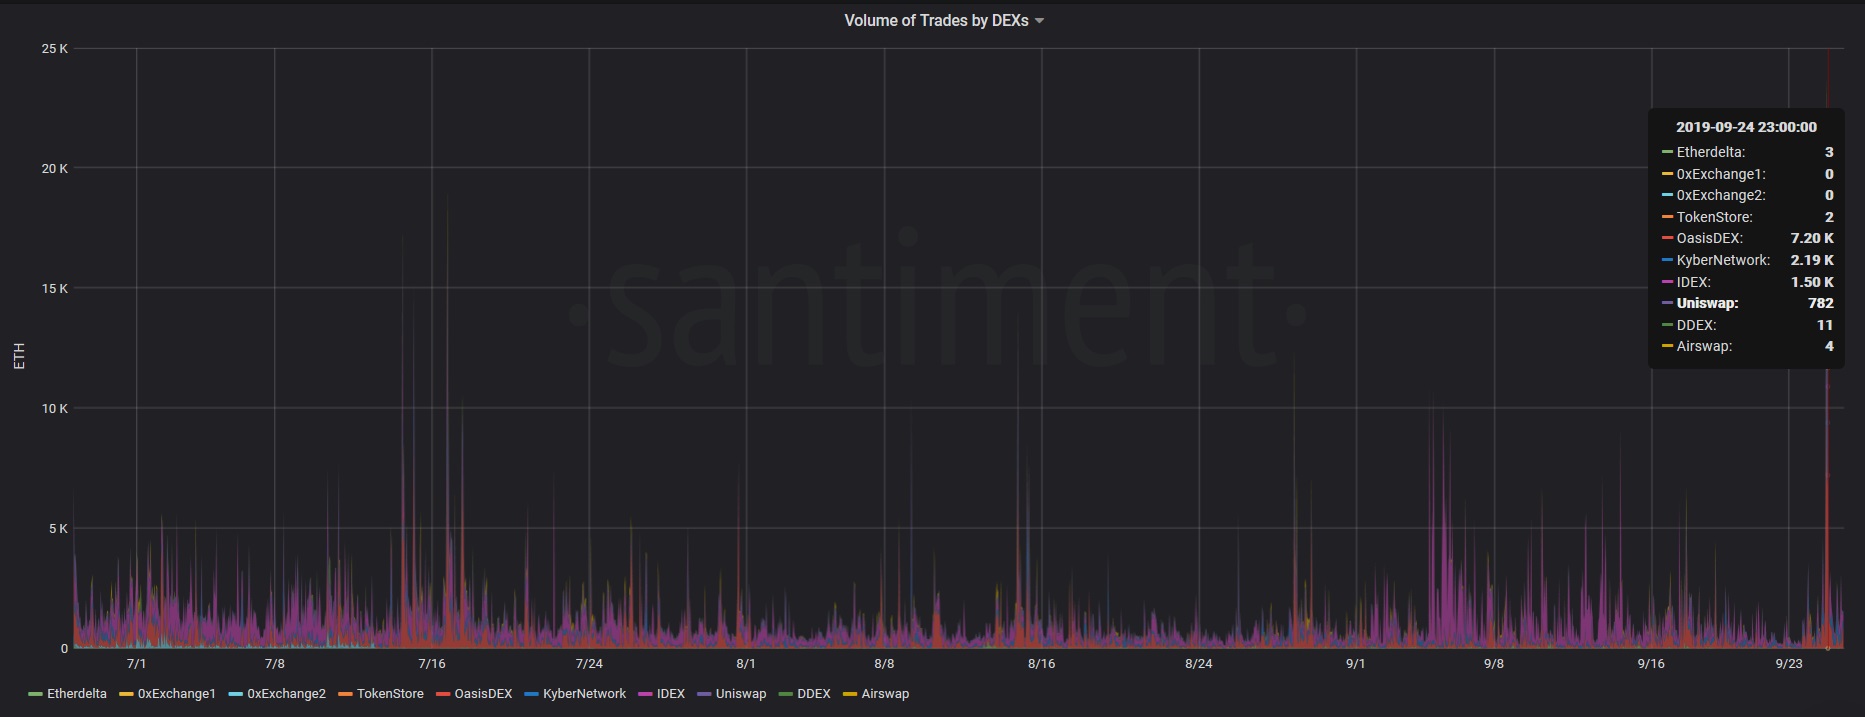
It’s not just the centralized exchanges that saw elevated activity today; top DEXes also experienced their biggest spike in trading volume YTD:

According to Santiment data, the lion’s share of increased volume came from Oasis, Kyber, IDEX and Uniswap, respectively:

As for which coins have been most active on decentralized exchanges, DAI emerges as the clear frontrunner, both in total number as well as volume of trades:


The elevated DAI volumes could signal the same kind of behavior as we’ve seen with Tether above – a lot of folks are escaping from alts into stablecoins for the time being.
It also makes sense that DAI would lead the charge on DEXes – people that prefer DAI’s decentralized nature over Tether are also likely to value the privacy of DEXes over the allure of Bitfinex and Binance. Same behavior – different stakeholders.
So much about decoupling
There’s been a lot of talk about high-cap coins starting to finally break their BTC dependency and charting their own price action. So we asked one of our data scientists to check if there was any truth to that in the midst of the Tuesday dip.
Within top 50 coins by market cap, here are the ones that performed best in 24 hours since the crash:
1. Tether: 0.004598
2. PAX: 0.002192
3. TUSD: 0.002123
4. USDC: 0.001033
5. Unus Sed Leo: – 0.011953
6. INB: -0.017100
7. LINK: -0.039582
8. CRO: -0.060789
9. ZB: -0.078796
10. LSK: -0.079185
11. 0x: -0.081377
12. IOTA: -0.085123
13. DOGE: -0.103963
14. XEM: -0.104530
15. HEDG: -0.113598
16. BTC: -0.113960
Only the stablecoins have stayed in the green following the correction. Funnily enough, Bitcoin itself is the 16th top performer in that time!
Even fan favorites like LINK found it impossible to counter Bitcoin’s pull, dropping over 14% over the first 24 hours:


For now, BTC remains an undisputed proxy for the entire crypto market.
The Crowd’s Tepid Response
As is to be expected, Bitcoin’s PA is the talk of the town today; in the first 24 hours after the drop, our social data recorded 4240 new mentions of ‘BTC’ or ‘Bitcoin’ on crypto social media (telegram, reddit, discord etc).
And while the crowd’s reaction has been resolute, the recent social volume pales in comparison to the amount of talk we’ve seen during Bitcoin’s summer rally:

The dwarfing social volume could be interpreted as the market’s relative indifference to its latest drop. This should then, at least in theory, bode well for BTC’s bounceback chances.
That said, although comparatively small, the recent crowd sentiment has leaned understandably negative, with much of the chatter suggesting things might get worse before they get better.
In fact, we’ve seen crowd sentiment towards BTC swaying from positive to negative for almost 10 days now.
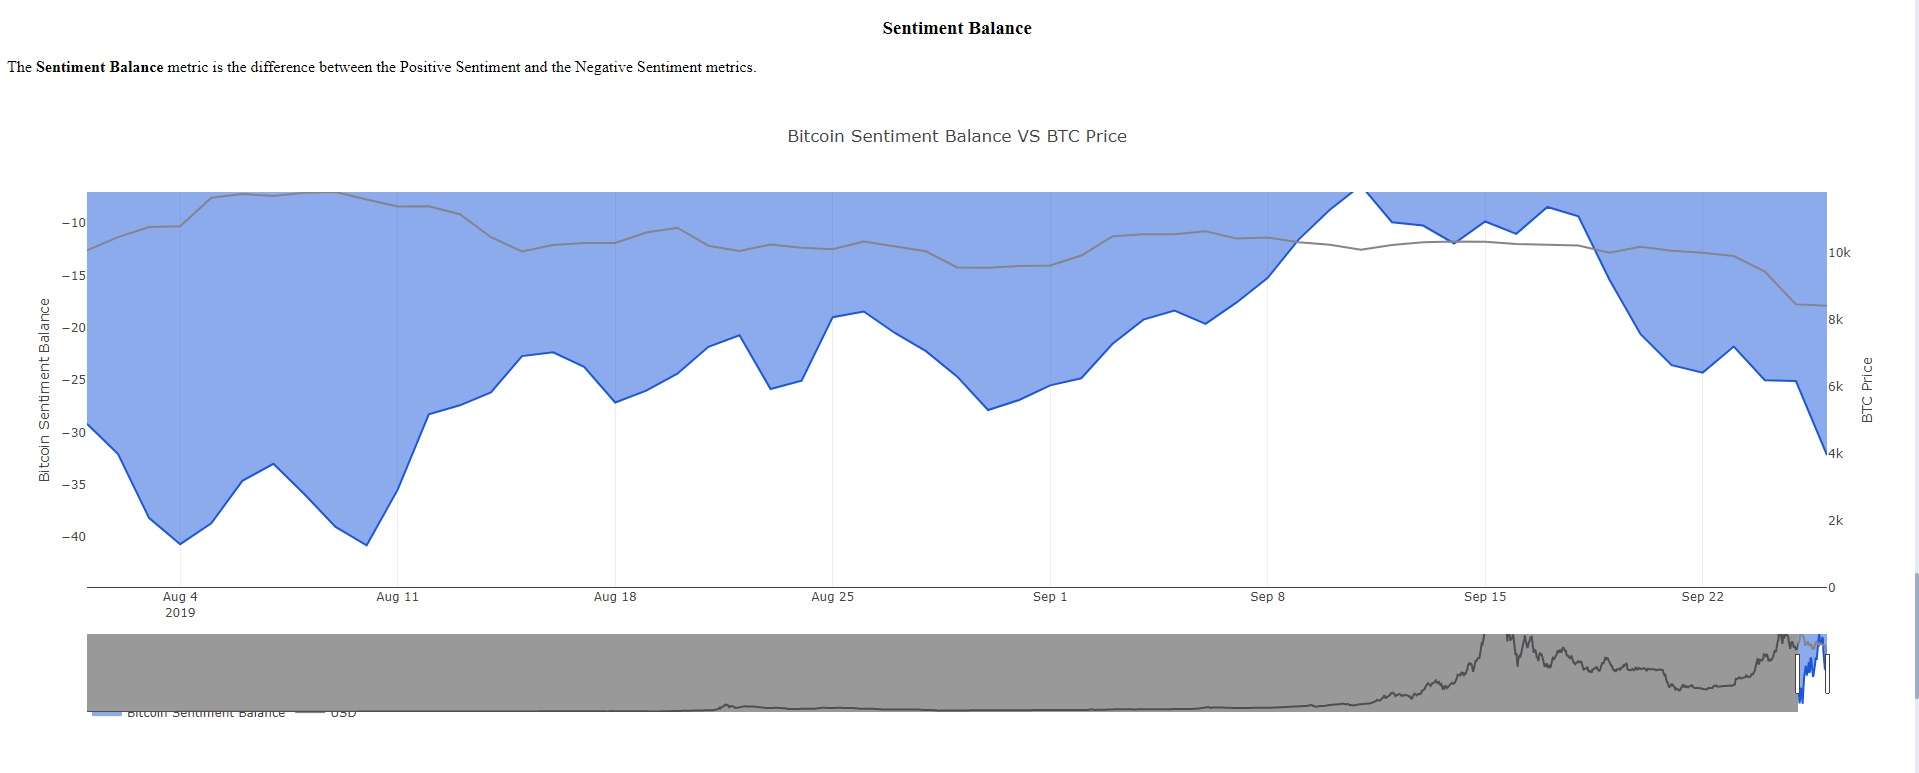
Santiment’s sentiment balance metric calculates the difference between positive and negative sentiment about a coin on different crypto social media (telegram, reddit, twitter, discord etc).
Here’s the sentiment balance for messages containing ‘BTC’ or ‘Bitcoin’ on Telegram over the past month:

You can see a steep drop towards bearish BTC sentiment started way before the drop – almost a full week prior. Sentiment data from crypto subreddits paints a similar picture – although they’ve been more bearish on Bitcoin in general, the pessimism really started to escalate around November 17th-18th, and has only gotten worse since:

Finally, Discord chatter paints perhaps the most visible example of shifting BTC sentiment: from decidedly bullish in early August, the crowd has been progressively losing faith in top coin’s PA since:

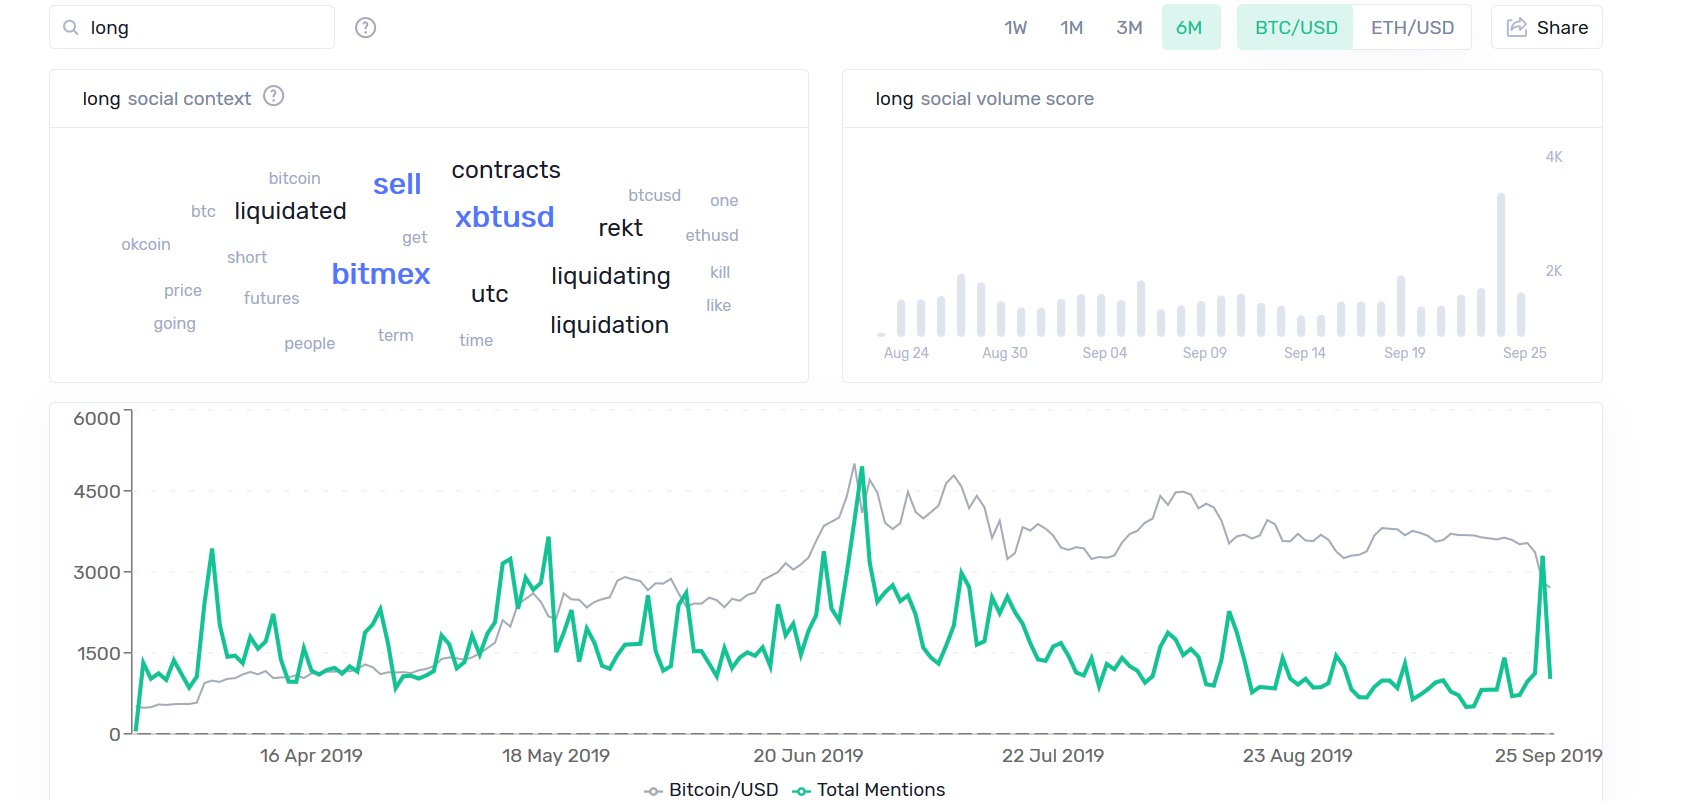
Not everyone’s drinking the desperation Kool Aid, however. Amidst the rising negative sentiment, mentions of ‘long’, ‘bottom’ and ‘bounce’ have also ballooned over the first 24 hours post-crash:


Let’s hope they’re right!
If you want to make sure you’re not missing Bitcoin’s next move, you can set up custom signals on Sanbase for any future anomalies in Bitcoin’s price, on-chain or social action. The volatility’s back with a vengeance – be safe out there!
Thanks for reading!
If you enjoyed this insight please leave a like, join discussion in the comments and share it with your friends!
Never miss a post from Ibis!
Get 'early bird' alerts for new insights from this author

Conversations (0)