Back to earth for OMG after the Coinbase listing?

Quick takeaway:
- After the coin begins trading on Coinbase Pro, a number of OMG's on-chain and social indicators indicate the formation of a local top
- Assets covered: OMG
- Metrics used: Social volume, Emerging trends, Daily active addresses, Exchange inflow, Token age consumed
Death, taxes and exchange listing pumps. Ever since Coinbase announced support for OMG on May 14th, the ERC-20 coin has done nothing but push upward despite market-wide consolidation - gaining over 56.7% in the past 7 days.
Yesterday, the coin officially started trading on Coinbase Pro. But if you’re thinking of joining in the OMG pump, you may want to reconsider - or at least read this first. Because based on OMG’s on-chain and social data over the last 24 hours, the rally could be on its last leg.
Let’s examine the clues:
1. OMG’s social volume peaks

Based on the data we collected from over 1000 crypto social media channels, the amount of mentions of ‘OMG’ and ‘OmiseGo’ hit an 11-month high today, with over 660 OMG-related mentions in the last 24 hours.
The social volume spike propelled OMG to spot #2 on our list of Emerging Trends today, which calculates the biggest developing topics on crypto social media:

In a word - a LOT of people are talking about OMG today. Great for the project! Not so great for the price of their coin.
Why? Extreme spikes in a coin’s social mentions (especially during a pump) often correlate with a short-term correction, as the hype begins to peak and whales begin to dump on the ‘lambo crowd’.
And I’m not just talking from my own experience - we’ve actually backtested the performance of 200 coins that made it all the way to top 3 of our Emerging Trends list. Here’s what happened to their price 2 weeks before and 2 weeks after they appeared on the list:
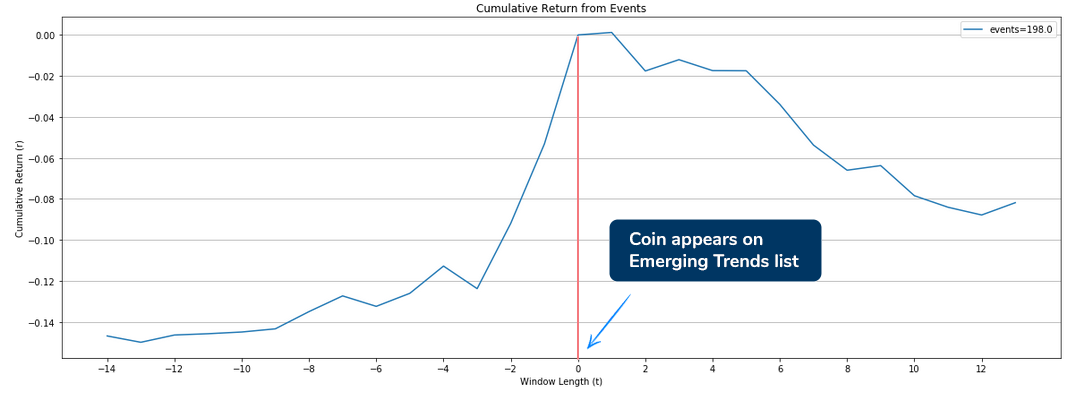
A picture is worth a thousand words, but here’s some words just in case: on average, the coins gained more than 15% in 2 weeks before appearing on the Emerging Trends list. The moment they show up on the list (0 on the chart) - the dump begins.
In the 2 weeks since appearing on the Emerging Trends list, the coins we backtested have, on average, lost a massive 8% of their total price. And this is on a sample of 200 coins.
So...yeah. The hype is real, as in ‘real bad for your price’.
In fact, this exact pattern already happened for OMG - just one week ago. The coin’s mentions mushroomed after the initial Coinbase announcement, correlating with a 26.4% pump in about 24 hours.
As the hype began to die down, the price of OMG quickly started losing steam, dropping by 11.5% within the next day.
I’d keep an eye on OMG’s social volume over the next 24-48 hours. If we see a strong divergence between the coin’s price (trying to push up) and its social mentions (dropping quickly), it could mean the end of the rally.
At the moment, the crowd remains divided on OMG's short-term potential, although it feels to me like bearish voices are slowly starting to take over. Here's a quick breakdown of some of the most popular OMG-related comments posted to r/cryptocurrency and r/ethfinance in the past 10 days:

2. Network activity at a crossroads

In sync with the start of trading on Coinbase Pro, the amount of addresses sending or receiving OMG has skyrocketed yesterday, peaking at 1307.
We’ve seen the same thing happen on May 14th (initial Coinbase announcement), when the amount of addresses interacting with OMG reached a 3-month high 1342.
What happened next is what matters most - the number of addresses declined dramatically in the days after the announcement, which coincided with a short-term correction (-11.5%) and a 5-day consolidation period.
We call this phenomenon ‘Price-DAA divergence’, and it’s often proved to be a reliable top indicator. Essentially, when the amount of on-chain activity starts to decline rapidly as the price tries to push up, the lack of fundamental support (not enough network activity/value transfer) often proves to be an obstacle to a sustainable rally.
We’re now slowly starting to see the same pattern emerge, so I’d keep an eye on OMG’s daily active addresses in the next day or so. If the on-chain activity falls back to pre-announcement levels, it’s unlikely the price will be able to muster another push upward.
3. Speculative activity EXPLODES
Over the last week, a massive amount of OMG has been moving to centralized exchange wallets - its biggest spike since 2017:

Zooming in to the last 3 months, you can see that the spikes in exchange inflow came mostly at two junctions - May 14-15th, and May 19-20th:

Both times, around 2.21 million OMG moved from private addresses to known exchange wallets, for a total of ~$4,500,000. The first exchange inflow spike landed squarely on the interim top - the massive sell pressure proved too much for the OMG bulls to absorb, leading the price to drop by 11.5% in the next 24 hours.
Will the second/current exchange inflow spike have the same effect on the price? It wouldn’t be surprising. In fact, it would be deja vu - just look at OMG’s exchange inflow during the spring-summer rally of 2019 - virtually every top was earmarked by a strong, sudden burst in the amount of OMG entering centralized exchanges:

(One point to keep in mind: if you look at OMG’s Exchange Flow Balance graph, you’ll notice two massive drops on May 14th and May 19th, indicating that even more OMG left exchanges than had entered. This is likely due to the fact that we don’t have Coinbase wallets in our database yet, so what’s registered as an ‘outflow’ could very well be movement of OMG from one exchange (say, Binance) to Coinbase.)
Another, likely correlated red flag are the two simultaneous spikes in OMG’s token age consumed, indicating that - on both dates - a large amount of previously dormant coins have started moving once again:

This implies that patient HODLers (‘strong hands’) and long-term investors may also be looking to cash in on the pump, which is often a sign of incoming volatility for the coin. As you can see, the May 14th spike in Token Age Consumed correlated 1:1 with OMG’s local top and a subsequent 11.5% correction.
In conclusion - there’s trouble in the air, and also in a number of OMG’s on-chain and social metrics. Some very common top indicators - like the coin’s social volume, exchange inflow and token age consumed have all been experiencing extreme values over the past 36 hours, much like the pattern we’ve seen on May 14th, before the price of OMG dropped by more than 11.5%.
Should the amount of addresses interacting with OMG continues to dwindle over the next few days, it could prove to be an impossible obstacle for everyone hoping for another leg up.
Thanks for reading!
If you enjoyed this insight please leave a like, join discussion in the comments and share it with your friends!
Never miss a post from Ibis!
Get 'early bird' alerts for new insights from this author

Conversations (0)