Why Chainlink HAD to dump yesterday night

It’s the moment that all of LINK army has been waiting for. After successfully breaching its previous all-time high on July 6th, Chainlink’s native token remains on an (almost) unstoppable bender, entering price discovery with a bang and gaining +62.8% in the past 8 days and +11% in the past 24 hours.
The latest rally has already been attributed to a number of possible catalysts including a string of recent high-profile partnership, market-wide proliferation of DeFi protocols and surging LINK trading volumes as of late.
I won’t spend much time on any of those here. Instead, I want to zero in on another, arguably more interesting part of Chainlink’s latest uptrend - a 10% price correction manifesting yesterday afternoon, easily dismissed by some and already forgotten by others:

And while the dump has proved to be short-lived (LINK is already up by 11% for the day), a look at LINK’s recent on-chain and social data suggests that it was also pretty much inevitable.
Here’s my laundry list of bearish indicators warning that LINK was about to pump the brakes:
1. LINK social volume reveals ‘peak hype’
According to the data we collected from over 1000 crypto social channels, the amount of ‘LINK’ and ‘Chainlink’ mentions surged to a one-year high on July 13th, with over 450 new mentions recorded by our system in a span of 24 hours:

The surge in social mentions also landed Chainlink on the very top of our list of Emerging Trends on crypto social media yesterday, indicating that all eyes were indeed on LINK’s journey through price discovery.
This was a MAJOR red flag. If you’re an avid reader of our insights you know that extreme social volumes can be an incredibly reliable top indicator. In one of our recent studies, we’ve backtested 200 instances when a coin’s name/ticker claimed the top of our list of Emerging Trends, and the coins’ price in the two weeks before and after:

“Within the next 12 days after a coin claims a top 3 position on our list of Emerging Trends, its price drops by an average of 8.2 percent”
Furthermore, LINK’s own history suggests a strong, long-lasting correlation between the coin’s social volume and its local price tops:

I was SO sure that LINK’s social volume was overinflated that I even gave a quote about it to Coindesk yesterday, (accurately) predicting an incoming correction. When you see the exact same pattern develop 100 times, you’re pretty confident about the 101st.
And it’s not just the amount of mentions either: according to our sentiment algorithm, LINK-related sentiment on crypto social media was extremely bullish yesterday, actually hitting its all-time high on the Telegram channels that we track:
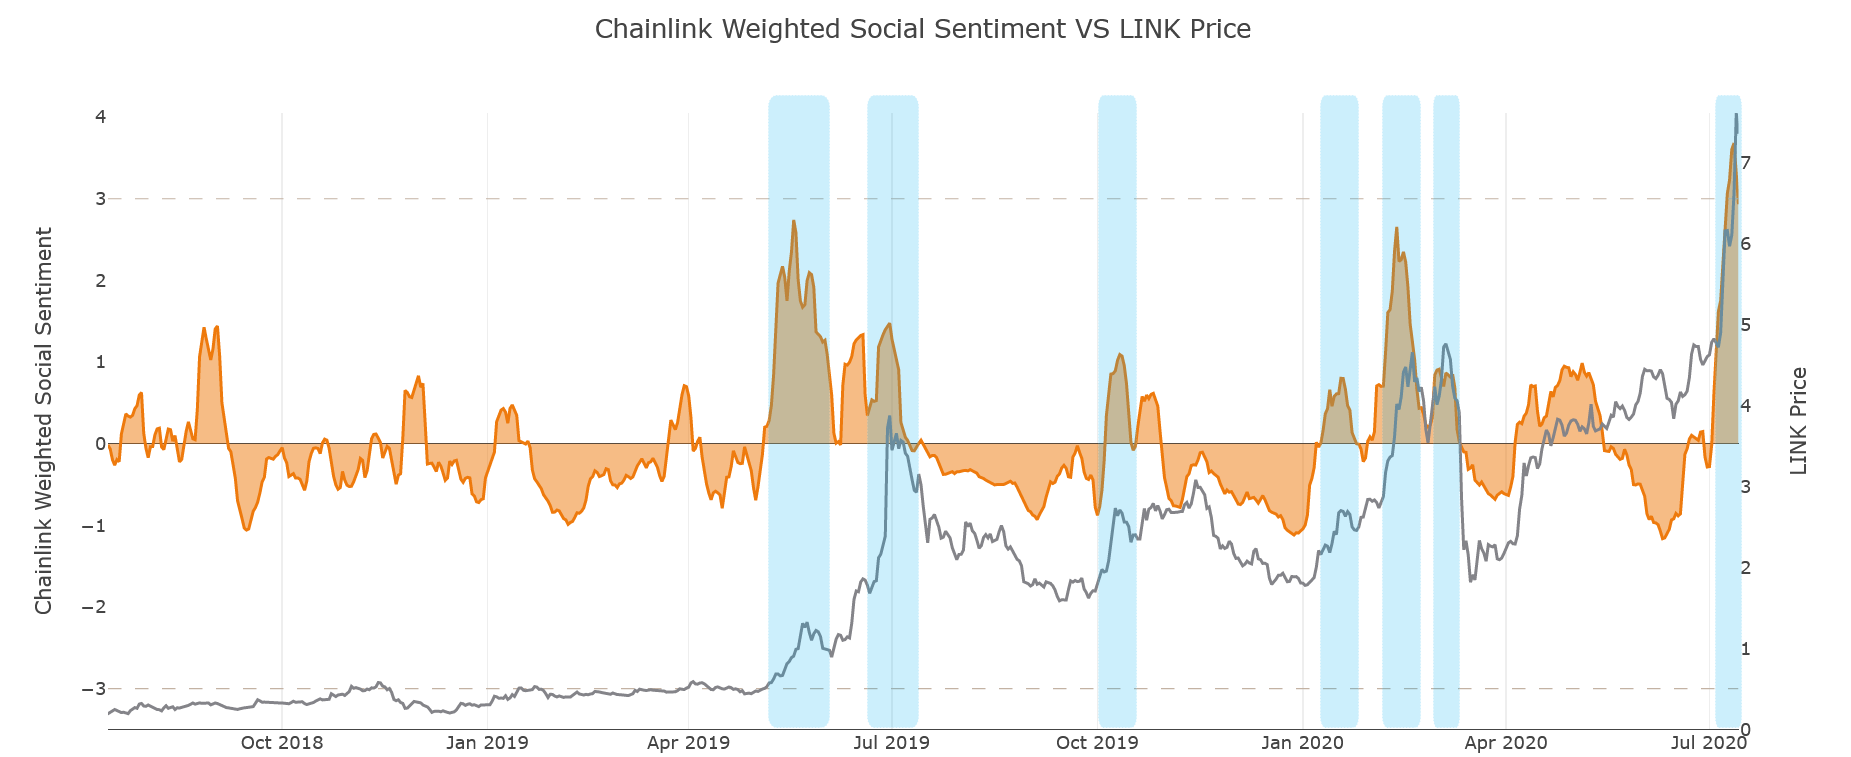
For most assets, extremely bullish sentiment indicates that the crowd has become irrationally confident about the coin’s short-term potential. Unsurprisingly, this also tends to be the time when FOMO kicks in and whales start to offload their bags on ‘dumb money’.
In fact, you’ll notice on the chart above that many of LINK’s previous tops and consolidation cycles coincided with massive spikes in bullish sentiment, proving once again that ‘betting against the crowd’ can be a pretty lucrative strategy.
2. Massive sell pressure catches LINK bulls off guard
At around the same time as the crowd hit ‘peak hype’, LINK’s on-chain data reveals a strong rise in the coin’s exchange-related activity.
In fact, July 13th is now the second highest day in terms of active LINK ‘deposit addresses’ (1,199), used to transfer LINK to centralized exchanges:
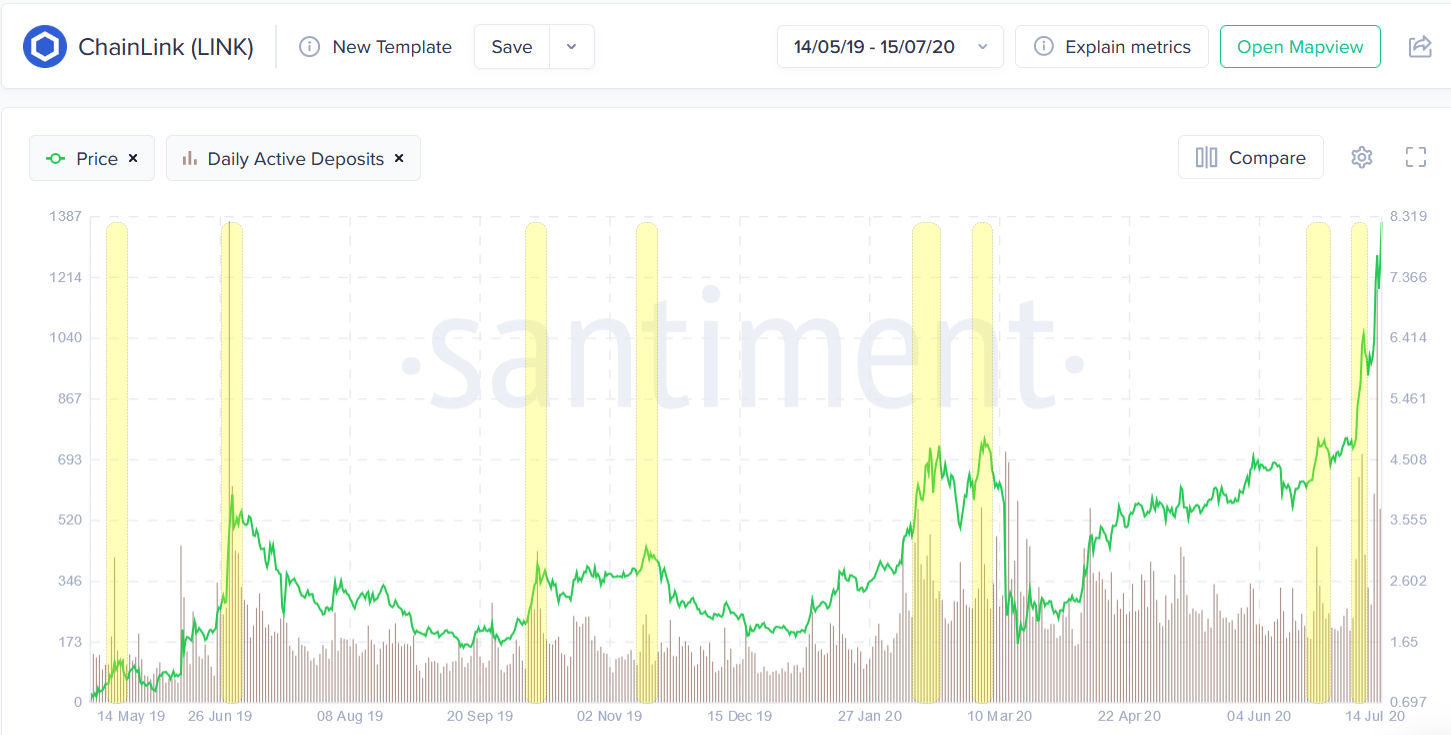
Similarly, the amount of transactions involving deposit addresses actually spiked to an all-time high of 3127 yesterday, indicating a very distributed effort by LINK holders to move their bags to exchanges:

Unsurprisingly, spikes in active deposits (especially during a pump) and deposit transactions often coincide with local tops for Chainlink in the past, as the sell pressure mounts and LINK bulls find it increasingly difficult to absorb it all.
In terms of concrete numbers, over 7,670,000 LINK (~$61,200,000 at the time) were moved to known exchange wallets yesterday, marking one of the biggest single-day inflows to exchanges since 2018:

With the help of our new Top Transactions dashboard on Sanbase, we can easily track exactly where much of this sell pressure came from. By selecting the last 3 days of the biggest LINK transactions, you instantly see a number of major transfers from private addresses to exchanges on July 13th:

Following these transactions gives us a better idea of who’s dumping on the market. For example, this address sent a total of 1,500,000 (~$10,800,000 at the time) LINK to Binance:

By withdrawing it from a Nexo wallet first:

Also, this address sent a total of 400,000 LINK to Binance in the past 2 days, and its previous activity reveals a very interesting transaction history. The funds originated from this address, which moved the coins to the above address a month ago (but didn’t send them to Binance until 2 days ago).
If we then plug this address into our historical balance tool, we can see that this person has a pretty darn good track record at selling LINK around tops:

Most of the previous times the address dumped some of its LINK came around local price tops and major corrections. As you can see, the address moved the remainder of its LINK about a month ago to an interim address, but didn’t send them to Binance until the evening of July 12th.
In other words, part of the recent sell pressure can be attributed to various short-term whale selloffs, further validated by the recent drop in the number of addresses holding more than 10,000 LINK:
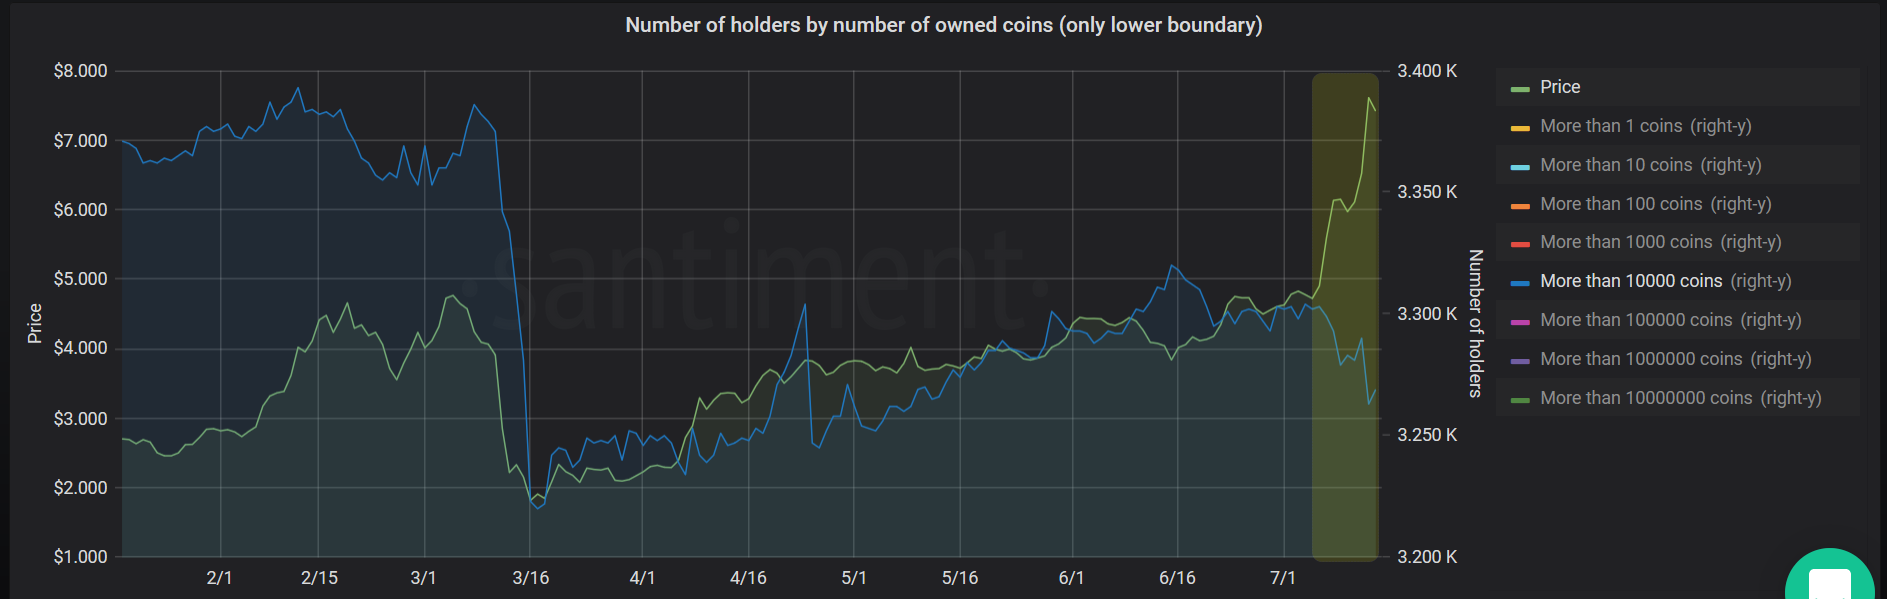
Like I said above, when the crowd gets too bullish, the whales smell blood.
3. New LINK holders get jittery
Finally, LINK’s 30-day MVRV ratio - which tracks the average profit/loss of addresses that acquired LINK in the last 30 days - was dangerously high yesterday, exerting further downward pressure on the coin’s price.
LINK’s 30-day MVRV ratio peaked at 1.39 yesterday, meaning that short-term LINK holders were - on average - 39% in profit on their initial investment.
As a rule of thumb, the higher the MVRV ratio, the more likely it is that holders will start to exit their positions and take profit. As a result, analyzing MVRV levels around previous price tops can reveal the ballpark profit margins at which LINK’s short-term holders were comfortable selling in the past:

First off, you’ll notice that the MVRV peaks in early 2019 were fairly higher than the more recent ones. This is normal for most coins - as the crypto market matures, short-term holders become more and more conservative with their profit taking, so MVRV peaks naturally flatten out over time.
In the past year, however, LINK’s 30-day MVRV most often peaked between 1.26 and 1.42 near its local price tops, indicating that short-term holders were typically 26-42% in profit before LINK’s corrections started.
Of course, we also need to put the current market action into context - LINK has just broken its previous all time high, so it might well prove that its short-term holders would be content with sitting on their bags for longer than usual because of price discovery. However, we’ve already seen the MVRV peak again at a familiar 1.34 level in June 8th (two days into price discovery), before another short-lived price correction, supporting the idea that the sensibilities of short-term holders haven’t changed much.
That’s why yesterday’s 1.39 MVRV ratio was particularly concerning - it had already shot past the 1.34 level recorded before the July 8th correction, and was veering into historical extremes. Unsurprisingly, the coin experienced a swift 10% downtrend, with its 30-day MVRV falling back to a relatively timid 1.24.
4. PLUS : Keep an eye on this metric going forward!
Now don’t get me wrong - none of this is to say that LINK’s rally is over or that the coin can’t break new highs. But the signs were there (and crystal clear) that everyone including the LINK crowd, whales, speculators and holders were all priming the coin for a short-term correction.
What comes next, you may ask? Well, LINK’s current on-chain activity is at an all-time high, with over 14,800 active addresses recorded in the past 24 hours:

This points to strong fundamental support for a prolonged rally into price discovery - but keep an eye on this metric in the coming days. What we don’t want to see is a growing divergence between LINK’s price (continuing to push upward) and its on-chain activity (retracing back to its pre-pump levels).
A major decline in LINK’s network activity in the next few days (especially if paired with growing sell pressure) could threaten its future price momentum, like we saw happen during its June 2019 top:

Conversations (0)