What is LINK's near-term potential? (on-chain analysis)

Quick takeaways:
- A number of LINK’s social and on-chain metrics give a cautiously optimistic outlook about the coin’s near term price potential - but there's a catch
- Assets covered: LINK
- Metrics used: Social volume, Crowd sentiment, Daily addresses, Daily deposits, Exchange inflow, 365-day dormant circulation, Mean coin age, 365-day MVRV, Holder distribution
It’s been a choppy bit of price action for Chainlink’s native token (LINK), which see-sawed through the past 30 days on its way above $10, and currently sits at -8% for the day.
The LINK token has bottomed out at $7.5 during a market-wide crash on September 23rd before bouncing back on a dime. After charting a higher low on October 8th, it is now once again trading above $11 for the first time in nearly a month:

Throughout these ebbs
There’s more of this Insight
Choose your subscription plan
Years of market experience, compressed in each report
Since 2017, Santiment has been an industry leader in on-chain data, social intelligence and behavior-based analysis of the crypto market.
Our tools have a proven track record of timing price tops for cryptocurrencies, helping traders find profitable exit points and mitigate HODLing risk.
Our previous TOP calls:
What you get with Sanbase Pro:
- Members-only daily market insights and analysis
- 30+ on-chain, social & project indicators for 900 cryptocurrencies
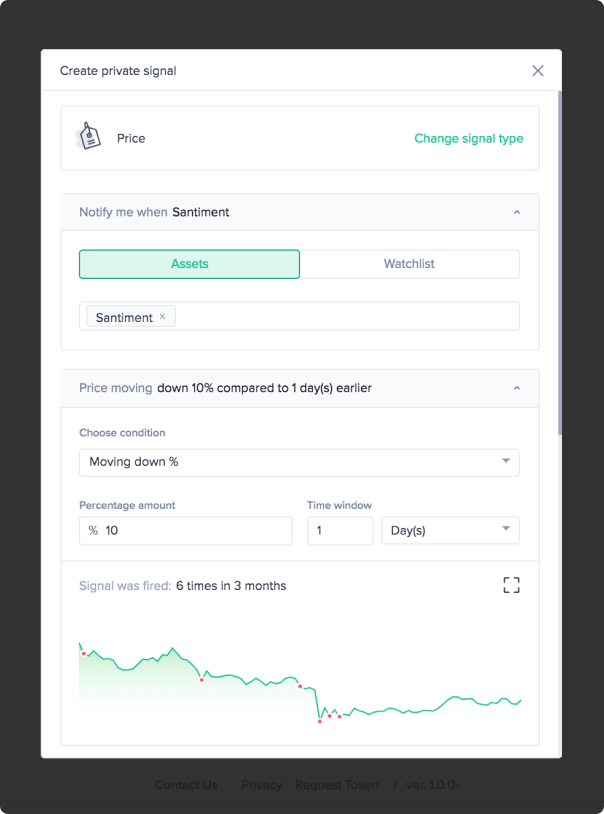
- Custom alerts for the coins' price, on-chain & social trends
- Santiment Spreadsheet plugin with 10+ pre-made market templates
- Personalized asset watchlists and weekly performance reports
Gain unfair advantage with Sanbase Pro
Subscribe to Sanbase Pro for access to exclusive insights, market-beating metrics, strategies and templates!