
The State of Ethereum Post-Correction: What You Need to Know

Over the last 7 days, the world’s second largest cryptocurrency has lost over 43.3% of its market cap and is (at the time of writing) hovering at a 13-month low $115.
The coronavirus epidemic continues to send shockwaves through the financial world - old and new alike. As correlation between Bitcoin and S&P reaches near all-time high, many are starting to question crypto’s reputation as a ‘safe haven’ in periods of economic downturn.
In short - it hasn’t been a great week for digital assets.
Still - just how ‘not great’ has it been really? While current market chatter is dominated by equal parts FUD and FOMO, most of it has been anything but data-driven.
So instead of yet another ‘opinion piece’ on the latest market correction, let’s look at the available data on Ethereum and its many stakeholders, and how they’ve all been reacting to recent market volatility.
Using Santiment’s on-chain, social media and development activity data, we’ll look at the recent behavior of the following agents:
- Ethereum network users
- Social media/crowd sentiment
- Ethereum holders (retail + whales)
- Ethereum speculators
- Ethereum miners
- Ethereum and ERC-20 developers
Let’s jump right in:
Ethereum Network Users
It’s not just Ethereum’s price: the Thursday drop was a monumental event on-chain as well.
In terms of value transfer, a total of 13.1m ETH ($406.3m) was transferred between network addresses on March 12th - the largest daily transaction volume since December 2018:

The market correction has also mobilized a number of long-term ETH holders into action, as evident by the biggest Token Age Consumed spike in the last 12 months, indicating that a significant amount of previously dormant ETH coins have moved to new addresses:

This behavior is further supported by an uptick in the percentage of active ETH coins over the last 3 months, which spiked by 12% since the plunge. Zooming out a bit, the share of active ETH In the last 12 months has also increased in the past week, albeit by a more modest 2.5%:


Perhaps unsurprisingly, the above on-chain indicators do suggest some increased anxiety and tension among network participants in reaction to heightened market volatility.
That said, it’s worth noting that we’re still not witnessing any major dropoffs in network-wide activity. The amount of daily addresses interacting with Ethereum has remained stable to start the week, as has the amount of new addresses being added to the network despite the correction:


Interestingly enough, this is also the reason why we’re seeing a number of on-chain indicators like NVT turning bullish since the drop, as the network activity remains normal despite the market downturn.
That said, I’d take these models with a massive grain of salt for the time being, as most of them are trained to spot organic divergences between an asset’s market and on-chain activity. The current market situation, on the other hand, is anything but.
Social media/crowd sentiment
Based on our data collected from 1000+ crypto social media channels, the Thursday drop has prompted a year-high in ETH-related chatter within the community.
Between March 12th and March 14th, Sanbase has recorded more than 12800 new mentions of ‘Ethereum’ on crypto social media, as the cryptoverse was trying to make sense of the changing market conditions:

As for the crowd’s mood, our custom sentiment algorithm suggests a strong and increasingly negative attitude towards Ethereum, slightly varying between social channels.
In fact, we’re currently seeing the lowest ETH-related sentiment on Telegram, Discord and Reddit since ETH last dropped below $400 back in July 2018.


Interestingly enough, out of all the major crypto social channels, Twitter seems to be the least ‘dramatic’ in its response to the latest Ethereum correction. Though its general sentiment has also veered into negative over the past few days, its ‘anger level’ remains pretty normal compared to its previous market reactions:

ETH Holders (and whales)
Pandemic or not, crypto is still a whale’s playground. So what have Ethereum’s biggest holders been doing in response to the latest drop?
Let’s start by looking at the biggest non-exchange addresses currently holding ETH. On March 12th, these whales offloaded/moved ~300,000 ETH from their wallet, right into the plunge.
While the drop was notable it’s far from monumental, and is in fact very much in line with the general balance fluctuations among Ethereum’s largest investors. Since Thursday, these addresses have actually turned to accumulating once again, adding some 150,000 ETH over the past 5 days:

We’re seeing this same ‘zig-zag’ pattern among many of Ethereum’s ‘whale cohorts’, potentially indicative of investor indecisiveness. For instance, addresses holding between 1000 and 10000 ETH have also furst dumped into the rally - then bought/added some more ETH at the interim bottom, then dumped once again:

Alternately, addresses holding between 10k and 100k ETH have dumped about 500,000 ETH into the drop, but have already gained most of it back to start the week:

And finally, a similar pattern is observed in addresses holding 100k-1m ETH - dump into the rally, buy some back at the interim bottom, then dump some more.

And while Ethereum’s large-scale investors seem to be undecided about the coin’s short-term potential, its retail sector is anything but. Despite the dip, we’re seeing an uninterrupted accumulation phase for addresses holding between 0.1 and 1ETH:

...addresses holding between 1 and 10 ETH:

...as well as addresses holding between 10 and 100 ETH:

However, despite Joe Retail’s eternal optimism, the fact of the matter is that many ETH investors - both small and large - have exited the market over the past 7 days.
Which brings us to:
ETH Speculators
As expected, we have seen a massive influx of ETH to exchanges as the correction was developing, with about 2.297m ETH transferred to known exchange wallets on March 12th:
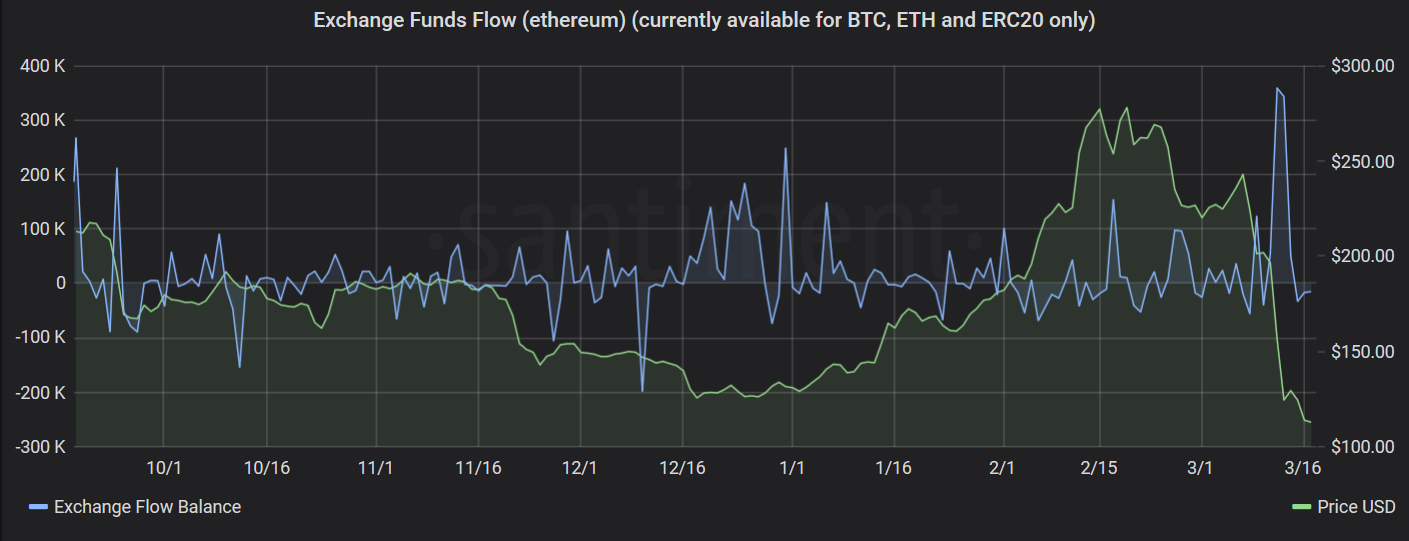
As a result, we’re now sitting at a 10-month high in the percent of ETH’s circulating supply on exchanges - currently at 10.49% or 11.5M ETH:

Analyzing Ethereum’s biggest transactions on Sandata reveals a number of positively massive whale dumps during and after the drop.
The most notable is this transfer of 121,495 ETH (~$14,200,000) to Bitfinex, from just over a day ago.
By looking at the sender’s historical balance in Sanbase, we can see this person got into ETH (also purchased from Bitfinex) on April 28th, 2019, when Ethereum was $155, and has now ended up selling way below that mark.

Other notable transactions include:
-This transfer of $12m from a Nexo wallet to an interim address to Kraken , occuring on March 12th
-This transfer of $10.5m to Bitfinex on March 13th, coming from a long-time ETH holder which originally bought his bag on January 4th 2019, when ETH was hovering around $150.

-This transfer of $5.5m to Bitfinex, coming from another mid-term holder (held for 442 days):

And the list goes on. Most of these people are currently selling at a loss, which isn’t too surprising if we look at Ethereum’s current MVRV levels. The MVRV ratio measures the average profit or loss of Ethereum coins that have moved in a particular time range.
At the moment, all MVRV cohorts - short, mid and long-term holders - are (on average) down on their initial investment. At the time of writing, the negative ROI is particularly high among long-term holders, with the 3y MVRV ratio currently sitting at a heartbreaking -54.4%.

Short-term holders are close behind though, with those addresses that received ETH in the last 90 days currently (on average) -32% on their initial investment, and those that received ETH in the last week currently (on average) -10.4% on their initial investment:
ETH miners
I also wanted to give a brief shoutout to ETH miners: although some in the Ethereum mining pools have actually been dumping their bags into the February rally, the cumulative balance of all Ethereum mining pools has been on the rise since the correction.
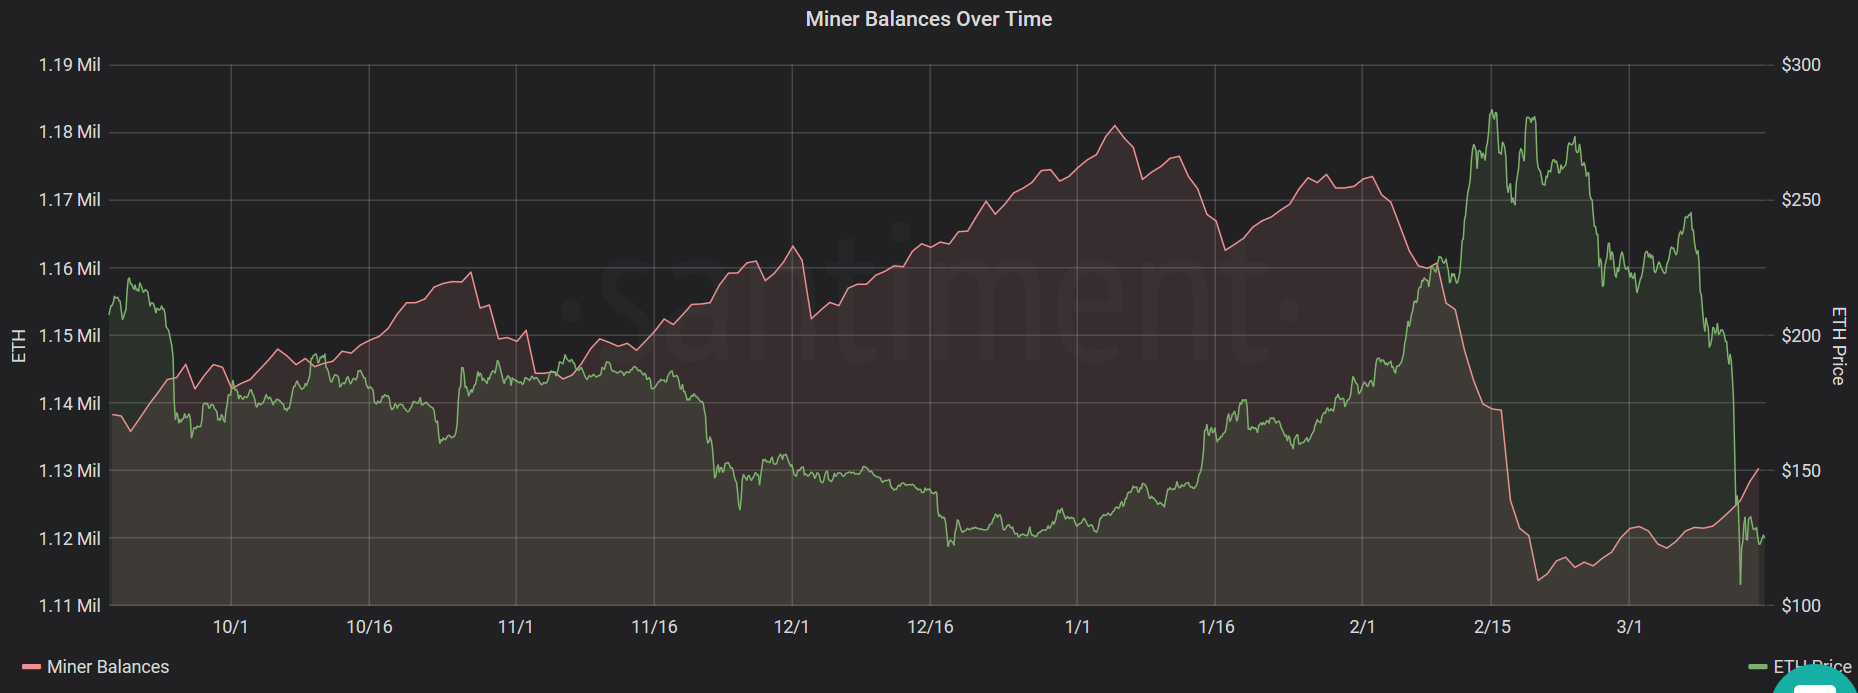
In other words, Ethereum miners have yet to move any of their holdings despite the Thursday drop, and have in fact started accumulating ETH again:
Developers
Finally, it’s very much worth taking a look at how Ethereum and ERC-20 developers have reacted to these volatile market conditions. At Santiment, we track the (Github) development activity of more than 900 crypto-related projects, so we can visualize the amount of coding manpower invested in Ethereum as well as Ethereum-based dapps over time.
Here’s a look at Ethereum Core developers’ github activity over the last month:

Notice the massive dropoff in developer activity since the correction? Exactly - there isn’t one. In fact, seems like work on Ethereum has actually ramped up a bit over the last 7 days, with a respectful amount of activity even recorded over the weekend (which usually stays flat).
On the other hand, here’s a look at the collective development activity of all ERC-20 dapps in the last year:

Again, we’re seeing no signs of heightened inactivity or developer ‘capitulation’ since the price drop. Most ERC-20 projects (including Santiment) continue to polish and update their platforms, once again proving their general indifference to market-wide conditions.