
Santiment Monthly Report: Markets Rock After War News Breaks... What’s Next?

Russia-Ukraine War Suddenly Shifts Markets and Polarizes Traders
Early February up until now has been filled with dramatic twists and turns. It's hard to believe that 4 weeks ago, inflation and the Fed's rate hike decisions were the topic of conversation among crypto circles.
Now, with a bit over a week passing since Russia announcing war on Ukraine, Bitcoin prices have calmed down to the low $40k levels.
Here are a few summary points before we dive into our monthly recap on the crypto markets, according to Santiment metrics:
- February saw a noticeable shift between inflation and Fed news, followed by war news that completely overshadowed the earlier concerns of economy health
- On February 23rd (or 24th, depending on world location), news dropped of the war between the two nations, causing an immediate market-wide price drop. Bitcoin had a notable drop of -11% over a 16-hour time period, while the majority of altcoins plummeted -20% or more.
- Following the fear and panic that set in from both the war news and subsequent price drops, sentiment became negative just as prices began to rise. Bitcoin surged rapidly, gaining +27% over the following six days after bottoming out on the initial news report of the war.
- Bitcoin whale addresses have dropped 21.3k more BTC in the past 2 weeks, with their biggest drop (and bottom out) occurring on February 23rd. This indicates that they are very much sensitive to the fluctuating war news.
- Unlike Bitcoin, Ethereum whale addresses holding between 10,000 and 1M ETH (typically the highest level of regularly active traders) have stayed relatively stable over the past two weeks
Real world news had a particularly profound impact on the state of cryptocurrency markets in February and early March
Social volume on cryptocurrency discussion platforms noticeably had an interest shift once war news broke. Seen below in red, inflation and Fed interest were playing a major role in foreshadowing local tops forming in Bitcoin’s price:
This all changed when the Russia-Ukraine war became official in the last week of February. As illustrated in blue, social volume toward war-related keywords became the dominant subject and point of interest, as one would expect with a crisis of this magnitude.
The initial expectation was for the war to have a negative impact on cryptocurrency prices, which it did for a short period of time. However, as fear set in (which we will get to next), prices quickly ramped up. It’s still a bit premature to state whether this world event is a net positive for the crypto sector.
But the short sample size of days thus far has indicated there are reasons to believe that crisis can have a positive effect on BTC and alts, just like we saw in March, 2020 with the mainstream covid consciousness.
Sentiment Turned Fearful After Russia-Ukraine News Broke, But Eased After Prices Rose
We can often look at sentiment to figure out what the trading crowd expects to happen next, with the expectation that the opposite is most likely to come true. Over the past month, the crowd sentiment as a leading indicator was extremely effective.
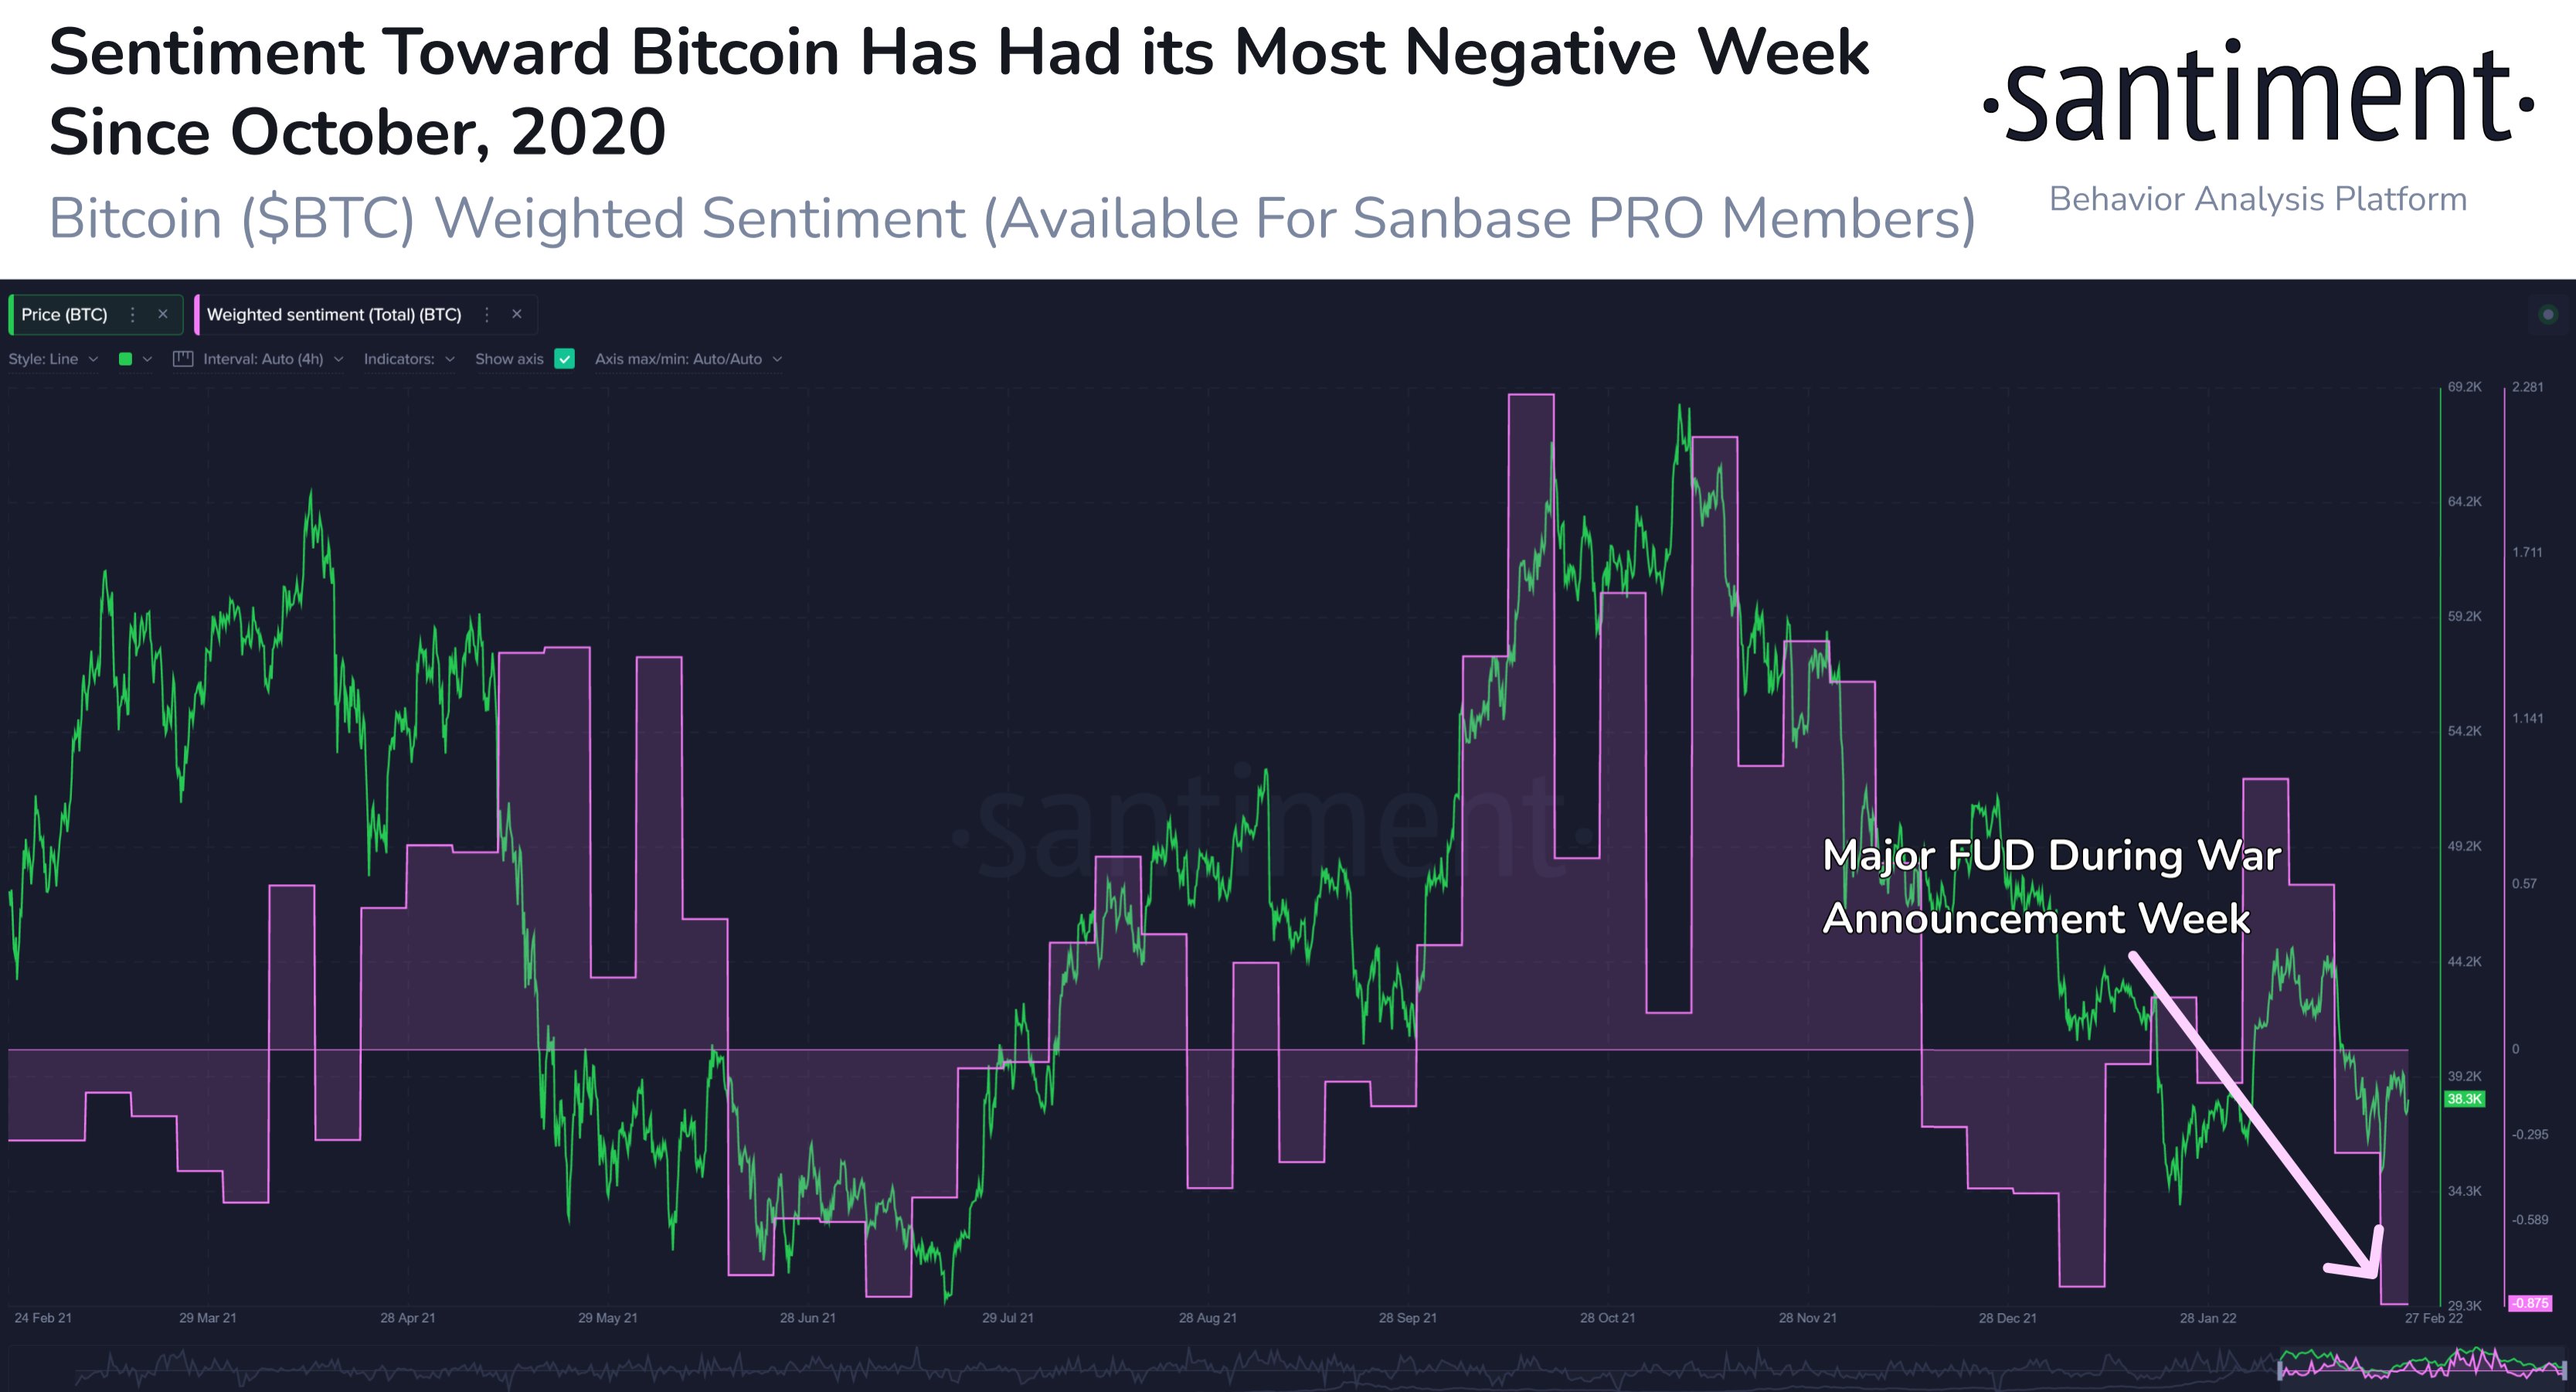
On the tail end of Fed and inflation discussions beginning in early February, a sharp rise in crypto prices began. Markets began to peak with euphoric levels of enthusiasm in the middle of the month as Bitcoin rose to just under $45k before a steep correction.
Then, as war broke in late February, the crowd became quite fearful, and prices dropped. Confident that they had made the right decision to be bearish as a result of the war, FUD began to rise even more as prices showed a quick recovery and many speculating that it was nothing more than a “dead cat bounce”.
Now, traders have fully switched back to mildly bullish toward Bitcoin. It’s important to mention that with crypto very much related to the news on the European crisis, however, prices should continue to fluctuate based on continued developments in the real world. Much more so than typical.
30-Day Price Returns All Over the Map, With LUNA Coming Out Ahead Amongst Top Cap Assets
The case for being a Bitcoin maximalist was very much on display over the overall past month of volatility. Yes, there were many projects such as LUNA, XRP, and SHIB (among many others) that came out ahead of BTC in terms of percentage market cap gained.
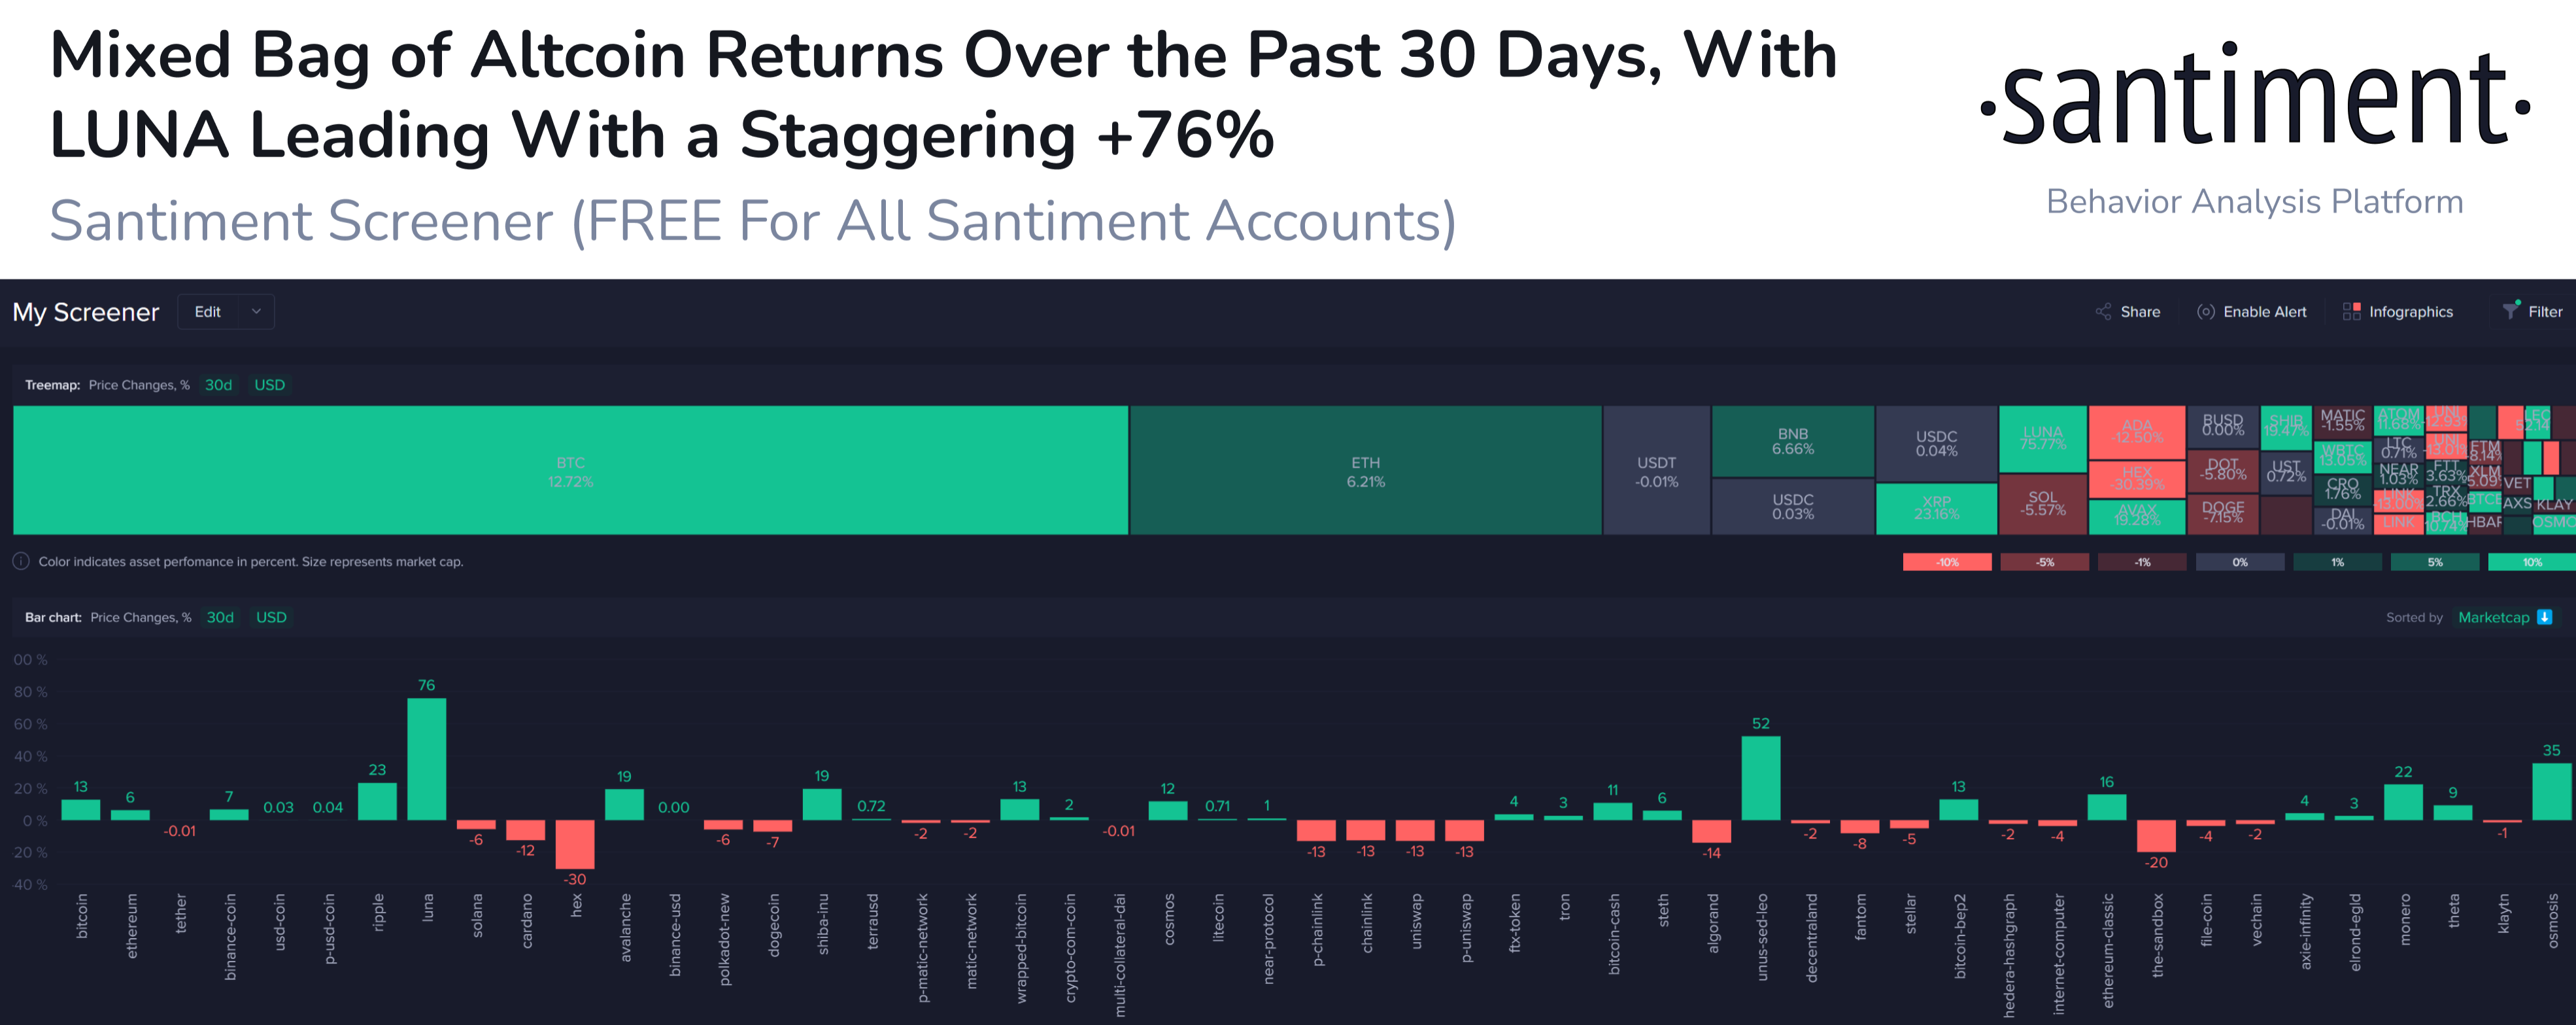
But Bitcoin’s ability to not have relatively volatile slides compared to virtually all other counterparts, as well as actually leading the recovery charge for portions of the past month, is why Bitcoin hodlers sat pretty.
High-End Tether Buying Power Increased
Bitcoin isn’t the only asset that signals how the entirety of the markets may behave next. Santiment has increasingly been paying attention to stablecoins like USDT, and how large addresses are accumulating or dumping their amount held.

We can see that there has been a steady rise in the proportion of USDT’s supply that is held by addresses with 10,000 to 1,000,000 USDT. We typically maximize at 1,000,000, because beyond this threshold is where many exchange addresses are located, which is less helpful. Regardless, based on what we see, there is clear evidence that sharks and whales have significantly more USDT ready to purchase cryptocurrencies compared to a month ago.
Bitcoin Whales Appear to Be in a Slight Decline/ Holding Pattern for Now
Bitcoin whales aren’t looking quite as interested as large stablecoin addresses for the time being. After hitting a one-month low in supply held on the day of the war announcement, they accumulated just slightly and have stayed flat with their cumulative holdings since.

Any sign of this group of addresses showing notable accumulation would be a great sign that FUD is dissipating from the key group of stakeholders that can start or stop a bull run at a moment’s notice.
NVT remains in bullish territory with an increase of token circulation as a positive byproduct of the panic
The Santiment NVT model measures the amount of unique BTC circulating on the network, then calculates whether that output is above, on par, or below the expected amount of circulation to justify Bitcoin’s current market cap.

For now, the amount of unique BTC circulating on its respective network looks quite promising. Since October, 2021, this model has flashed a semi-bullish sign, indicating that the amount of utility Bitcoin is seeing is justifying that its market cap would normalize at a slightly higher level than it’s currently sitting. March is just getting started, but it’s off to a good start with a bullish signal on a very small sample size of days recorded.
Bitcoin Continues Moving Off Exchanges, and Into Cold Wallets
Bitcoin’s cumulative supply sitting on exchanges has continued its encouraging slide downwards, reaching all the way to 10.76%. This is the lowest ratio of BTC supply on exchanges since November, 2018. Generally, this continued decline implies a decreased risk of future selloffs.

Meanwhile, the supply of Tether on exchanges is decreasing, which is less encouraging to see. More USDT on exchanges generally implies upcoming plans of crypto purchases, though it can occasionally be for the purposes of transferring to fiat and cashing out. But for now, we will be more encouraged by a rise in this metric, especially while it’s matching the USDT accumulation of large addresses.
Network Realized Profit/Loss
Another interesting development has been Bitcoin’s Network Realized Profit/Loss. When the war news broke and prices plummeted, this metric dropped to its lowest level since late January. Typically, these large negative spikes are indicative of price bottoms forming. This is due to the fact that the network is trading at a loss at the time, and usually requires a price rise to neutralize and balance things out.

After the rise in price after the initial FUD from the first day of news, BTC’s Network Realized Profit/Loss very rapidly shifted to the most positive it has been since late January. With the network trading highly in profit once it nearly scraped $45k, a local top formed, and prices have dropped back down mildly at the time of this writing.
Keeping Up With Real-World Events is Particularly Relevant for Crypto at This Time
It goes without saying that major events like Fed decisions (in January) and war progressions (now) are having a noticeable impact on how prices fluctuate. Social trends are a great thing to keep an eye on to see which subjects correlate with price drops or price rises whenever they spike.
Sanbase PRO starts at just $44 per month, and you can enjoy a week of real-time metrics for free, just for making a free account! We highly recommend you check out https://app.santiment.net, and if you find the data helpful for making greater profits, you can head to https://app.santiment.net/pricing to become a PRO member with our friendly and wonderful trading and enthusiast community.
This analysis was prepared by Santiment, a market intelligence platform that provides on-chain, social media and development information on 2,000+ cryptocurrencies.
Santiment develops hundreds of tools, strategies and indicators to help users better understand crypto market behavior and identify data-driven investment opportunities.
Sign up to Santiment here: https://santiment.net/pricing
Disclaimer: The opinions expressed in the post are for general informational purposes only and are not intended to provide specific advice or recommendations for any individual or on any specific security or investment product.