Santiment's MVRV Divergence Model Just Got Better With Hourly Data & Other Improvements!

Due to popular demand, we have rebuffed our MVRV Opportunity & Divergence model to update every hour, as opposed to every day by using our new Intraday MVRV metrics. This will help keep you up to speed with the latest data on how close your favorite assets are to their next opportunity (or danger) zones.
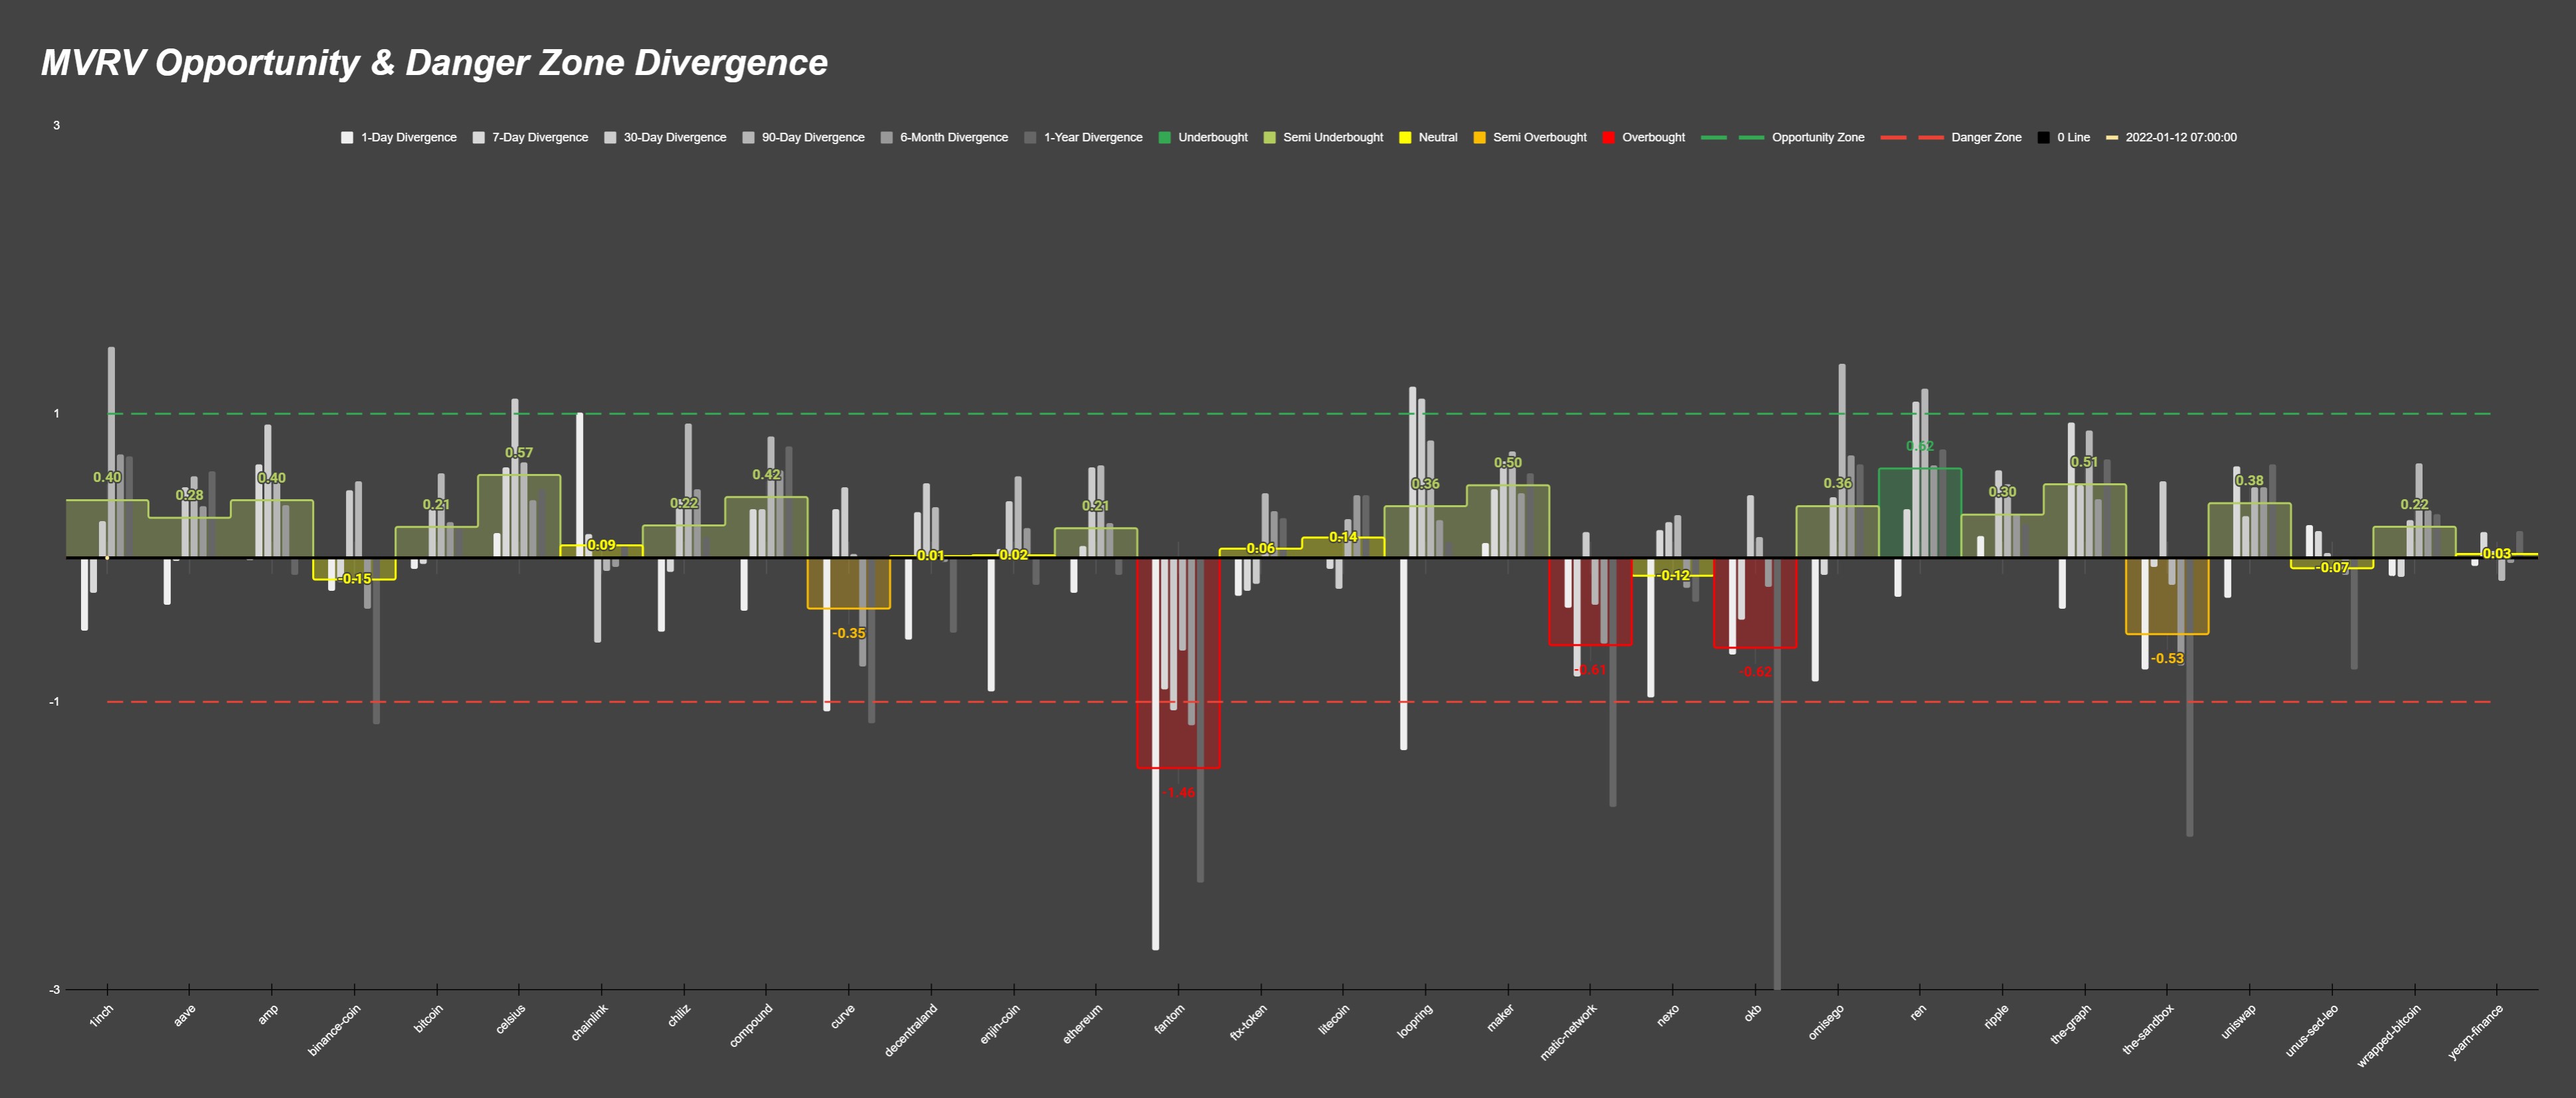
Remember that with the above Opportunity & Danger Zone Divergence main chart (located in the far left tab), the green and yellow-green colored bars are the ones that have the least amount of risk, according to MVRV data, if you were to open a position on it. High bars are better.
The chart calculates how far each respective major MVRV timeframe is from its normal 0% resting state. Then, it blends each MVRV timeframe all together to measure the percentage distance away, and tells us how close it is to an extreme overbought or extreme undersold zone.
Additionally, if you were a fan of our old model, we've expanded the amount of assets that will automatically update on our chart to 30. You can now get an even more all-encompassing glimpse at how much euphoria or pain the average trader is in, across multiple timeframes, to make informed decisions with your own portfolio.
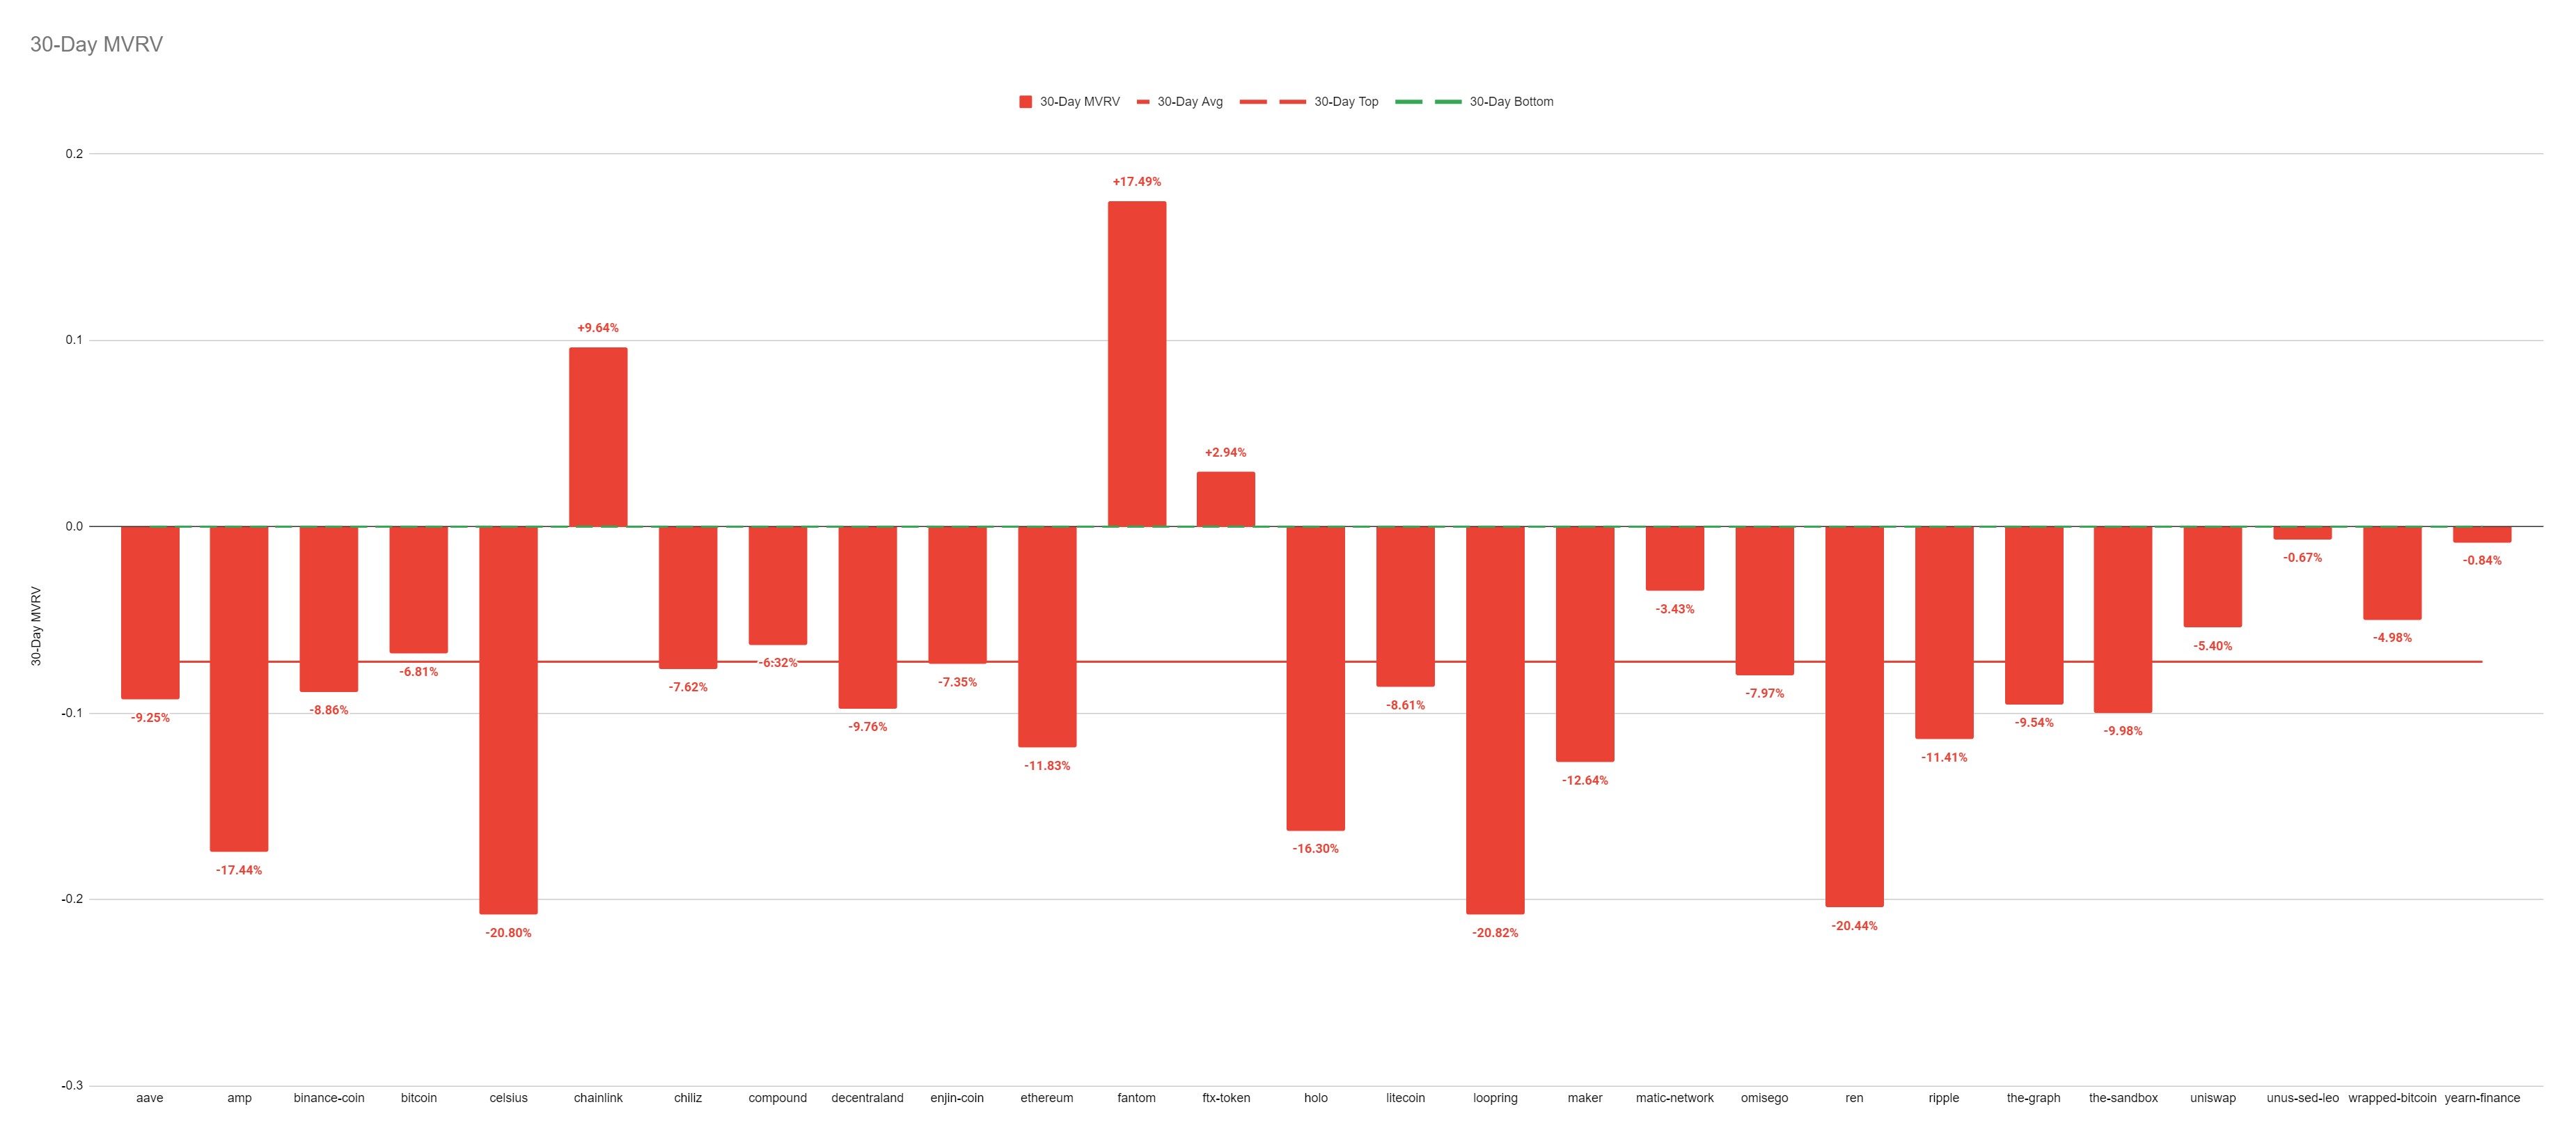
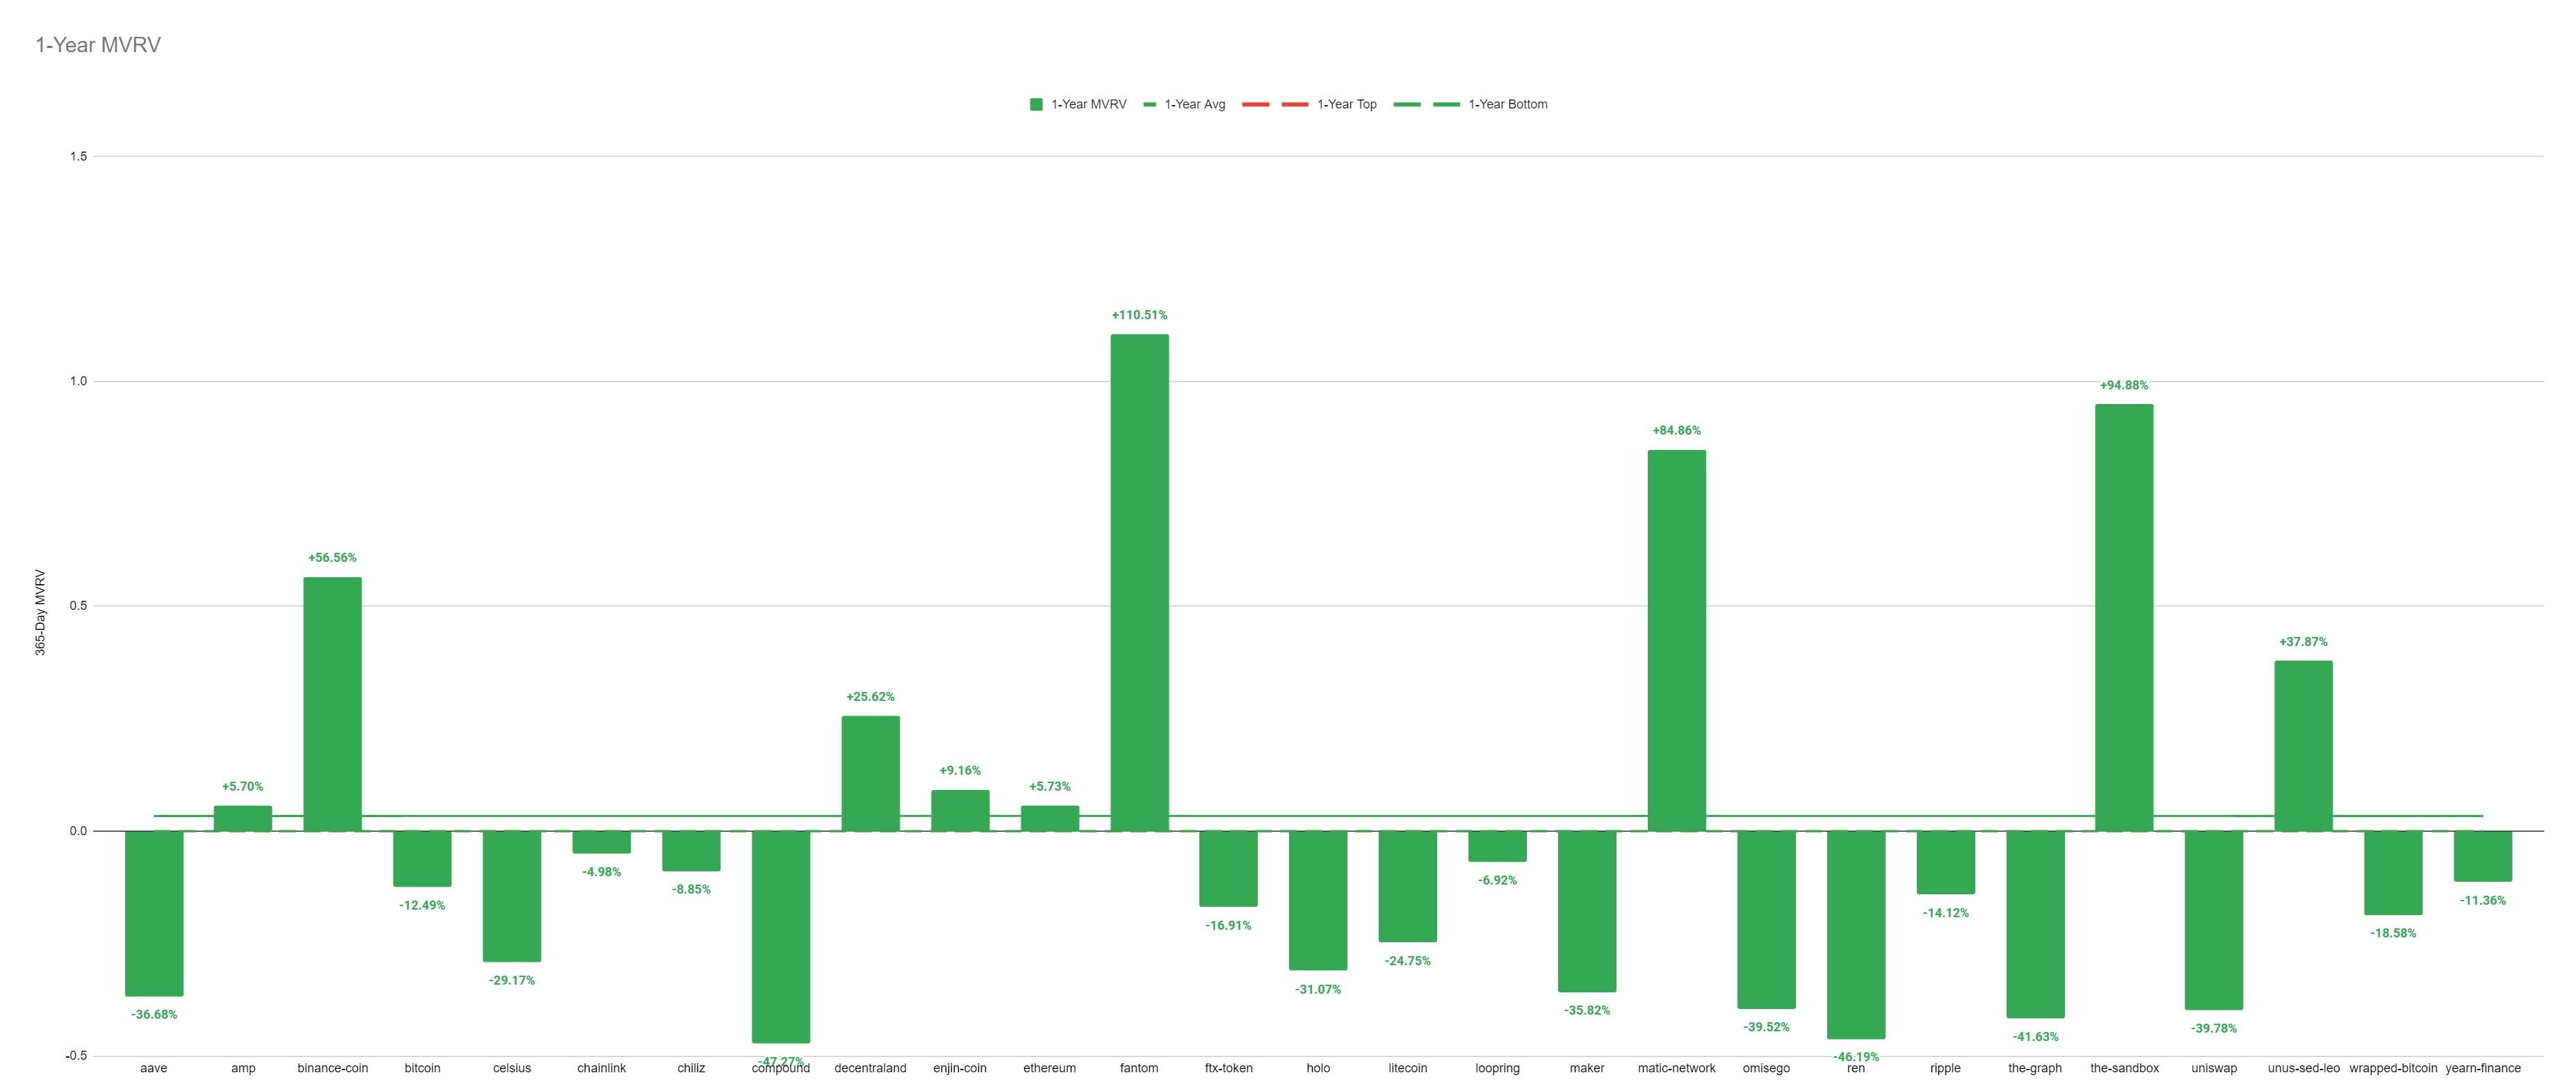
If you prefer to simply analyze how each asset's MVRV looks based on its 1-day, 7-day, 30-day, 90-day, 180-day, or 365-day, we have individual charts available to quickly see a snapshot and compare to find the best spots (negative MVRV is better, so remember that these bars aren't flipped to show the positive numbers highest like the main Divergence chart).
Open up the brand new and improved MVRV Opportunity & Danger Zone Divergence model here, and follow the instructions here:
Once you have your Sanbase PRO account (or if you already do), you'll then want to open the model and click on File -> Make a Copy, and simply:
1) Download Sansheets: https://academy.santiment.net/sansheets/setting-up/
2) Plug in your API: https://academy.santiment.net/sansheets/adding-an-api-key/
3) If you're having trouble getting the data to load on a model, head to the 'Data' tab on the far right of the spreadsheet, and go to the yellow cell. Then delete the cell formula, then hit Undo. This should manually refresh the data.
Disclaimer: The opinions expressed in this report are for general informational purposes only and are not intended to provide specific advice or recommendations for any individual or on any specific security or investment product.
Conversations (0)