
NVT ratio - alpha factor in crypto trading
Alpha factors in financial trading are transformations of market, fundamental, and alternative data that contain predictive signals. They are designed to capture risks that drive asset returns. An alpha factor in cryptocurrency market could be derived from combination of on-chain activity with market data.
This article aims to provide statistical analysis and backtest results of a simple rebalancing strategy based on NVT ratio metric, which is available on Santiment platform.
Network Value-to-Transaction ratio is an asset valuation metric similar to the P/E ratio traditionally used in equity markets to gauge a stock's growth potential. The formula for NVT = Daily Market Cap / Daily Transaction Volume.
You can check the detailed explanation of the metric here.
Time horizon and portfolio definition
The backtest was done on data starting from 1.1.2019 until 28.12.2019.
Universe of assets in the portfolio contains 50 assets, with the following selection criteria:
1. NVT Ratio data are available for the whole tested period
2. Asset is listed in Coinmarketcap Top150 at the starting day of the backtest (1.1.2019) in order to avoid survivorship bias (if we would choose from the top 150 today, those assets are guaranteed to perform the best among others in the backtest).
3. Lastly we look on the daily trading volume and from the intersection of the rule 1 and 2 we select only 50 assets with highest average volume for last 30 days.
Selected list of tokens in the portfolio universe:
ZRX, ELF, AE, REP, AOA, BNT, BAT, BNB, BTC, LINK, CVC, CRO, MANA, DENT, DGD, ENG, ENJ, EOS, ETH, FUN,GVT, GNT, HOT, HT, IOST, KNC, LOOM, LRC, MKR, MXM, MGO, NEXO, ODE, OMG, POLY, PPT, POWR, NPXS, QASH,QNT, QKC, R, XRP, SALT, SRN, SNT, STORJ, PAY, VERI, WTC
Trading strategy
We calculate the daily allocations of the portfolio from the asset's NVT value by normalising the daily values by asset (on asset axis) in order to get gross leverage of 1 (it means we invest 100% of the portfolio value in all assets proportionally each day). Rebalancing is set on daily basis.
Additionally we split the calculated values into 5 quantiles (top 20% of the values are in bucket 5...and so on..until bottom 20% of the values remains in the bucket 1).
The idea behind the quantile analysis is to break down the strategy returns by each quantile and our hypothesis is that the highest quantile yields the most profit and vice versa.
Since most of the assets are not tradable in short position, our trading strategy is long only.
Performance analysis
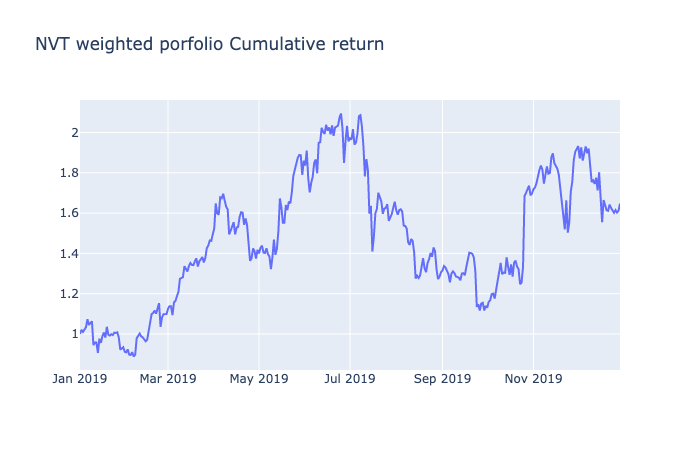
The backtest shows some positive results. With this simple strategy we could theoretically earn 61% on top of our investment with a Sharpe ratio of 0.85.
Next we visualise the mean returns by quantile to check if our "expected quantile pattern" (top quantile = top profit and vice versa) is fulfilled.
.png)
Cumulative returns by quantile indicates that 5th quantile yields the most profit and the 1st quantile is the least profitable.
.png)
We could potentially improve our strategy by trading the top quantile assets only. To do so we compute the daily values with same method excluding assets from quantiles 1-4 from the trading (in this case we allocate 100% of our funds in 10 assets daily).
We also want to compare the strategy with some benchmark. For this purpose the benchmark returns will be constructed from the same portfolio of assets, however the asset allocations will be equally weighted and rebalanced daily as well (disregarding the NVT data). Let's see the results.

.png)
Clearly our "NVT Top quantile" strategy outperformed the equal weighted strategy.
Most of us would be also interested how the strategy returns compares to the returns we would get by holding bitcoin for the same period.
.png)
The strategy returns outperformed holding bitcoin, which has been achieved mostly in the last 2 months of the backtest.
Conclusion
Our strategy based on a single alpha factor - NVT ratio outperforms the benchmark, which shows there is some predictive information in the tested data. It is necessary to mention that this is not a perfect backtest since we did not count any transaction costs (fees, slippage) in the backtest.
This research was done with a purpose to analyse and evaluate an alpha factor, in this case Network Value-to-Transaction metric, do not take it as a financial advice.
Please do your own research before making any investment decision.
Conversations (0)