New Discoveries Using Token Age Consumed in Our Newest Sansheets Model

Using Token Age Consumed on Sanbase & Sandata
Token age consumed may not be the most familiar metric in the cryptocurrency community. But due to its relevance and consistency in predicting key price direction changes of an asset, this may change in the next few years. This metric shows the amount of tokens changing addresses on a certain date, multiplied by the number of days since they last moved.
Most of the time, spotting outliers (via large spikes) is the best way to utilize token age consumed to your advantage, and when large quantities of tokens change addresses in a short amount of time, we will regularly find that an asset is hitting a local bottom or top. It is probably Santiment's favorite indicator when it comes to identifying a mid or long-term price directional shift. Ethereum's previous year of token age consumed, according to its Sandata chart, provides some great examples of foreshadowed price directional changes as soon (or shortly after) a large spike occurred.

As we can see, there were plenty of outlier spikes over the past year resembling major ETH token consumption. The largest of course, was notable, as it occurred on March 12, 2020, the day of the notorious Black Thursday price drop. Note that it didn't happen the day before, so this massive token consumption indicated that the sudden price drop was going to be followed by an immediate price shift (in this case, back to the upside). In other words, this was an amazing "buy the dip" indication. We also see that on June 2, 2020, we had a very recent token age consumed that more or less has correlated with a sudden stop to the price rise up to approximately $250, and likely picked up on some key large address moves.
And how about Bitcoin? Is this chart relevant for the #1 market cap project as well? You betcha. It works for any coin or token we track.

Bitcoin's token age consumed around Black Thursday was hardly significant interestingly, although there were some other key spikes. On July 28, 2019, BTC had its largest token age consumed spike of over 2.1M, and this ended up perfectly indicating a stop to the downtrend it had been seeing over the past few weeks. If you had bought the day this token age consumed spike ended up appearing on Santiment, you would have been able to jump in around $9,560 all the way to $11,800 just two weeks later.
The New Multi-Asset Token Age Consumed Model on Sansheets
With a basic understanding of how our Token Age Consumed metric works, I wanted to take a look at how spikes for lots of key assets would look all on the same chart. However, it's important to note that not all assets are created equal. While Bitcoin's highest token age consumed was 2.1M tokens over the past year, the highest consumption for 0x was 19.2B. So plotting things on the same axis would just dwarf several projects. Luckily, there is a way to level the playing field a bit:
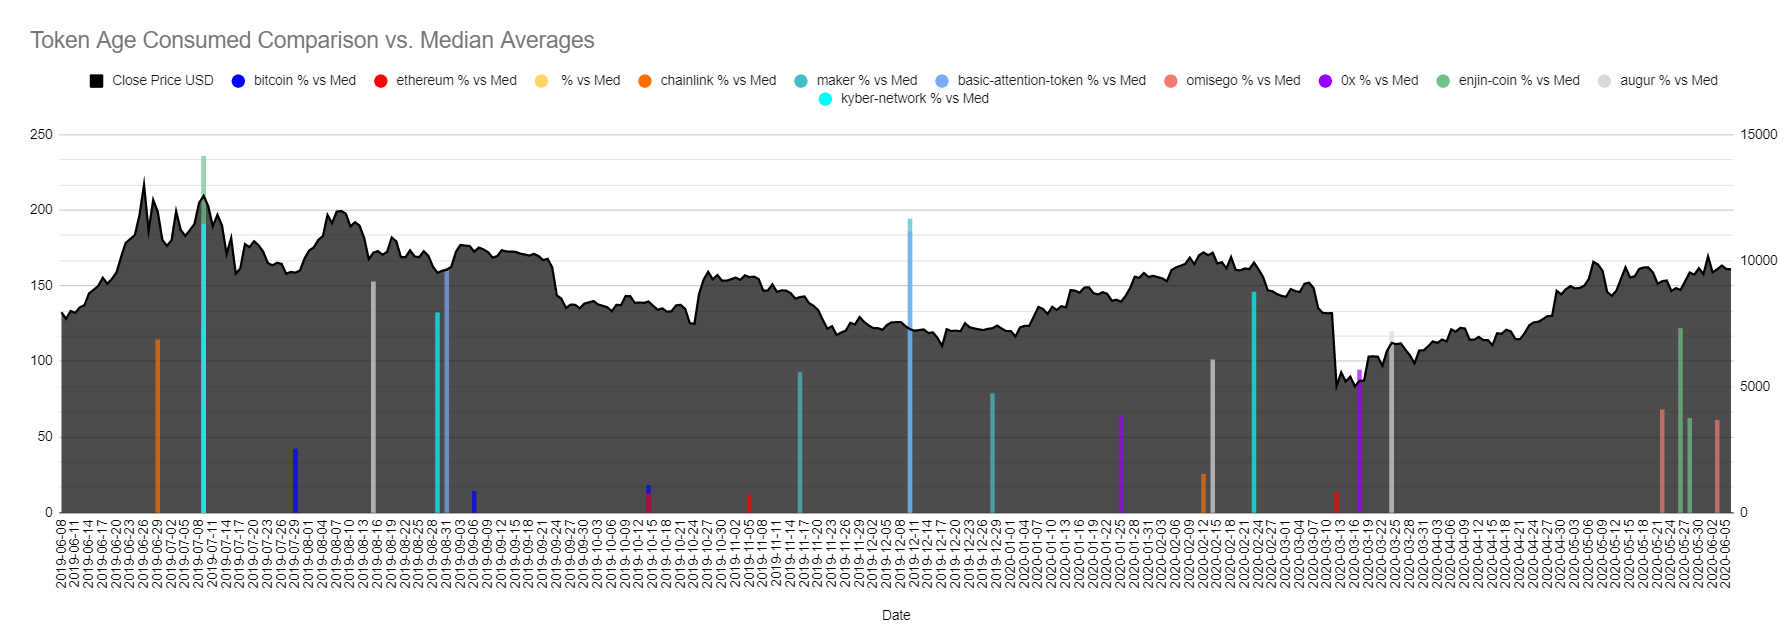
What we see here is the model I've recently made on Sansheets, which highlights the largest spikes for several key projects vs. each projects' own respective median token age consumed. So instead of plotting some of these token age consumed numbers in the millions, and some in the billions, we're seeing these spikes vs. their most average number over the past year. The left axis resembles the multiple above its normalized range each spike ix. So for example, the largest spike we see on this chart, represented by Enjin's light green spike on was about 236 times its normal expected median over the past year.
The black area chart is simply BTC's price, but this can easily be switched around as needed to view any price vs. its particular token age consumed. The model can also be customized to only show the "x" highest amount of spikes. In this image, it's showing the three highest token age consumed spikes for each project shown in the legend at the top of the chart.
On a more zoomed in, 90 day chart, let's see how things look for just the top token age consumed spike for each of these projects:

Interestingly, both Ethereum and Bitcoin (the blue bar hidden behind ETH's larger red bar) had their largest token age consumed spikes over the past three months on Black Thursday. And for both, this signified the local bottoms during this time.
You'll notice that there was a mysterious yellow bar missing though. And there's a reason that Binance Coin was excluded from these two examples:

Take a look at what Binance's massive token age consumed does to the axis and all the other projects shown on this one-year chart of the highest spikes for this metric during this timespan. The three highest spikes are absolutely monstrous, indicating that when BNB tokens change addresses, combined with the ages in which they had been sitting in their wallets, they do so in absolutely massive droves.
One spike in particular really stands out for Binance Coin really stands out, and the token consumption on this particular day was just over 2,320 times the normal amount of token age consumed over the previous year. With a total token consumption of 1,988,929,888 BNB on June 26, 2019, this was very obviously the highest token age consumed of the top tokens we track data for on Santiment. But more significantly, it correlated perfectly with a now nearly 2.5 year high for Bitcoin (and many other crypto projects as well). On this very same day, BTC closed at the highest price (~$13,020) it had seen since the end of the bull run in January, 2018. But on June 27th, the price of Bitcoin plummeted from $13,020 to $11,100 the very next day. The price dropped -14.8% in these next 24 hours, and for the majority of assets, it was a much higher percentage drop.
Taking a look at the other two largest spikes for BNB, even they correctly predicted some local tops for BTC. The yellow shaded spike on February 13th, 2020 correlated with a local top of just over $10,200 for Bitcoin, which prices did not return to for over three months. And even the mini price top that occurred on BNB's latest large spike on April 18, 2020, saw a mini Bitcoin price retracement of about -5.2% over the next three days that followed it.
Did Binance play a role in the entirety of crypto's price and market cap two and a half year high? My suspicions say that this is a pretty fair indication. Perhaps this was a direct sell-off using a BTC/BNB pair on their exchange. This would make sense as to why one asset can have such a direct impact on the largest asset in crypto. It also gives an indication as to how enormous of an impact Binance really has on the totality and health of the entire market cap of crypto. I'm looking forward to investigating the impact of BNB and other assets on the state of not just their own prices, but crypto as a whole using this new template on Sansheets.
In the meantime, we're looking forward to improving this model further, sharing it with our SanFam community, and making new discoveries alongside them!