
MTL - What's going on?

Assets covered: Metal (MTL)
Metrics used: Price, Network Growth, Supply on Exchanges, MVRV 7D, Network Growth, Network Profit/Loss
Chart: https://app.santiment.net/s/ZXk63Ku_
MTL became the top traded coin by volume (USDT) on Binance today. Let's take a look at what's going on.
Price
MTL managed to hold its lower trend line and eventually broke out of a symmetry triangle pattern with huge trading volume to the upside and by upside, we are looking at parabolic increase of +100% in a day.
However, the trading volume looks a little suspicious as there was no speculative event or news around it and trading volume was considerably lower.
It had previously seen similar trading patterns in the past, where price and volume went up heaps and just died off, which is quite typical of a pump and dump.
Supply on Exchanges

MTL's Supply on exchanges saw a huge dip of around 50% about 12hrs before the price went parabolic.
That amount of MTL off exchanges isn't exactly normal according to its 6 month history, perhaps some one knew something?
MVRV 7D

MTL's MVRV 7D which measures the short-term profit/loss of holders is showing that we are in the danger zone, as all short-term holders are in the profit at the moment - Which could incentivise them to take some profits.
Network Growth
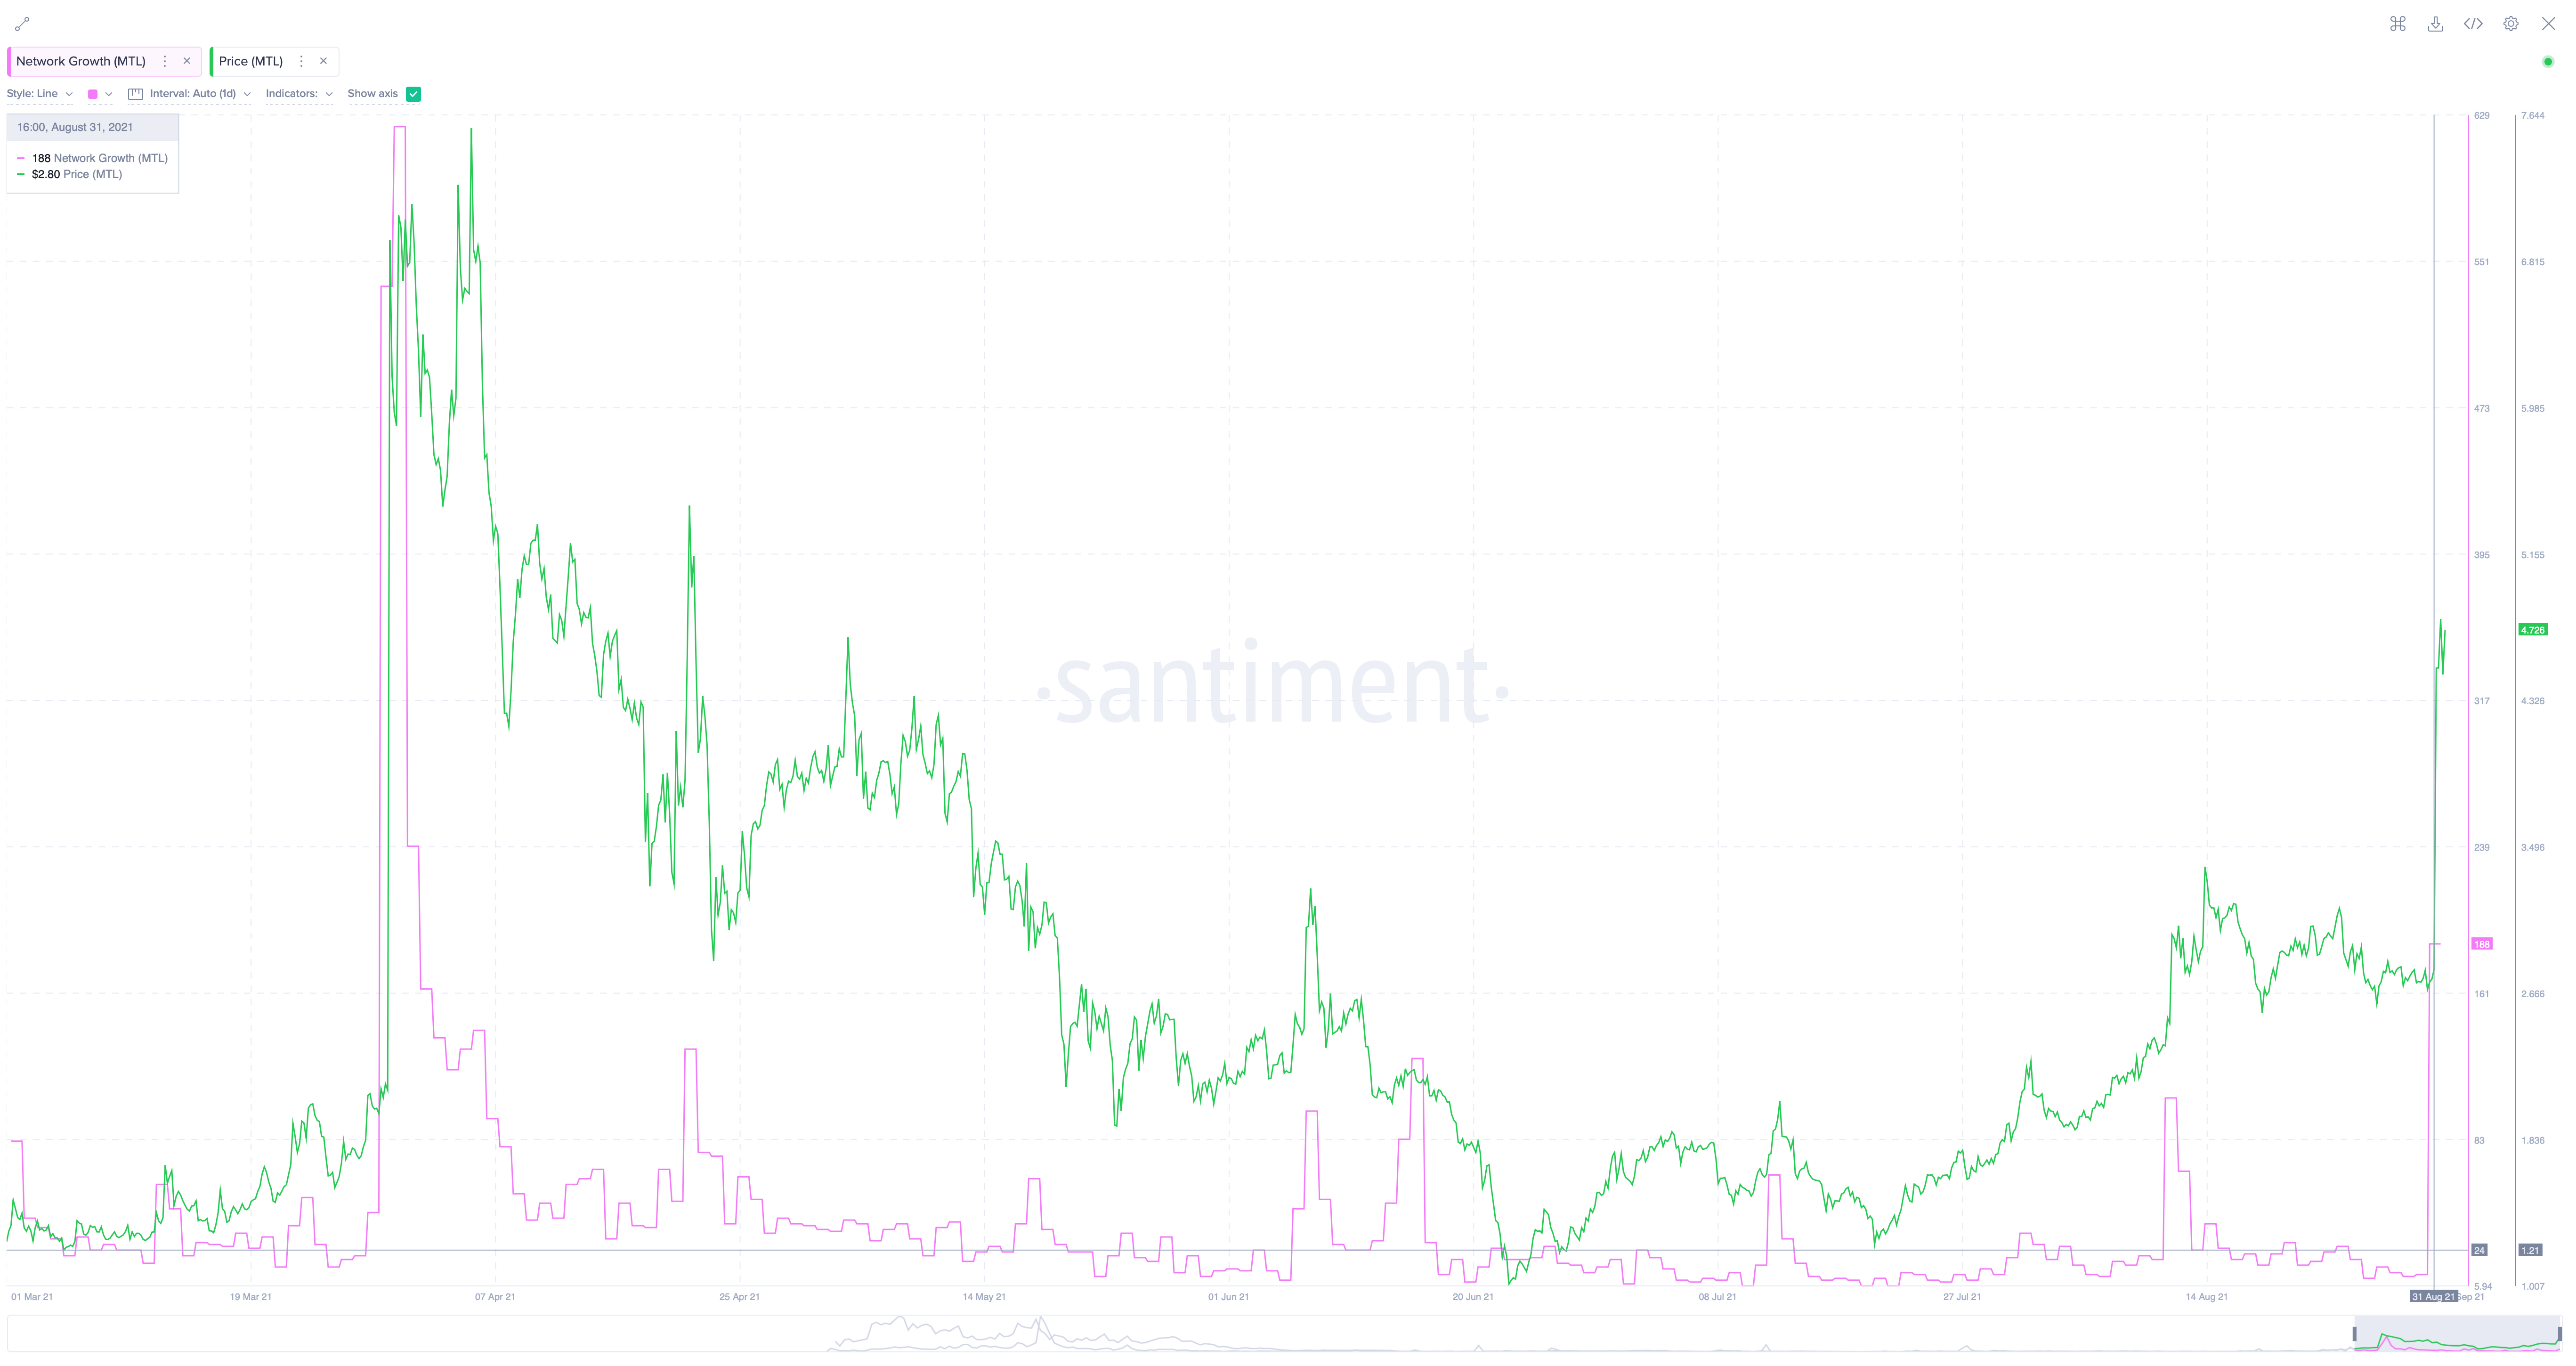
With a spike in price, we are also seeing a huge spike in Network Growth, is good for a start. However, what we really want to see is continue network growth over time, which is indicative of a healthy network.
A sudden spike like the one we are seeing now, however parabolic it's going to go, followed by a huge drop and flattening of network growth just shows that participants were in it for the pump and not actual network use.
A good example is what happened in late March 2021.
Network Profit Loss

Network Profit/Loss (NPL for short), which computes the average profit or loss of all coins that change addresses daily is now seeing a huge spike, similar to the one observed in late March 2021.
This means that certain market participants are in huge profit at the moment, which is an incentive for them to offload their bags, at least in the short-term.
Summary
While the breakout with high trading volume is a good sign, the trading volume behaviour prior does look like a typical pump and dump. On-chain metrics are also showing some signs of people "in-the-know" prior to the price spike, which does raise some concern just how organic this price action is.
Could it go higher? Sure, as long as everyone's in the party. Just remember what happened to the party in March.
Stay safe out there!