Market analysis through the lens of stablecoins behaviour

Token circulation -- it's the number of unique coins transacted daily.
How does the circulation look like for stablecoins on a 2 year time span?

What can we see here?
Most circulation is in USDC, but it's decreasing. As well as USDT. DAI increasing. Has it been like this before?
2021, May:
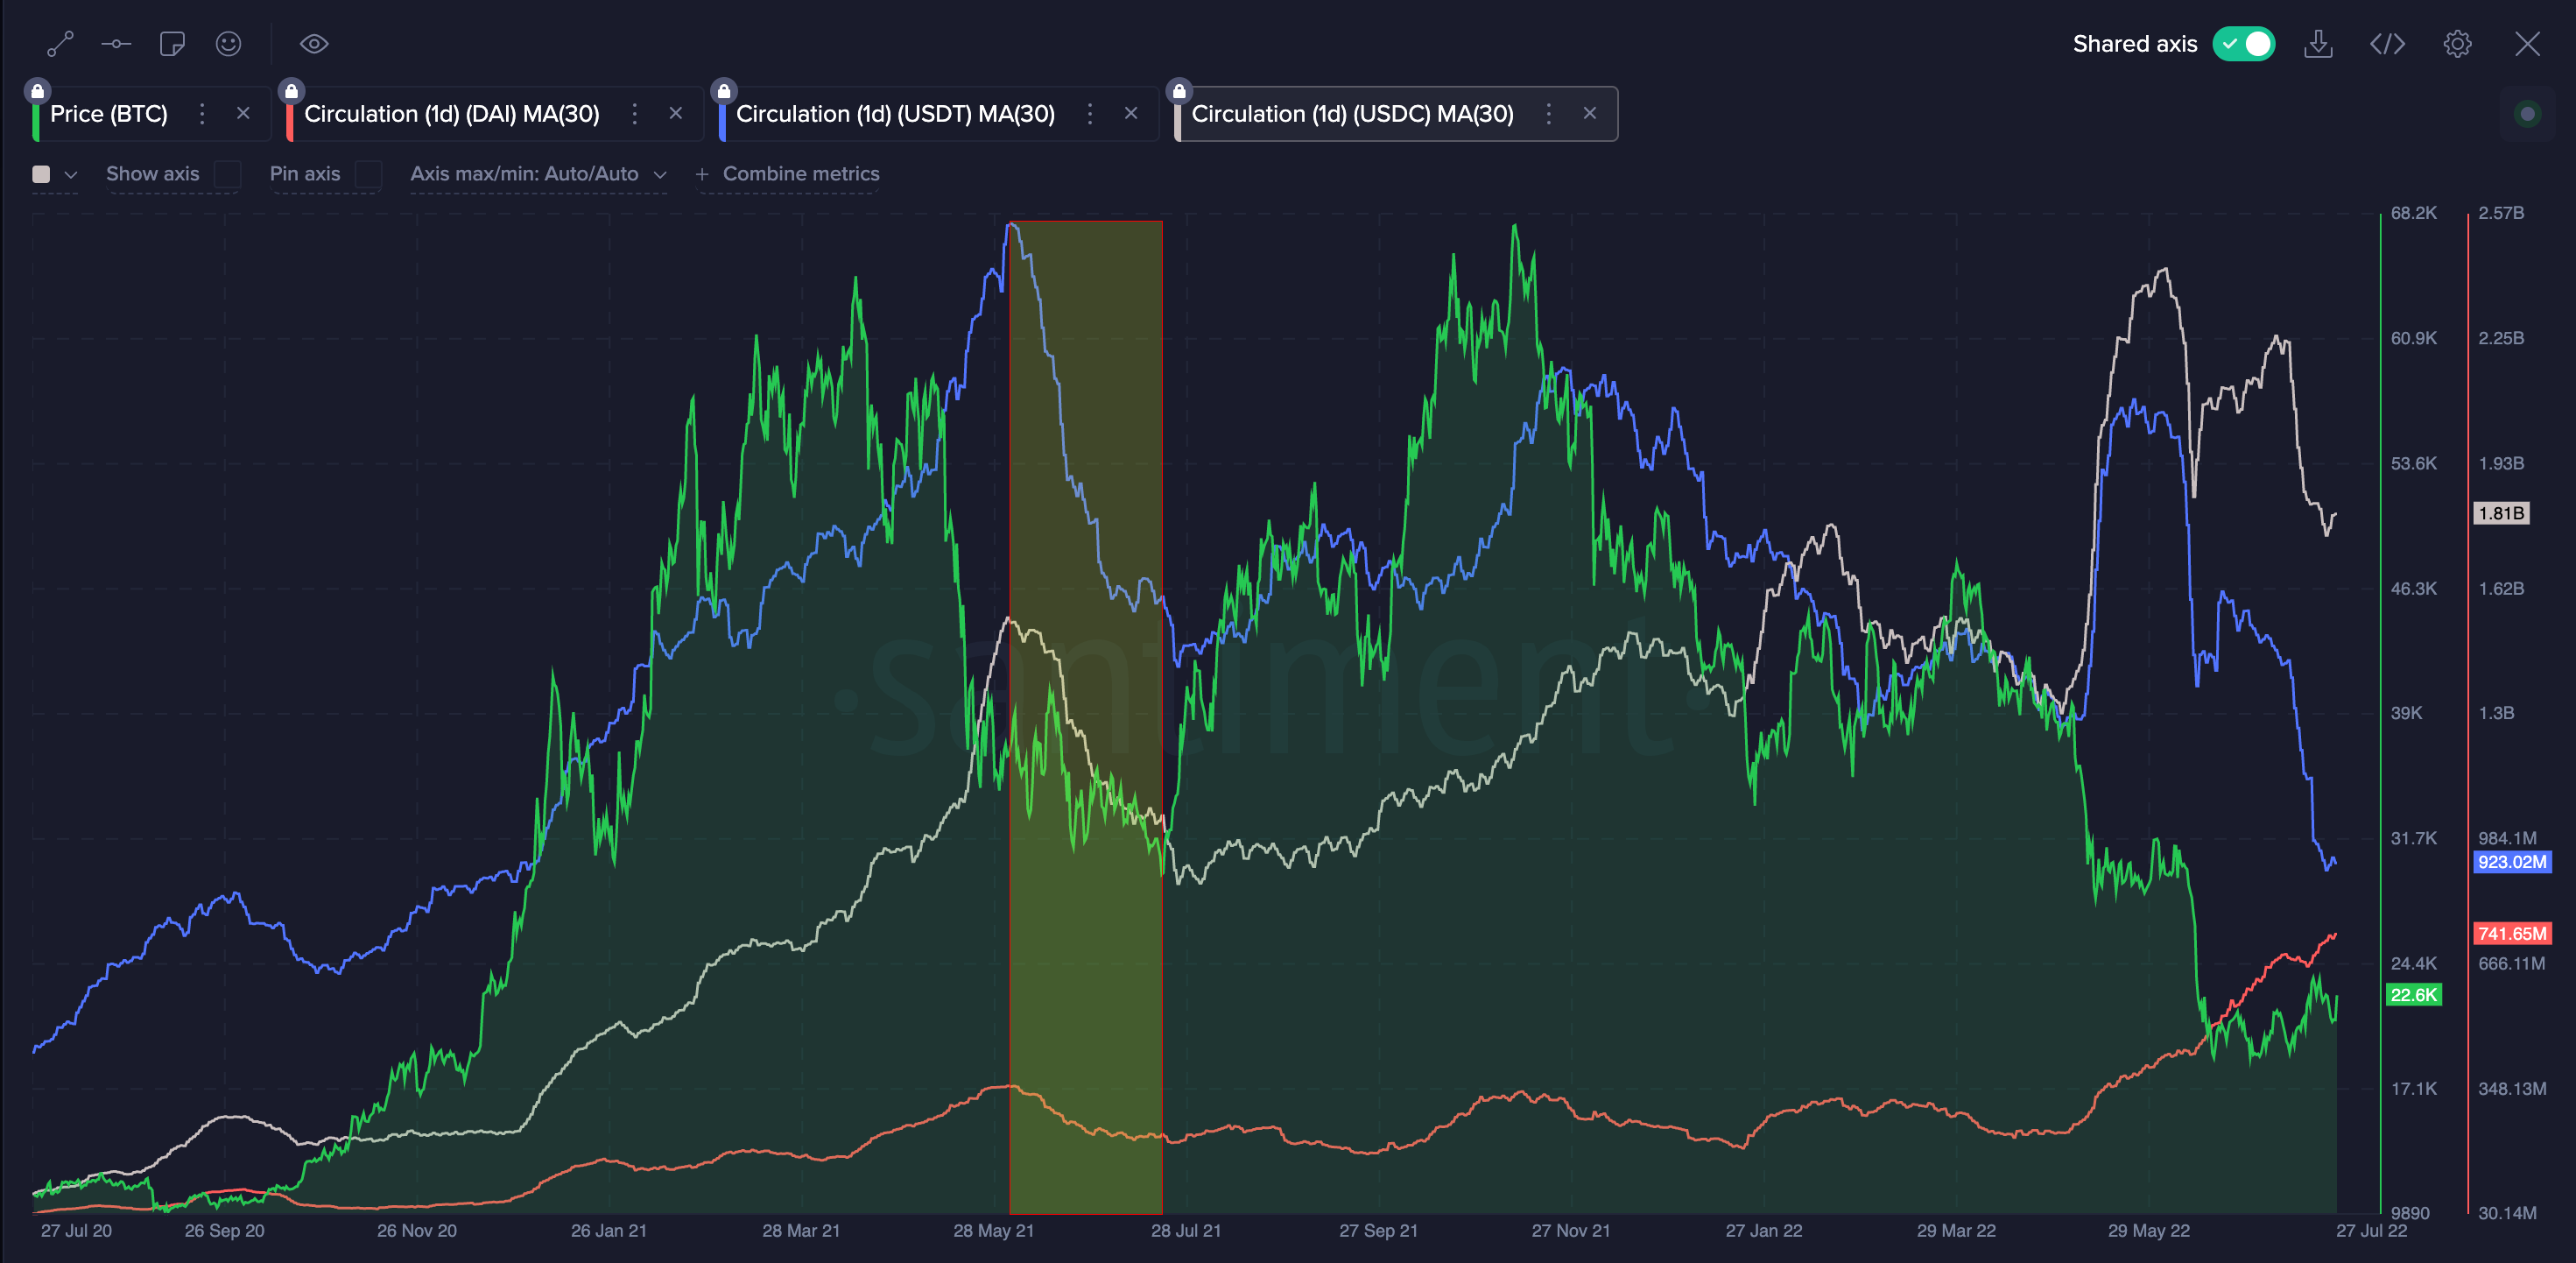
Market going down, stablecoin circulation cooling down.
And at some point when market grow, they don't yet.
2021, July:

Stablecoin circulation kept going down even on a growing market.
We might say that first significant growth happened on a decreasing circulation.
2022, May:
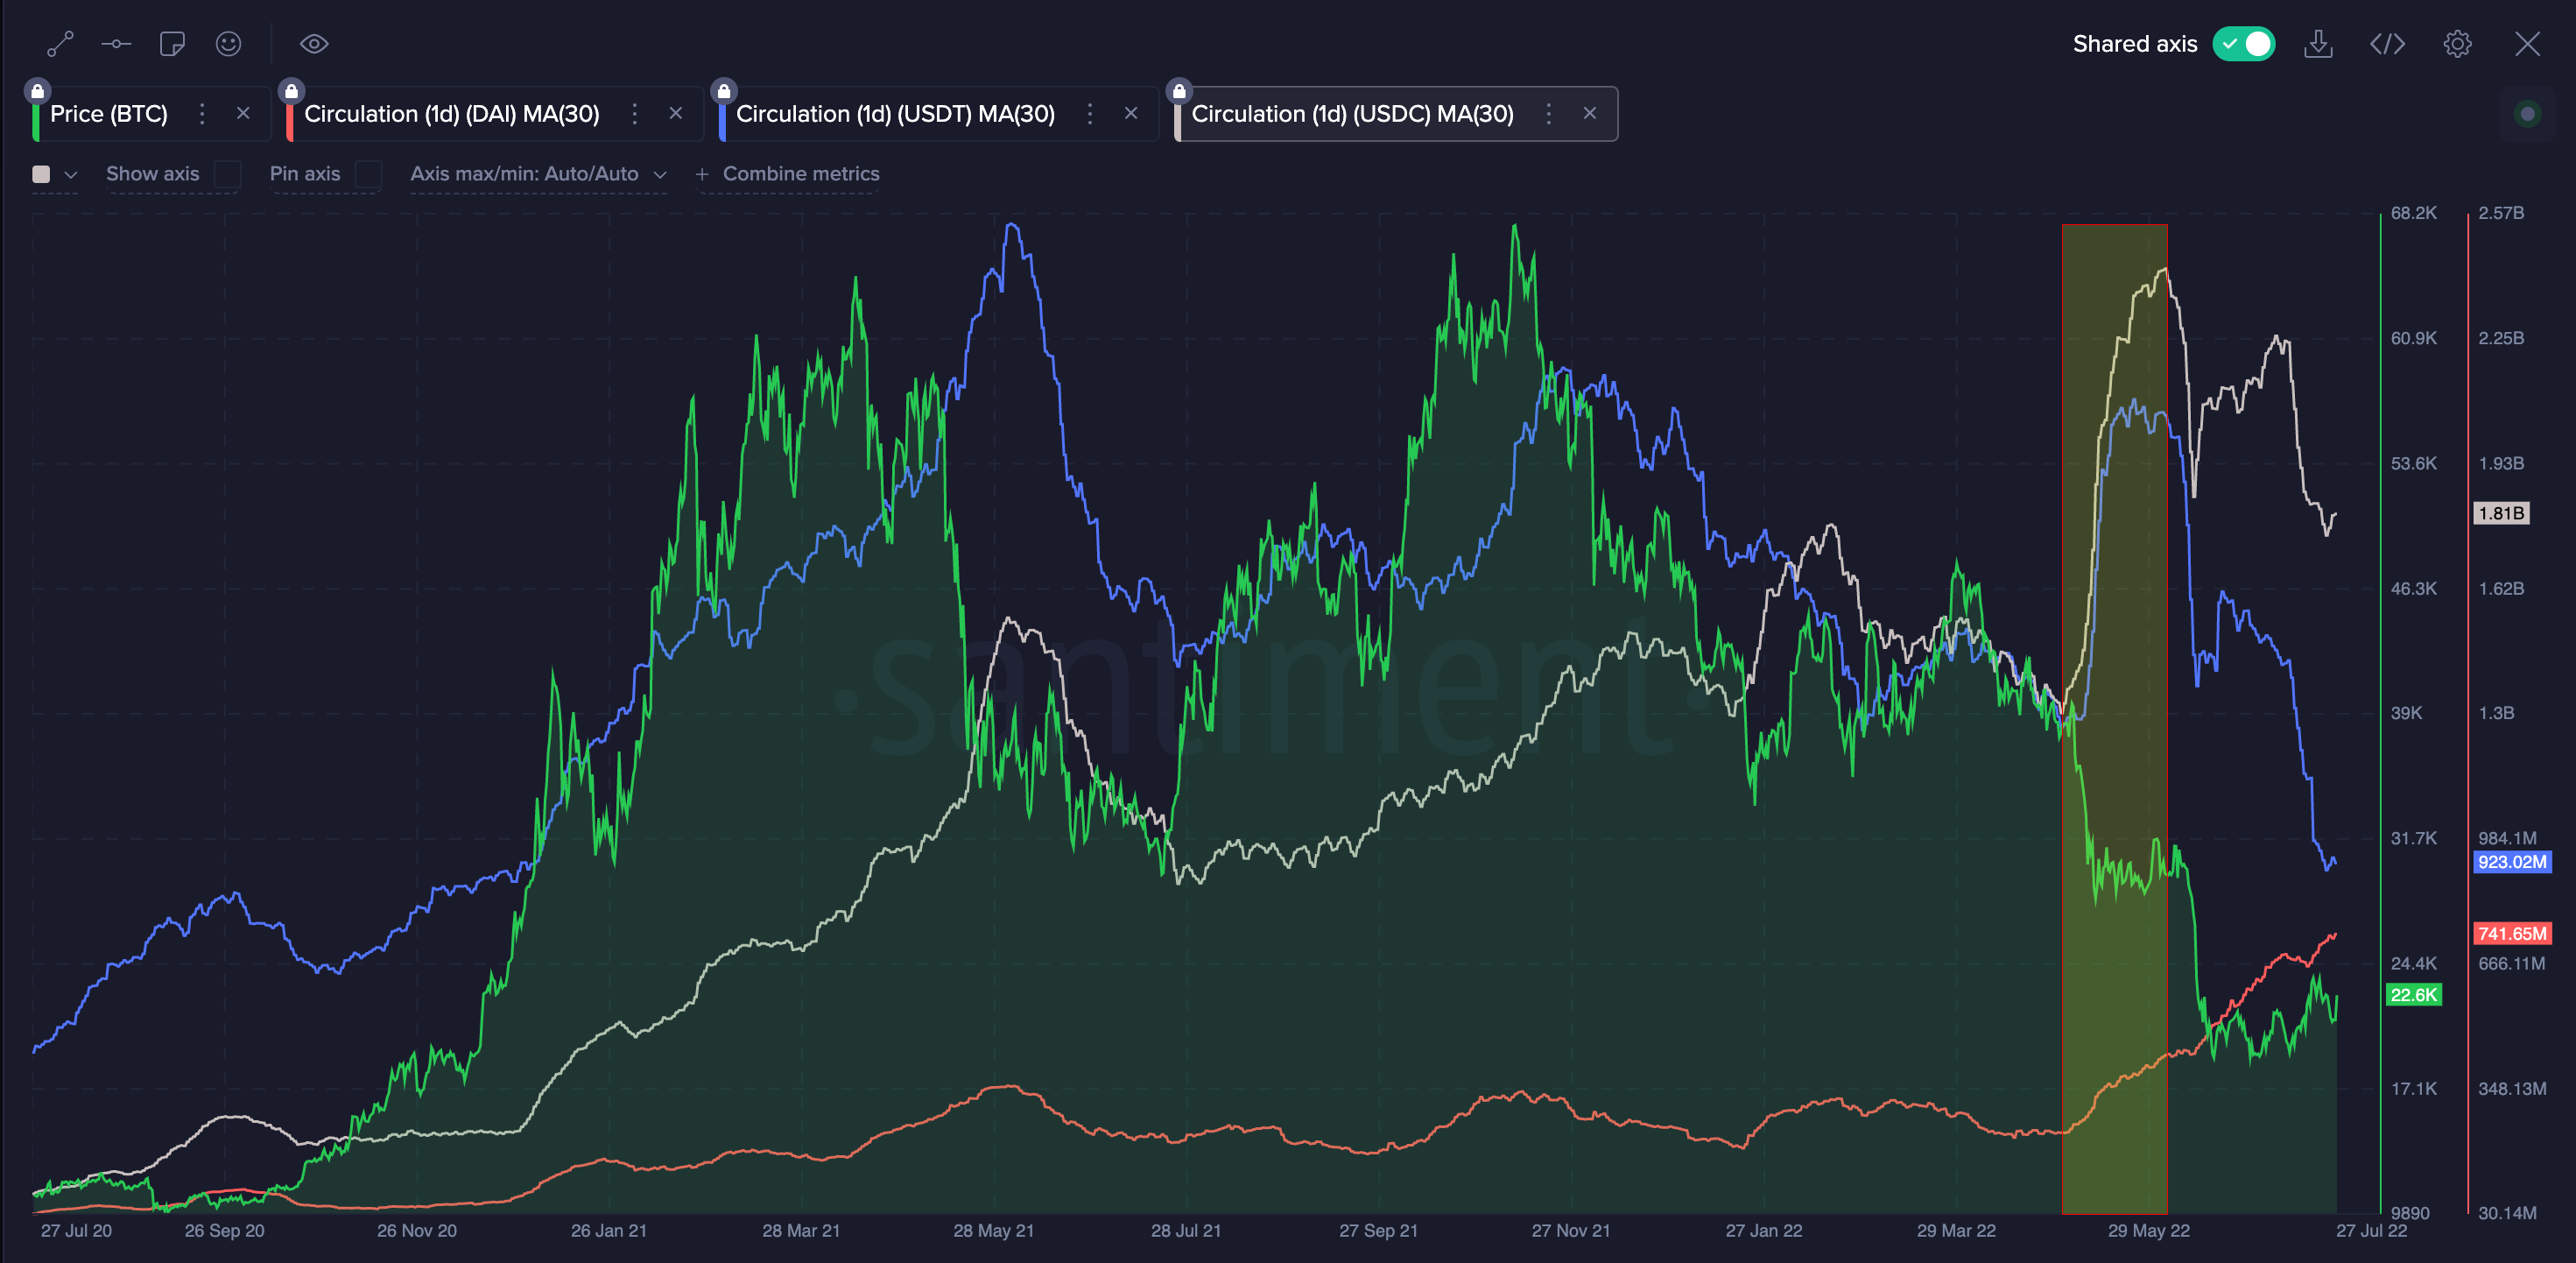
Stablecoins tried to heat up strongly, but no, the market didn't go up. Because the best pattern could be stables still decreasing on recovering market. Like nowadays. When stablecoins don't believe in recovery yet, preferring to wait.
We're probably witnessing the same as July 2021 now, at least on two stablecoins:
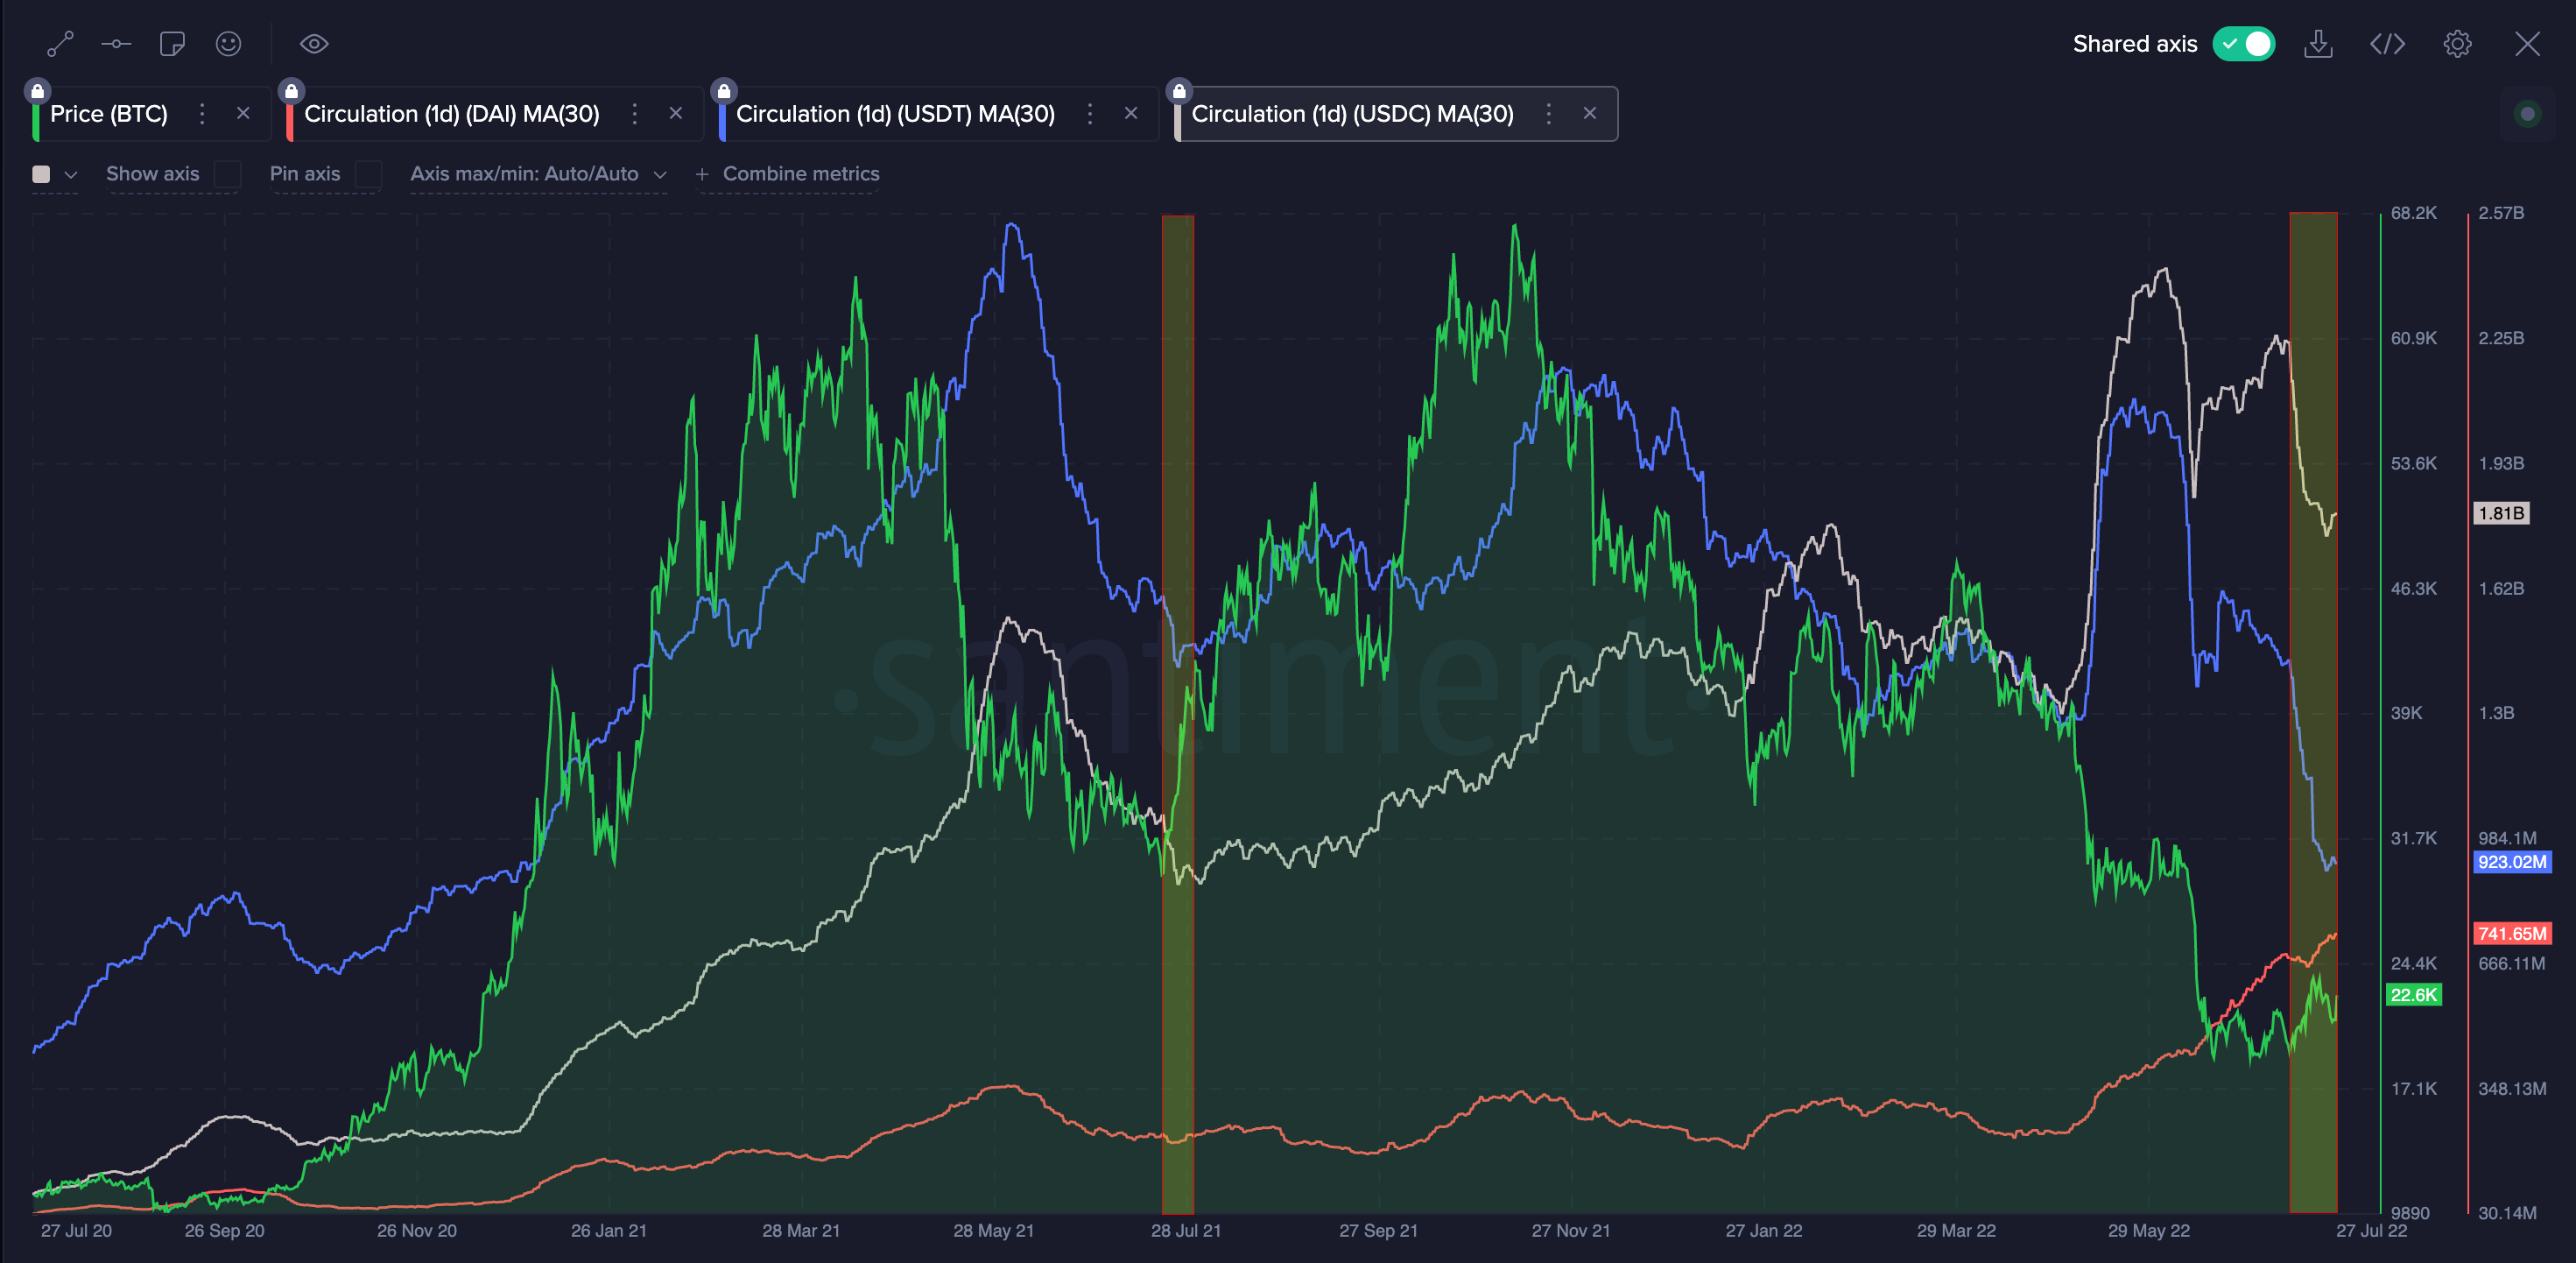
Chart used: https://app.santiment.net/s/Hzx99LSH
-----------------
Disclaimer: The opinions expressed in the post are for general informational purposes only and are not intended to provide specific advice or recommendations for any individual or on any specific security or investment product.
Thanks for reading!
If you enjoyed this insight please leave a like, join discussion in the comments and share it with your friends!
Never miss a post from Santrends!
Get 'early bird' alerts for new insights from this author

Conversations (0)