LINK breaks ATH: What's next?

A perennial crowd favorite, Chainlink (LINK) has been one of the top performing ERC-20 coins as of late, gaining 54.8% in the past week and currently sitting at an all-time-high $4.45:

The current rally for LINK actually began at the very start of the year - January 1st, 2020. At the time, the coin was hovering at around $1.81 and was well on its way to retesting a 4-month low.
Since then, LINK has mushroomed by over 145%, likely propelled by both the market-wide sentiment as well as a number of recent announcements, like the project’s integration with the popular Swipe Wallet or its decentralized flight insurance solution, developed in collaboration with Etherisc.
So where do we go from here? As LINK wades into uncharted territory, let’s take a closer look at its recent fundamentals, and what they might tell us about the coin’s short-term prospects.
As you’ll see in a moment, a number of the token’s on-chain and social indicators have been flashing top signs over the past few days - though it’s not all bad news. Here we go:
1. LINK hype nearing its peak
For the second time this week, LINK made an appearance today on our list of top emerging words on crypto social media:

This list is calculated based on comment data from over 1000 crypto social media channels, indicating a major spike in LINK-related chatter in the crypto community. In fact, Sanbase has recorded more than 1100 new mentions of ‘LINK’ or ‘Chainlink’ in the past 24 hours: a 4-month high for the coin:

An altcoin’s appearance on our list of top emerging trends has proven to be a reliable top indicator time and time again; as the crowd’s interest in a coin begins to peak, so too does the, and a swift correction is not uncommon.
I’d pay attention to our emerging trends list over the next few days - a forming top is usually demarcated by multiple successive appearances of the coin on the list, as was the case with OGN a few days back:

Here’s a quick signal to alert you the next time Chainlink makes our list of top emerging words on crypto social media.
2. Overinflated network activity
In the past few days, LINK has experienced a significant uptick in on-chain activity, mirroring the coin’s monster rally.
The amount of daily addresses that have either sent or received LINK hit a 7-month high (4564) on Wednesday, overshadowed only be the network’s activity during its previous all-time-high:

As tops begin to form, we’ll often see a notable divergence between the coin’s price action (trending up) and it’s on-chain activity (trending down).
You can see that very pattern during LINK’s July 2019 top in the image above. As the network’s on-chain activity and speculative interest starts to decline, the price is no longer able to sustain its upward momentum and begins to correct shortly afterward.
We’re seeing a similar pattern taking form over the past few days - LINK’s daily active addresses peaked on February 12th, and have been trending downwards since despite the coin’s price charting higher highs:

I suggest keeping an eye on LINK’s on-chain activity during the weekend. Should its daily active addresses continue to trend downwards and revert back to pre-pump levels, it may prove a worrying sign for LINK’s further rally potential.
It’s not just its daily active addresses that have been surging lately: LINK’s on-chain transaction volume has also been picking up steam, with a massive spike on February 12th (49.2m), further reminiscent of its 2019 top:

Finally, LINK’s also experienced a notable bump in Token Age Consumed on Wednesday, indicating that some previously idle coins have started moving again:

Spikes in Token Age Consumed are often very potent volatility markers - rather than correlating with only the tops or only the bottoms, a TAC bump signals a major paradigm shift in the behavior of an asset’s long-term HODLers, which ought to be put in the context of the current market conditions and the coin’s recent price action.
In line with the above, there’s also been an uptick in the percentage of recently active LINK coins across the board (see below). This further validates the fact that some of the previously dormant coins are on the move, which could prove to have an adverse impact on an asset’s price.

3. Elevated exchange inflow
- Forming tops are often accompanied by an uptick in the amount of coins being moved to exchange wallets, as HODLers look to cash in on the pump.
For LINK, such incline has been observed on several of our charts in the past week. Our Deposit Volume chart shows a total of 25.92m LINK (~$114m at the time of writing) has entered centralized exchange wallets through deposit addresses on February 12th:

But let’s get a bit more granular. At the moment, much of Chainlink’s trading volume is concentrated on one exchange in particular - Binance.
On-chain, there’s been a major uptick in the inflow of LINK to all known Binance wallets in the past week, with almost 12.8m LINK hitting various Binance addresses on February 12th:

But let’s get even more granular. In Sandata, we can request information on the top individual transactions for any ERC-20 coin for a given time frame. Here’s a snapshot of LINK’s biggest transfers in the past week:

The first 2 transactions on the list are tied to Binance moving LINK from one of their wallets to another (cold to hot storage perhaps?), so we’ll leave those aside.
The third transfer - including 1.2M LINK ($5.25m at the time of writing) - confirms that some LINK whales are in fact starting to sell. As you can see, the sender has moved 1.2M LINK to an interim address 0xc54[...], which held on to the coins for about 36 hours, before slicing them into two smaller transactions - of 500k and 700k LINK - and sending the coins to two different addresses:
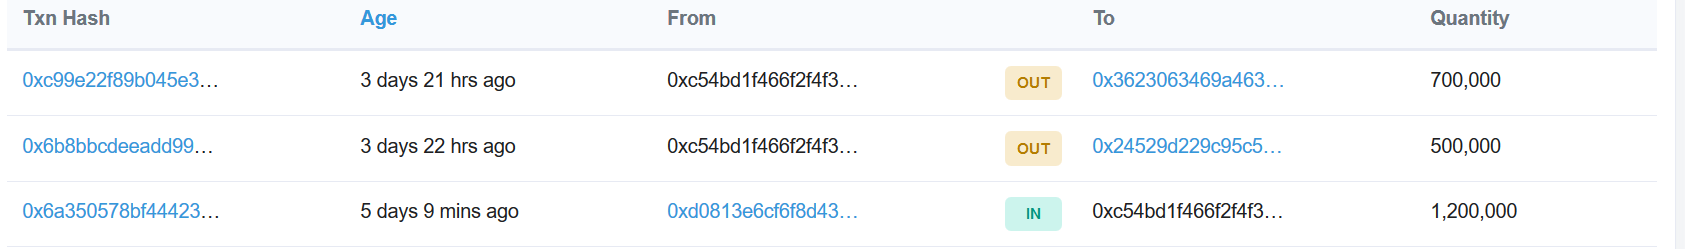
From there, both recipient addresses quickly got rid of the coins: the one that received 700k LINK immediately moved it all to a known Binance wallet:

While the other 500k found its way to Huobi in a similar fashion:

If we analyze the original sender address on Sanbase and its historical LINK holdings, we can see that the owner received all of its LINK on December 13th, when the coin was hovering at around $2.11:

His/her coins finally hit the exchange this Tuesday, just as LINK was breaching $4. That’s an ROI of about 89.5% - not bad for a two-months work.
4. Whales on the fence
Piggybacking on the above, I wanted to end this analysis by looking at how different LINK holder demographics have behaved over the past week.
Let’s start with the LINK’s biggest whales. Sandata lets us look at the top 100 addresses holding any ERC-20 coin, choose between exchange and non-exchange wallets, and analyze their holdings over time.
Here’s the cumulative balance of LINK’s biggest non-exchange wallets over the past 6 months:

As you can see, the big players have been confidently accumulating LINK throughout the last 6 months. However, we are now starting to see the first notable dips in quite some time.
Over the past 5 days, the cumulative balance of top LINK wallets declined from a 2-year high 745.14m LINK to 743.5m LINK. In other words, almost 2 million LINK (~$8,740,000 at the time of writing) has departed from these addresses since the start of the week.
And while this could prove to be a sign for concern, it’s worth noting that other major LINK holders have not mirrored this behavior just yet.
Sandata breaks down all LINK holders by the number of owned coins. Several major LINK cohorts - like addresses owning between 100k and 1m LINK - have not significantly reduced their holdings in the past several weeks:

Similarly, the cumulative balance of addresses holding between 10k and 100k LINK has been plateauing around 80M for around two months now:

Both of these cohorts dumped their holdings significantly prior to and during the 2019 top. If history’s to judge, I’d be keeping an eye on their behavior over the next few days; if they start offloading their bags, it could be lights out.
Thanks for reading!
If you enjoyed this insight please leave a like, join discussion in the comments and share it with your friends!
Never miss a post from Ibis!
Get 'early bird' alerts for new insights from this author

Conversations (0)