
Introducing our new Uniswap (UNI) dashboard!

We're very excited to debut our brand new Uniswap (UNI) dashboard live on Sanbase! (if you're not seeing the page yet, make sure to do a hard refresh: Ctrl+Shift+R)
Get real-time data on UNI token distribution, total amount of UNI claimed, amount of UNI on centralized and decentralized exchange, top UNI transactions and more.
Here’s a brief overview of all metrics available on our new Uniswap page:
(P.s. Let us know in the comments what other UNI metrics you’d find helpful and we'll add them to the dashboard in the coming days!)
1. Unclaimed UNI tracker
This chart tracks the historical balance of the UNI token’s smart contract address.
The address is in charge of distributing claimed UNI tokens, allowing you to track how its balance diminishes over time as users come forward to collect their UNI, and estimate the potential level of sell-side pressure by proxy.
150,000,000 UNI have been designated for historical liquidity providers, existing Uniswap users, and SOCKS redeemers/holders, based on a snapshot taken on September 1, 2020, at 12:00 am UTC.
2. Post-claim activity of UNI tokens
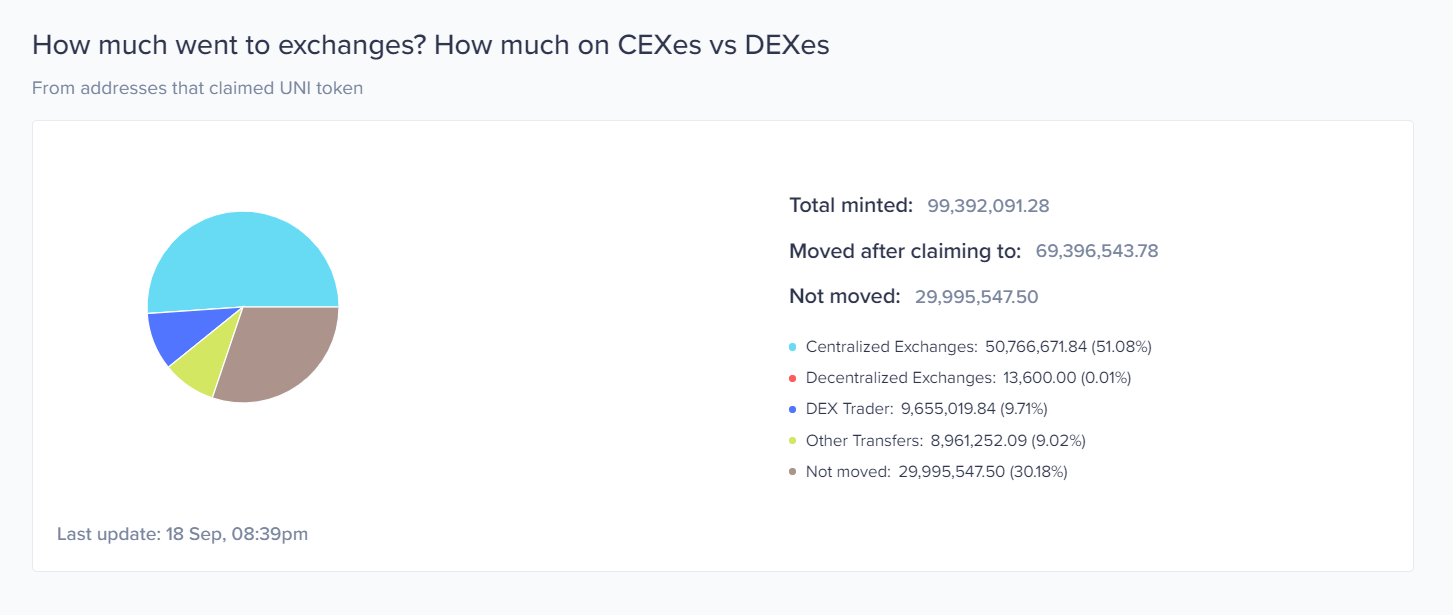
Tracks the subsequent activity of claimed UNI tokens.
This dashboard tracks how many UNI tokens have been claimed, and what happened to them afterwards.
The claimed UNI tokens are split into two broad categories: Moved after claimed and Not moved (dormant), and segmented further by their end location to:
- Centralized Exchange
- Decentralized Exchange
- DEX traders
- Other Transfers
Important: Please note that we don’t currently track Coinbase Pro wallets, so any UNI hosted on Coinbase will likely fall under ‘Other Transfers’
3. Largest UNI transactions in the past 30 days

Tracks the largest transfers of UNI in the past month.
This dashboard lets you analyze the biggest UNI transfers for the past month, including transaction time, transfer value, sending and receiving address, and a link to the transaction hash on Etherescan.
Clicking on any ‘From’ or ‘To’ address will open the historical balance of both UNI and ETH for said address:

You can also plot the price of UNI over the address' balance by clicking on the 'cog' icon. The price of UNI will be added to the chart by default in an upcoming version of the page.

From the ‘historical balance’ screen, you can easily generate an activity alert for any UNI address. For instance, choose to get notified when a large holder decides to dump their UNI or begins to accumulate even more.

4. Claimed UNI tracker

Provides a detailed overview of claimed UNI tokens.
This block features a number of dashboards dedicated to the current status of claimed Uniswap coins. The dashboards include:
- Total amount of UNI claimed
- Percent of UNI claimed
- Total UNI claimed by historical user addresses
- Total UNI claimed by historical liquidity providers
- Top UNI claimers in the past 24 hours
This block also features a number of time-series charts, including:
- Total amount of UNI claimed (intraday)
- Total number of claims
- Total amount of UNI claimed historical liquidity providers
- Total number of claims by historical liquidity providers
5. ETH transaction fee distribution (per asset)

Breaks down daily transaction fees (in ETH) per asset.
The UNI launch has positively clogged the Entereum network in the first 24 hours, skyrocketing the average daily transaction fees to $11.6.
This dashboard tracks the amount of ETH spent on transaction fees per asset in the past 7 days, allowing you to identify the biggest ‘gas guzzlers’ at any time.
Check out all our new Uniswap metrics live on Sanbase!