Fascinating Social Interest Comparisons to Keep an Eye On!

With one week of 2022 in the books, crypto market caps have been shrinking quite rapidly. Whale behaviors and on-chain fundamentals haven't been looking so hot, as we've shown in several of our recent videos on our YouTube channel.
But during these down times, it's often easy to forget that social sentiment plays a major role in how and when things will turn around. Our Social Trends page can be a very valuable resource to see where the crypto community's interests lie. Particularly when there is a major uptick in traders looking to buy the dip or short.
Below we've shared a few compare tools that are very interesting to keep an eye on right now, as they may play a key role in signaling when markets are ready to turn positive again:
Crypto vs. Gold vs. S&P 500
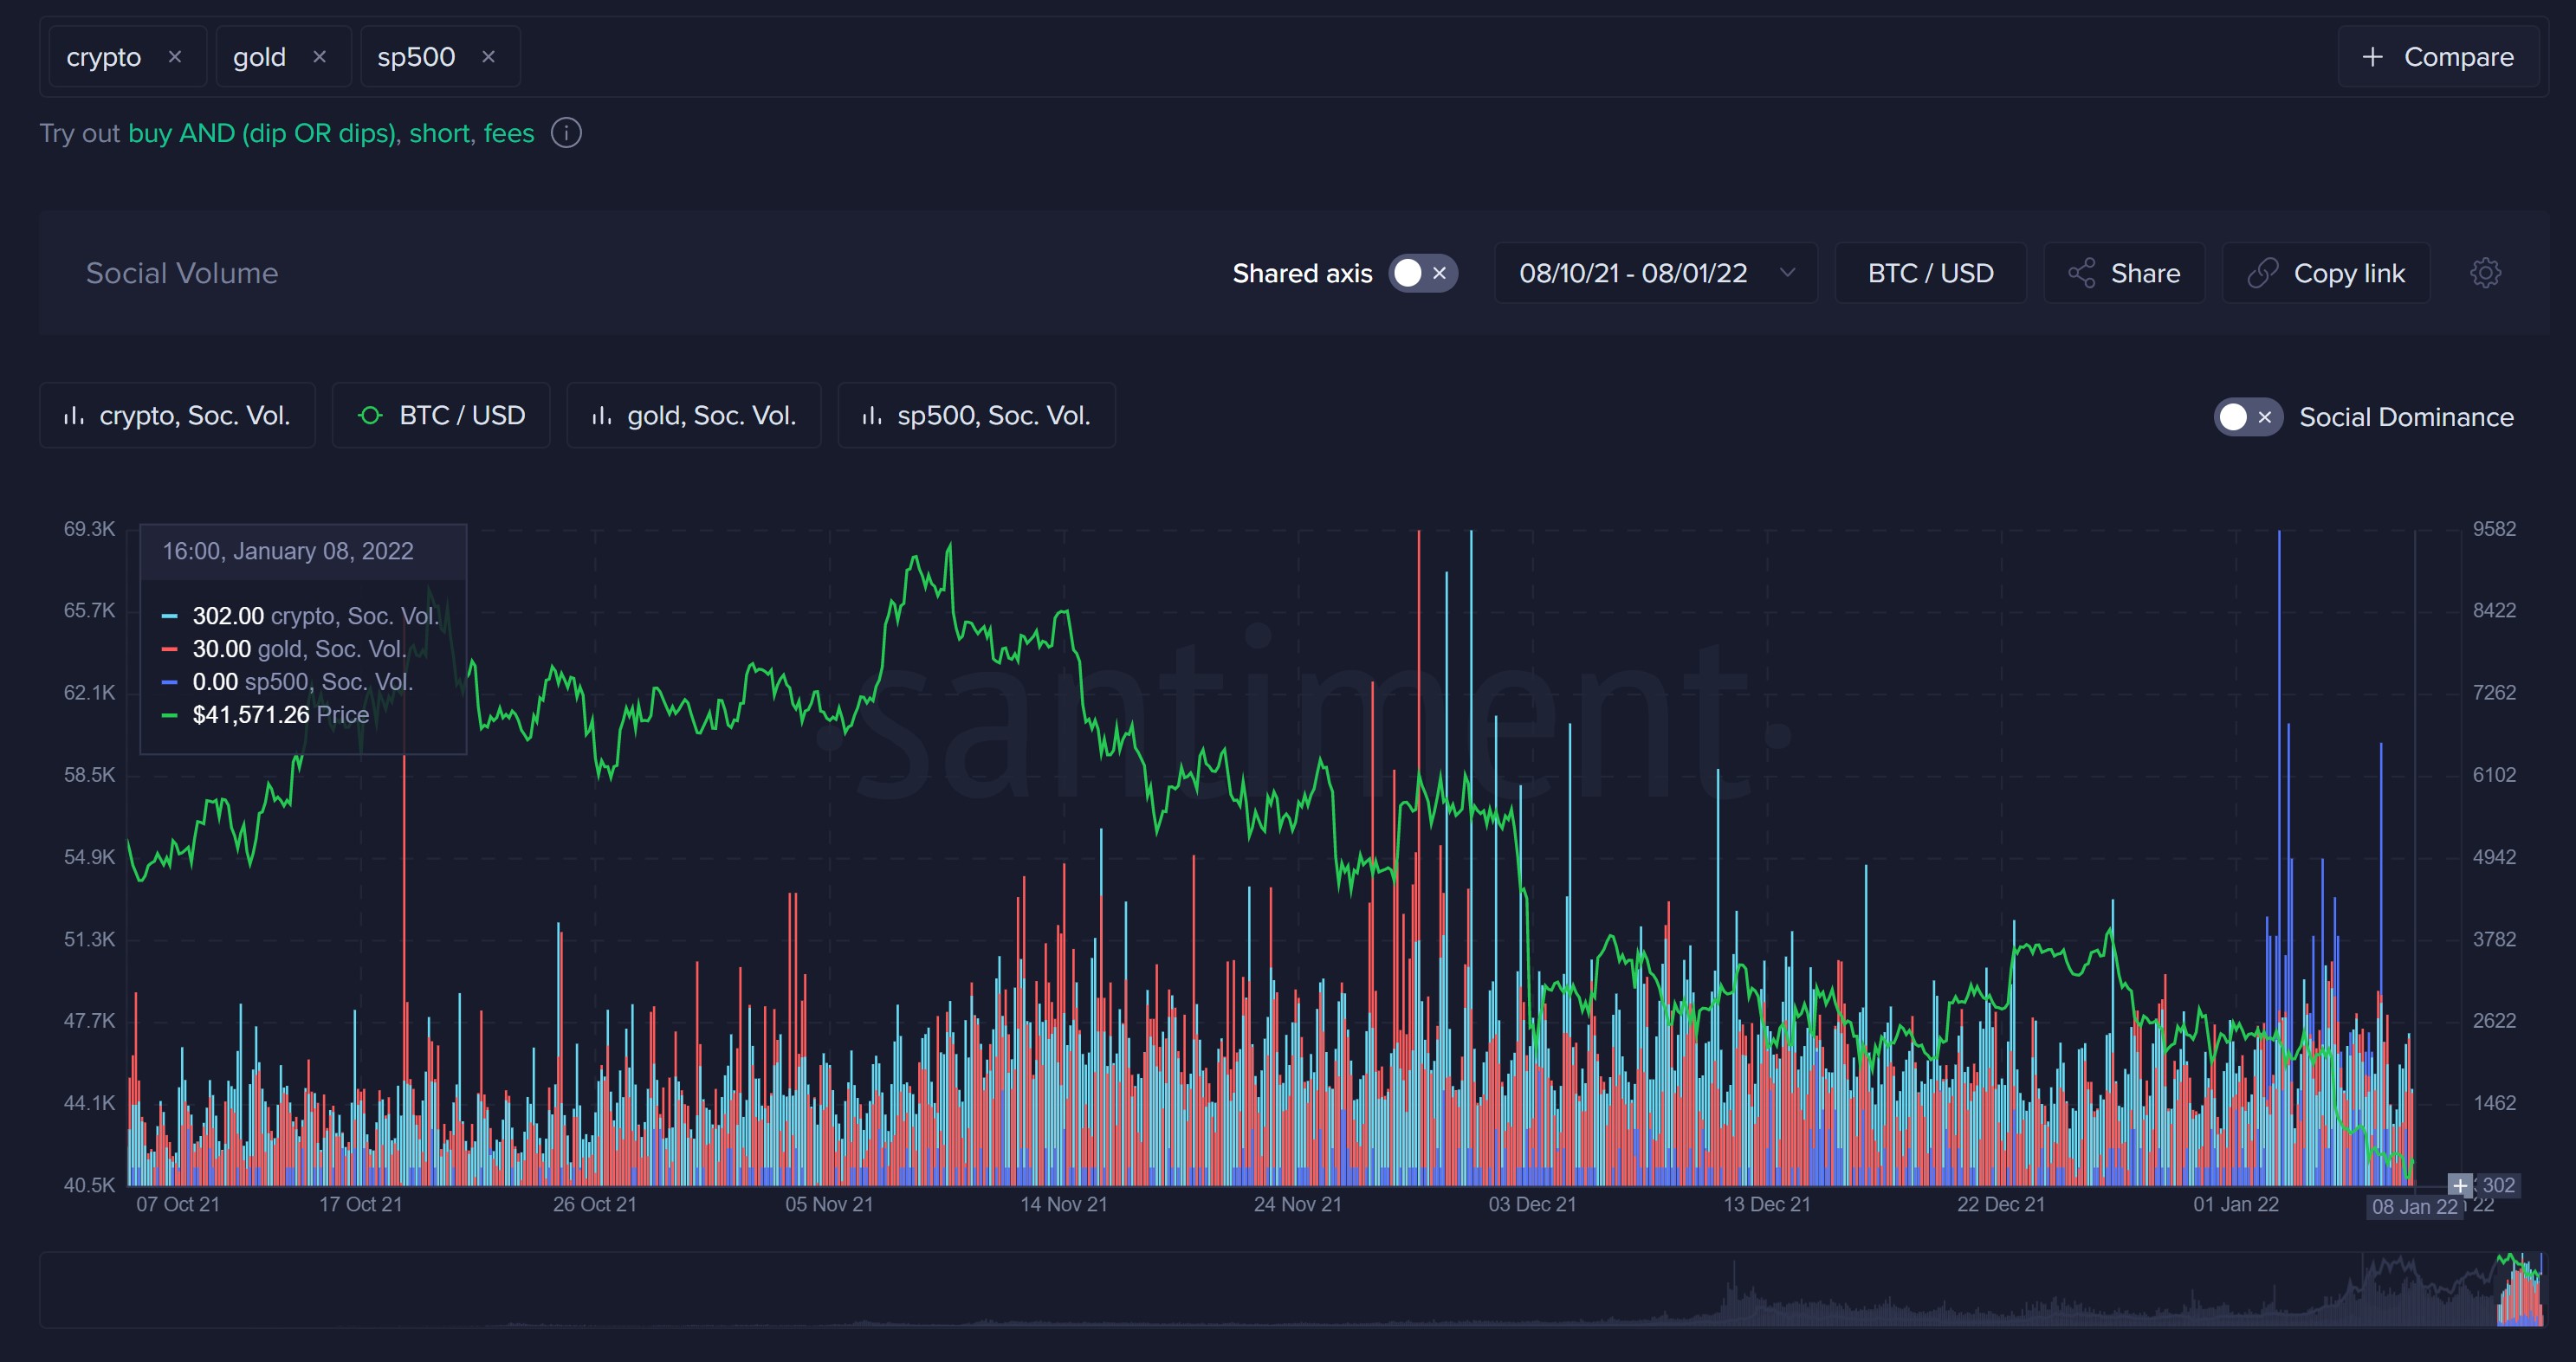
The above chart measures the frequency of crypto, gold, and the S&P 500 are mentioned on crypto social platforms. Note that this chart (unliked the rest we'll be sharing below) is not using a shared axis between the variables, so it's easier to compare gold and S&P 500 to the much larger and more commonly discussed crypto, which would otherwise dwarf the others.
What is interesting is the spikes in gold mentions (in red) at the end of November, 2021, just before the major one-day crypto plummet on December 3rd. Additionally, look at the major spikes for the S&P 500 (in dark blue) just before crypto prices plummeted at the beginning of the week.
This is, of course, a small sample size that we see above. But we're seeing a bit of a causation correlation, indicating that when the crowd on crypto platforms begins showing major interest in other major sectors like precious metals or traditional stocks, crypto seems to fall shortly after. This could just be a recent pattern, but we'll certainly be analyzing this more!
Bitcoin vs. Altcoins

If you're on crypto Twitter, Reddit, or another social media forum, you likely hear all the time about Bitcoin's dominance vs. the rest of the market. It's often quite valuable to see instead how the actual discussions related to altcoins (via a combination search of altcoin, altcoins, alt, or alts) match up against the searches of btc or bitcoin.
What's valuable about this particular chart may not seem initially apparent. Bitcoin is expectedly talked about far more often than the general topic of altcoins. Even if there may be a particular altcoin, eg. Solana, that suddenly takes off and gets a lot of hype, this won't really suddenly show that altcoins are more popularly searched than Bitcoin. At least not any time soon.
HOWEVER, maximize the above image and really look at the times when altcoin searches (in red) are are seeing a bit of an uptick above the faint black line. Notice how on the notable upticks in altcoin discussions, the price of Bitcoin (green line) tends to correct. This could very well be because altcoin euphoria is usually occurring when those altcoin spikes occur, and Bitcoin often punishes major altcoin runs by correcting its own price, plummeting alts even further down.
Keep this chart in mind as a potential altcoin profit taking indicator.
Omicron vs. Covid/Corona
The corona virus (COVID) has been part of the world's consciousness for nearly two years now, and it has been an interesting ongoing story to see how the relationship of the largest pandemic in arguably a century has impacted cryptocurrency's prices. We of course know about Black Thursday, which occurred in March, 2020, sinking prices spanning across the vast majority of sectors including cryptocurrency. And we also know about the 1 year, 8 month crypto bull run that ensued following the initial panic traders had over the pandemic.
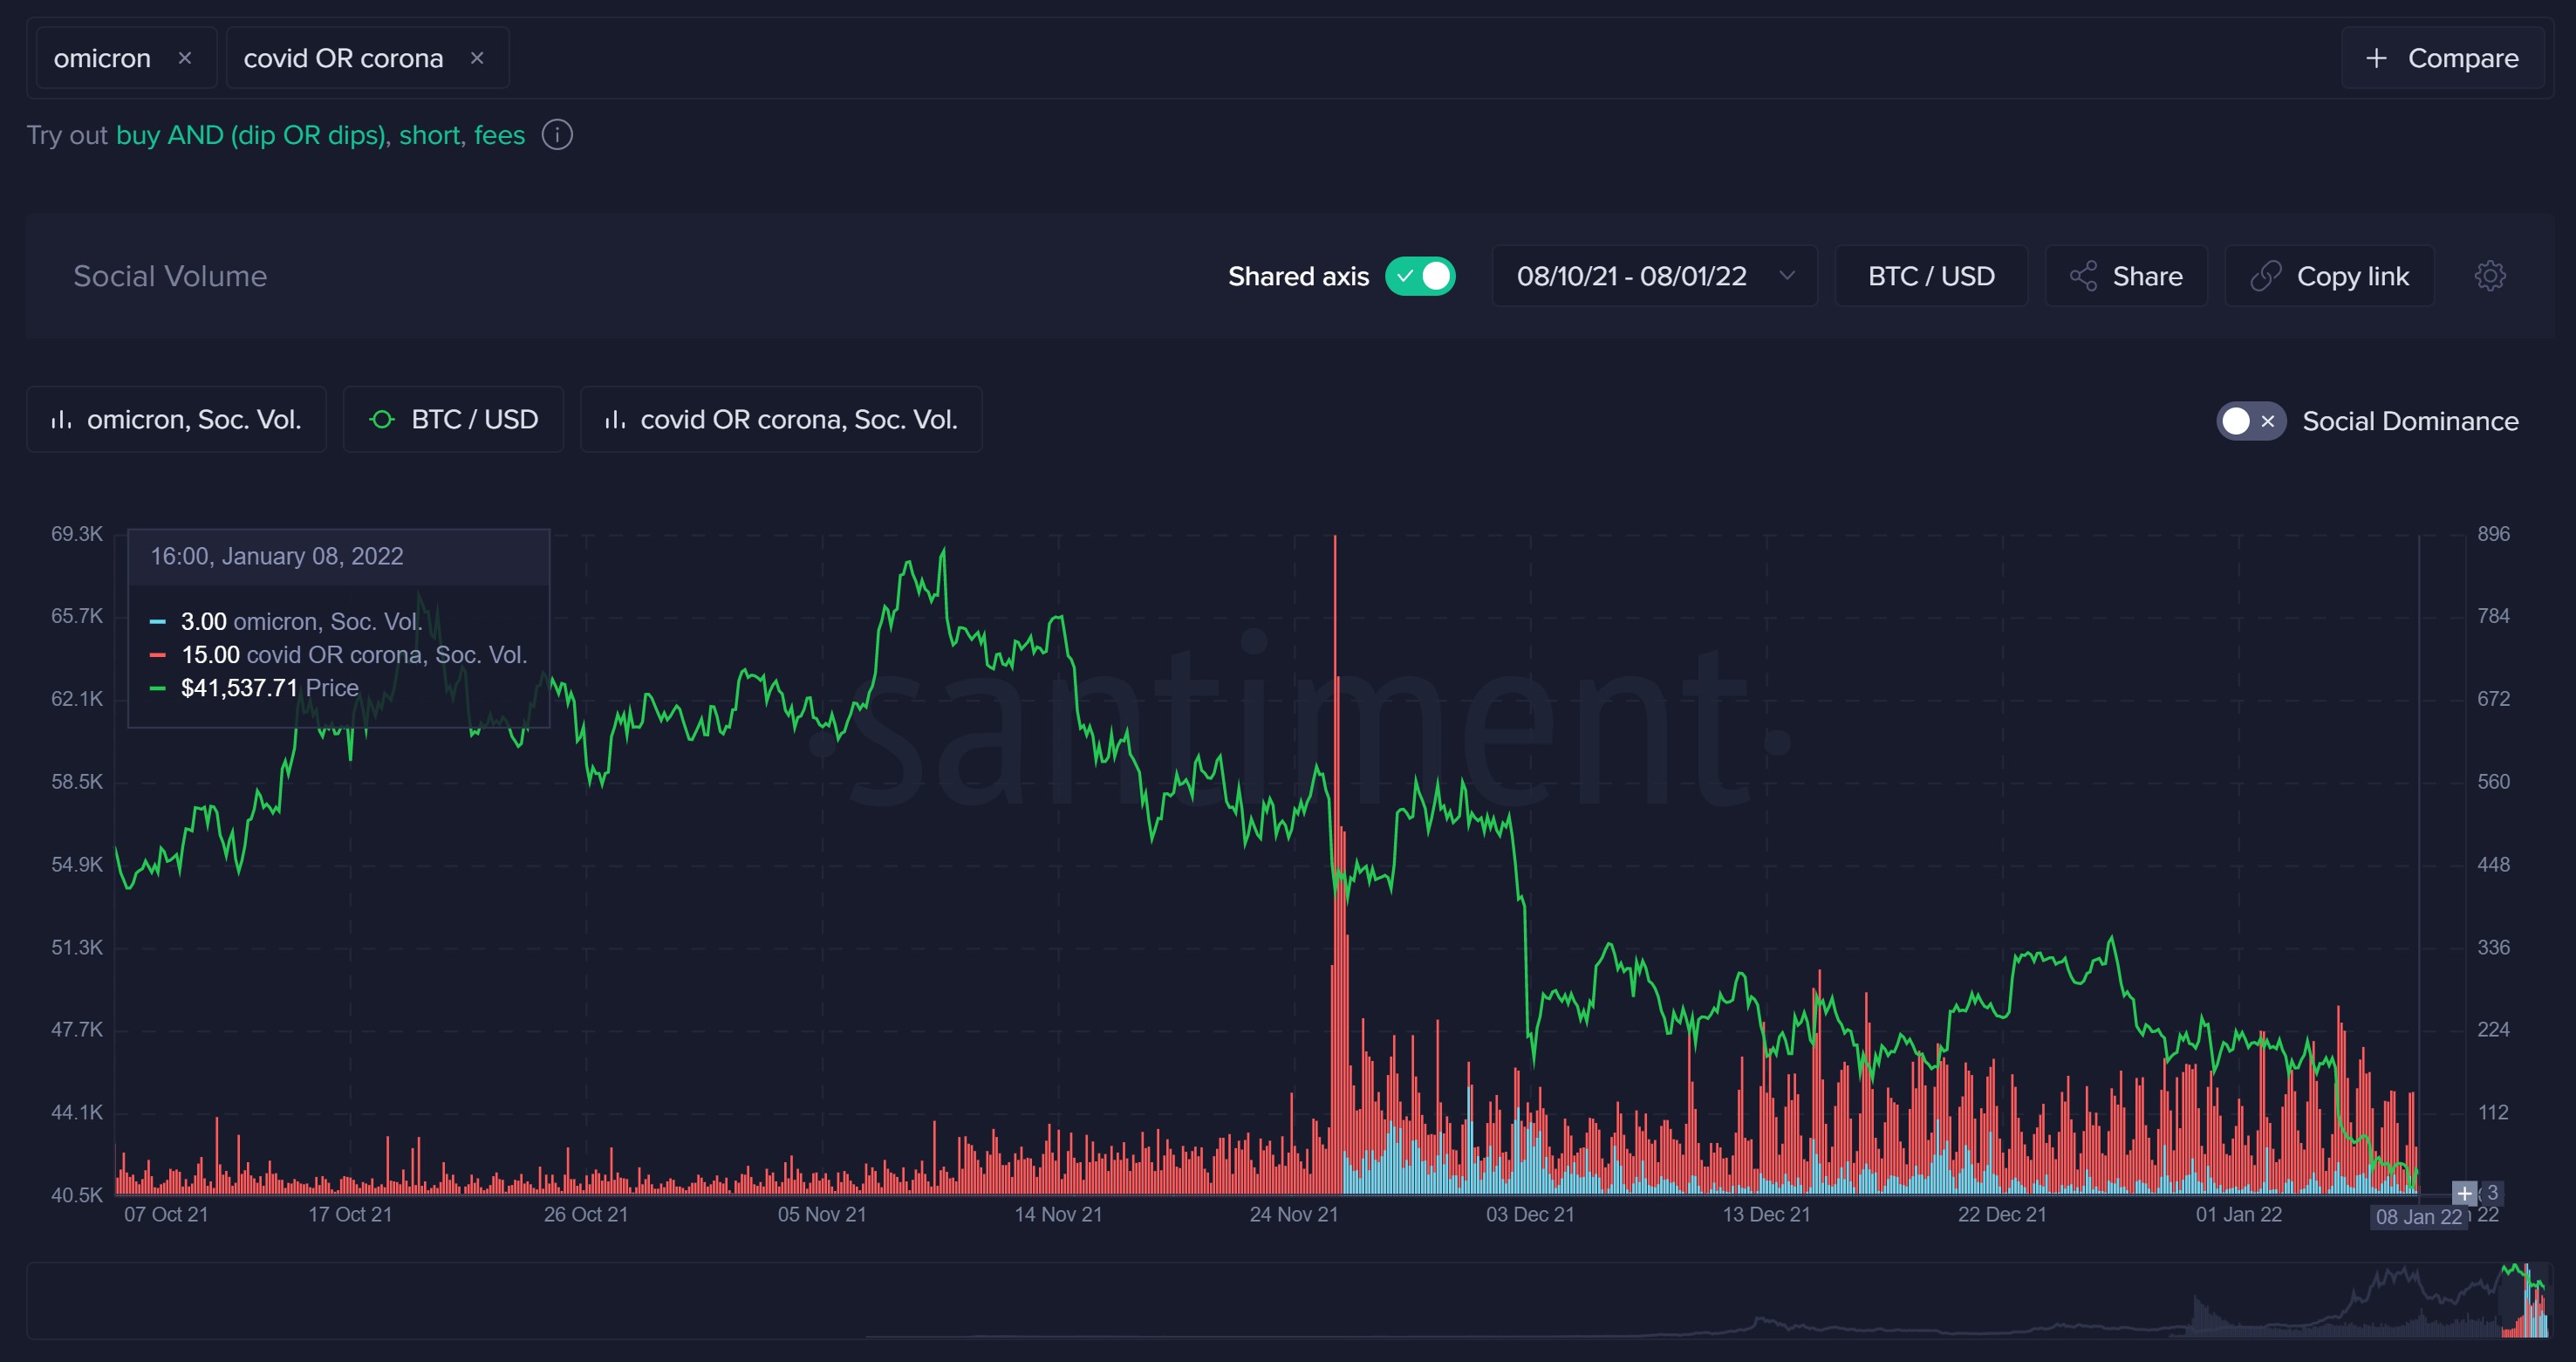
But with COVID not going anywhere, and the omicron variant introduced about 6-weeks ago, how has the pandemic been impacting prices more recently? Well, we clearly see the moment that pandemic fears were renewed, which came simultaneously with omicron being introduced to the crypto crowd. Since the spikes happened in late November, there has been an increased focus on the pandemic, which makes sense as global cases have risen.
Interestingly, the pandemic appears to be brought up more often directly following a price dump. This appears to be reactionary, as traders look for explanations as to why prices are dumping with each negative price wave. Look for lowered social interest in both COVID and omicron as a sign that fears are easing.
Disclaimer: The opinions expressed in this report are for general informational purposes only and are not intended to provide specific advice or recommendations for any individual or on any specific security or investment product.
Conversations (0)