Ethereum correction may be around the corner

Assets covered: Ethereum (ETH)
Metrics used: Daily Active Deposits, Deposit Transactions, Social Volume, Trading Volume, Transaction Volume, Active Addresses, Funding rate.
After weeks of observing a set of key metrics we finally start getting initial signs of Ethereum's top.
Concerning signs
Daily Active Deposits + Deposit Transactions
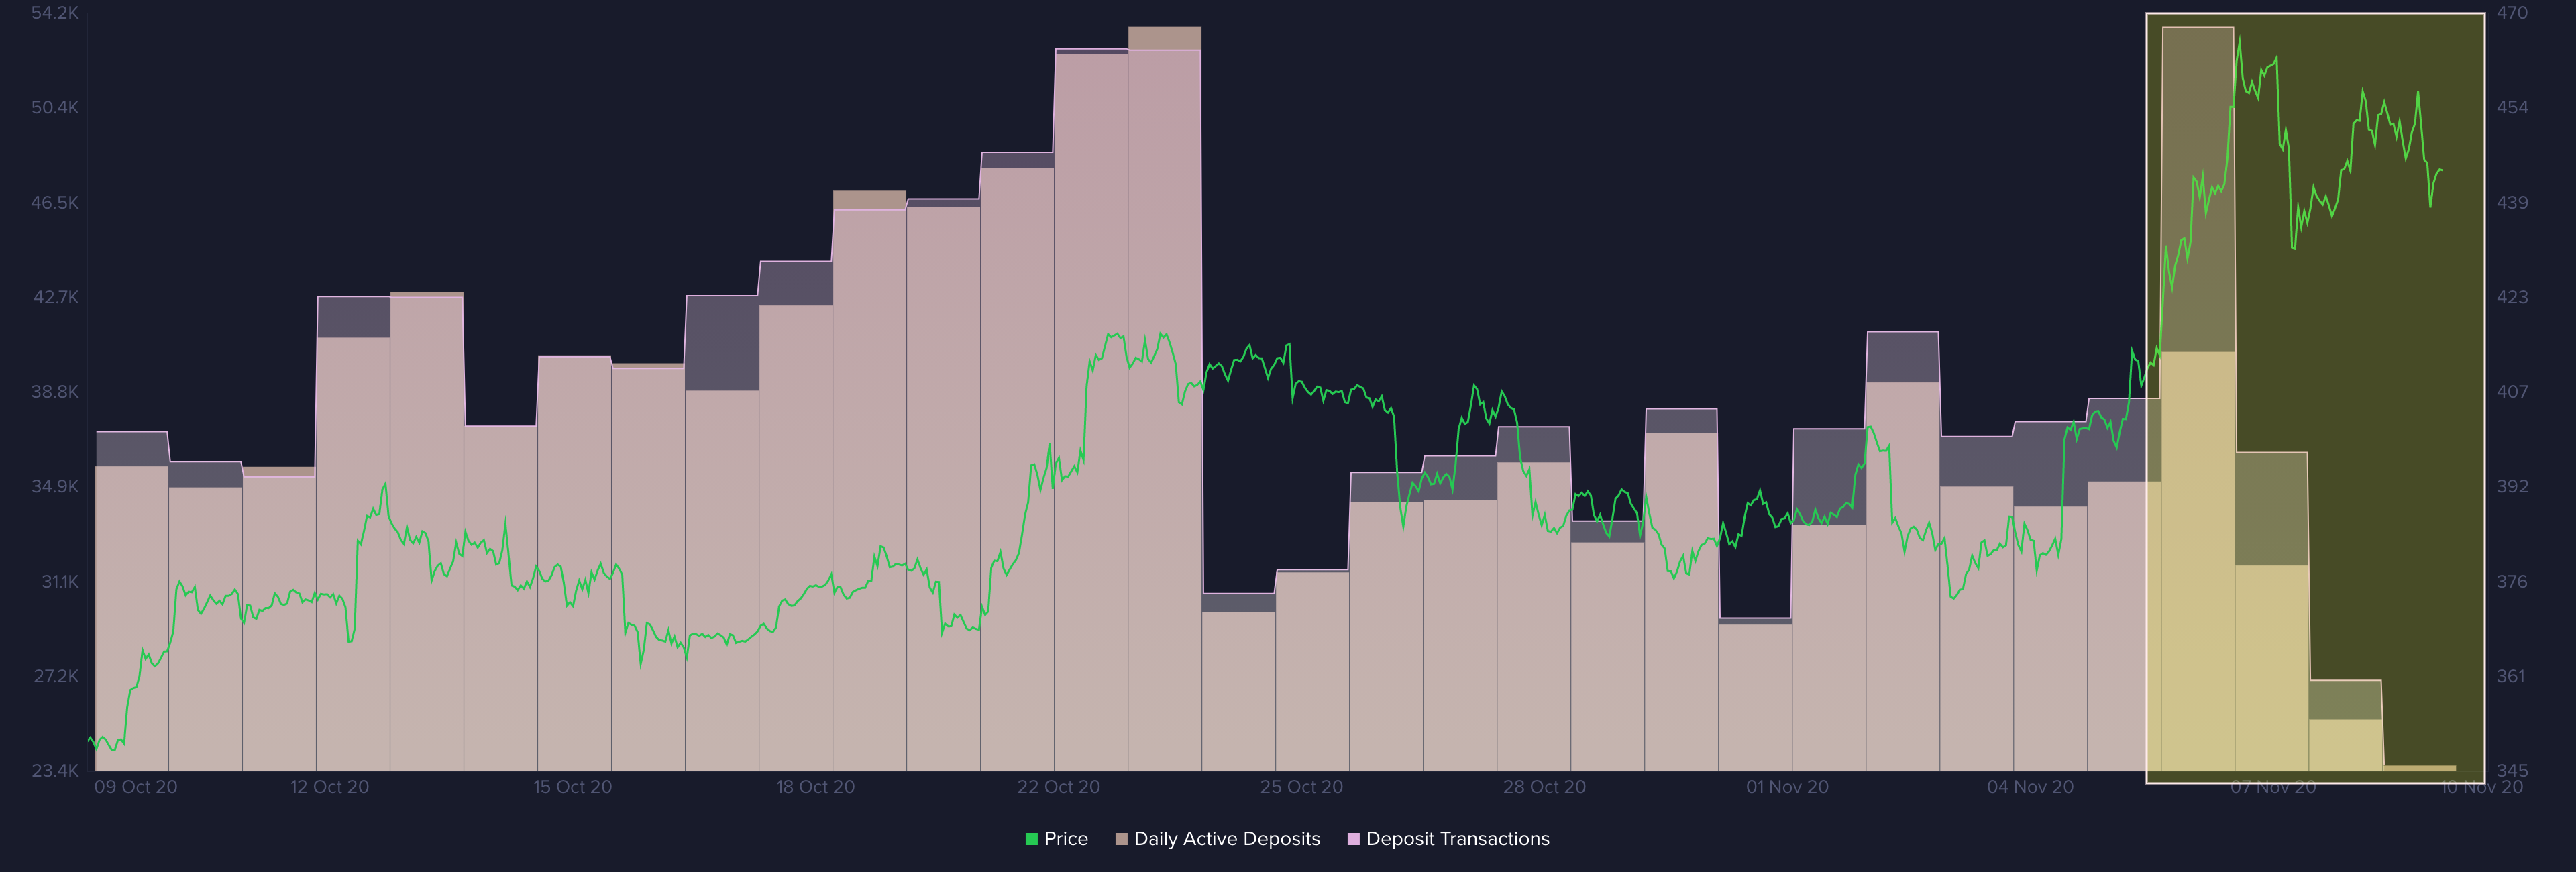
If people would be concerned and saying "Ok, may be ETH can go down", they would do volume and amount of deposits pretty high (even on Sunday). In fact it's super low. Really really low. Like "Nah, I don't care". A smart investor should!
There is no increased level of fear. But it was Sunday and that's the problem. We would wait for at least one more day. Because ETH looks like it tries to break to the top, so we'll see if it manage to do it.
Social Volume + Trading Volume

Both volumes are declining, starting to form a divergence with price.
Onchain activity (Transaction Volume + Active Addresses)

Same worrying trends here.
Funding Rate:

Perpetual contracts funding rate became dangerously positive all over exchanges. It indicates a strong crowd bullish sentiment.
It looks increasingly toppish. We would not hold a long position.
Good signs

Summing up
We can see bearish signs.
Because:
- We moved to positive funding rates (people turning bullish)
- We start seeing lack of worrying (when we should be worried).
Stay alerted. We might wait one more day, just to make sure data is not Sunday related.
But at last it starts looking really toppish for ETH.
There are more concerning signs in other metrics. This insight in focused specifically on a few most important.
For reference: a detailed report on BTC.
Conversations (0)