ETH Pulls Back Again: Here's What to Look For

With today’s market-wide pullback, all eyes are once again peeled on the top 2 coins by market cap and their near-term potential. Another bear trap or a sign of things to come?
Let's check in on the coin's latest fundamentals, including its on-chain and social activity data - all available on Sanbase Pro.
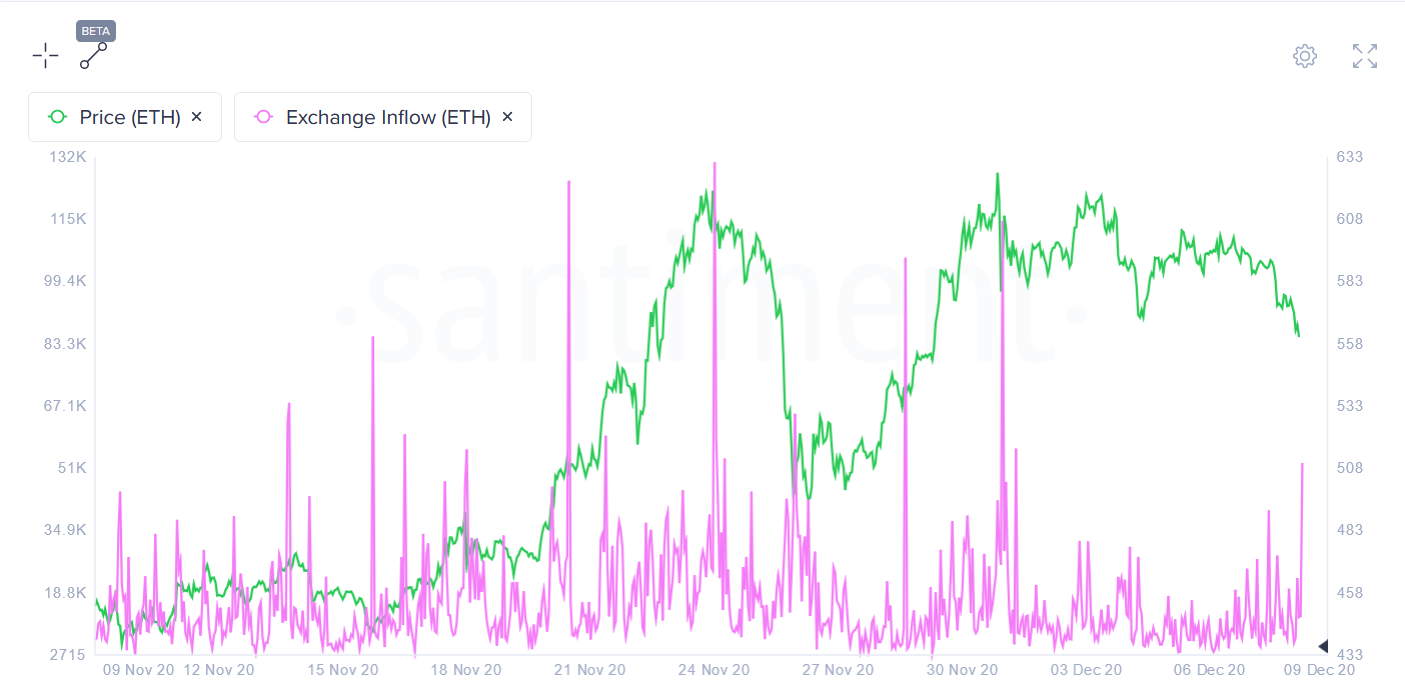
With ETH’s latest drop into the mid-$500s, early signs of holder anxiety may be emerging in the coin’s on-chain data. As expected, Ethereum’s 1hr exchange inflow has been on a sharp uptick since the price drop, with more than 52400 ETH just moving to known exchange wallets - a week high:
This type of rise in exchange-bound activity has a tendency to signal short-term capitulation and ‘weak hand’ exodus, as ETH holders become increasingly worried about a sustained
There’s more of this Insight
Choose your subscription plan
Years of market experience, compressed in each report
Since 2017, Santiment has been an industry leader in on-chain data, social intelligence and behavior-based analysis of the crypto market.
Our tools have a proven track record of timing price tops for cryptocurrencies, helping traders find profitable exit points and mitigate HODLing risk.
Our previous TOP calls:


What you get with Sanbase Pro:
- Members-only daily market insights and analysis
- 30+ on-chain, social & project indicators for 900 cryptocurrencies
- Custom alerts for the coins' price, on-chain & social trends
- Santiment Spreadsheet plugin with 10+ pre-made market templates
- Personalized asset watchlists and weekly performance reports
Gain unfair advantage with Sanbase Pro
Subscribe to Sanbase Pro for access to exclusive insights, market-beating metrics, strategies and templates!