ETH - How's it going now?
Assets covered: Ethereum (ETH)
Metrics used: Price, Supply on Exchanges, Network Growth, Daily Active Addresses (DAA), MVRV 7D, Network Growth
Chart: https://app.santiment.net/s/2rBVMrr9
Following up on our previous ETH post, let's take a look at how ETH is doing.
Price

ETH did manage to bounce off the $2,800s since our last ETH post, but it is still struggling to break the resistance at $3,100s.
The price action so far since the start of the month is showing that ETH's been pretty much operating in a downward channel, consistently making Lower Highs, and Lower Lows - which isn't the best action so far.
That said, things have come to a stall over the past week as it clings on to $2,800s, bouncing off it and working in the upper boundary at the moment (which is a good thing so far).
Volume is still remaining healthy and the monthly close is happening soon, a breakout to the upside from the channel would really help to change the course.
The action in the next few days will be one to watch.
Supply on Exchanges

ETH Supply on Exchanges continues its downward trend as it took sharp dips over the past two weeks regardless of the price action, and is now hitting its lowest in the past 6 months.
Looking good so far, as it indicates that market participants are shifting to accumulate and HODL mode where possible.
Network Growth

Overall, ETH Network Growth remains stagnant over the past few months as new participants venture into other L1s.
Daily Active Address

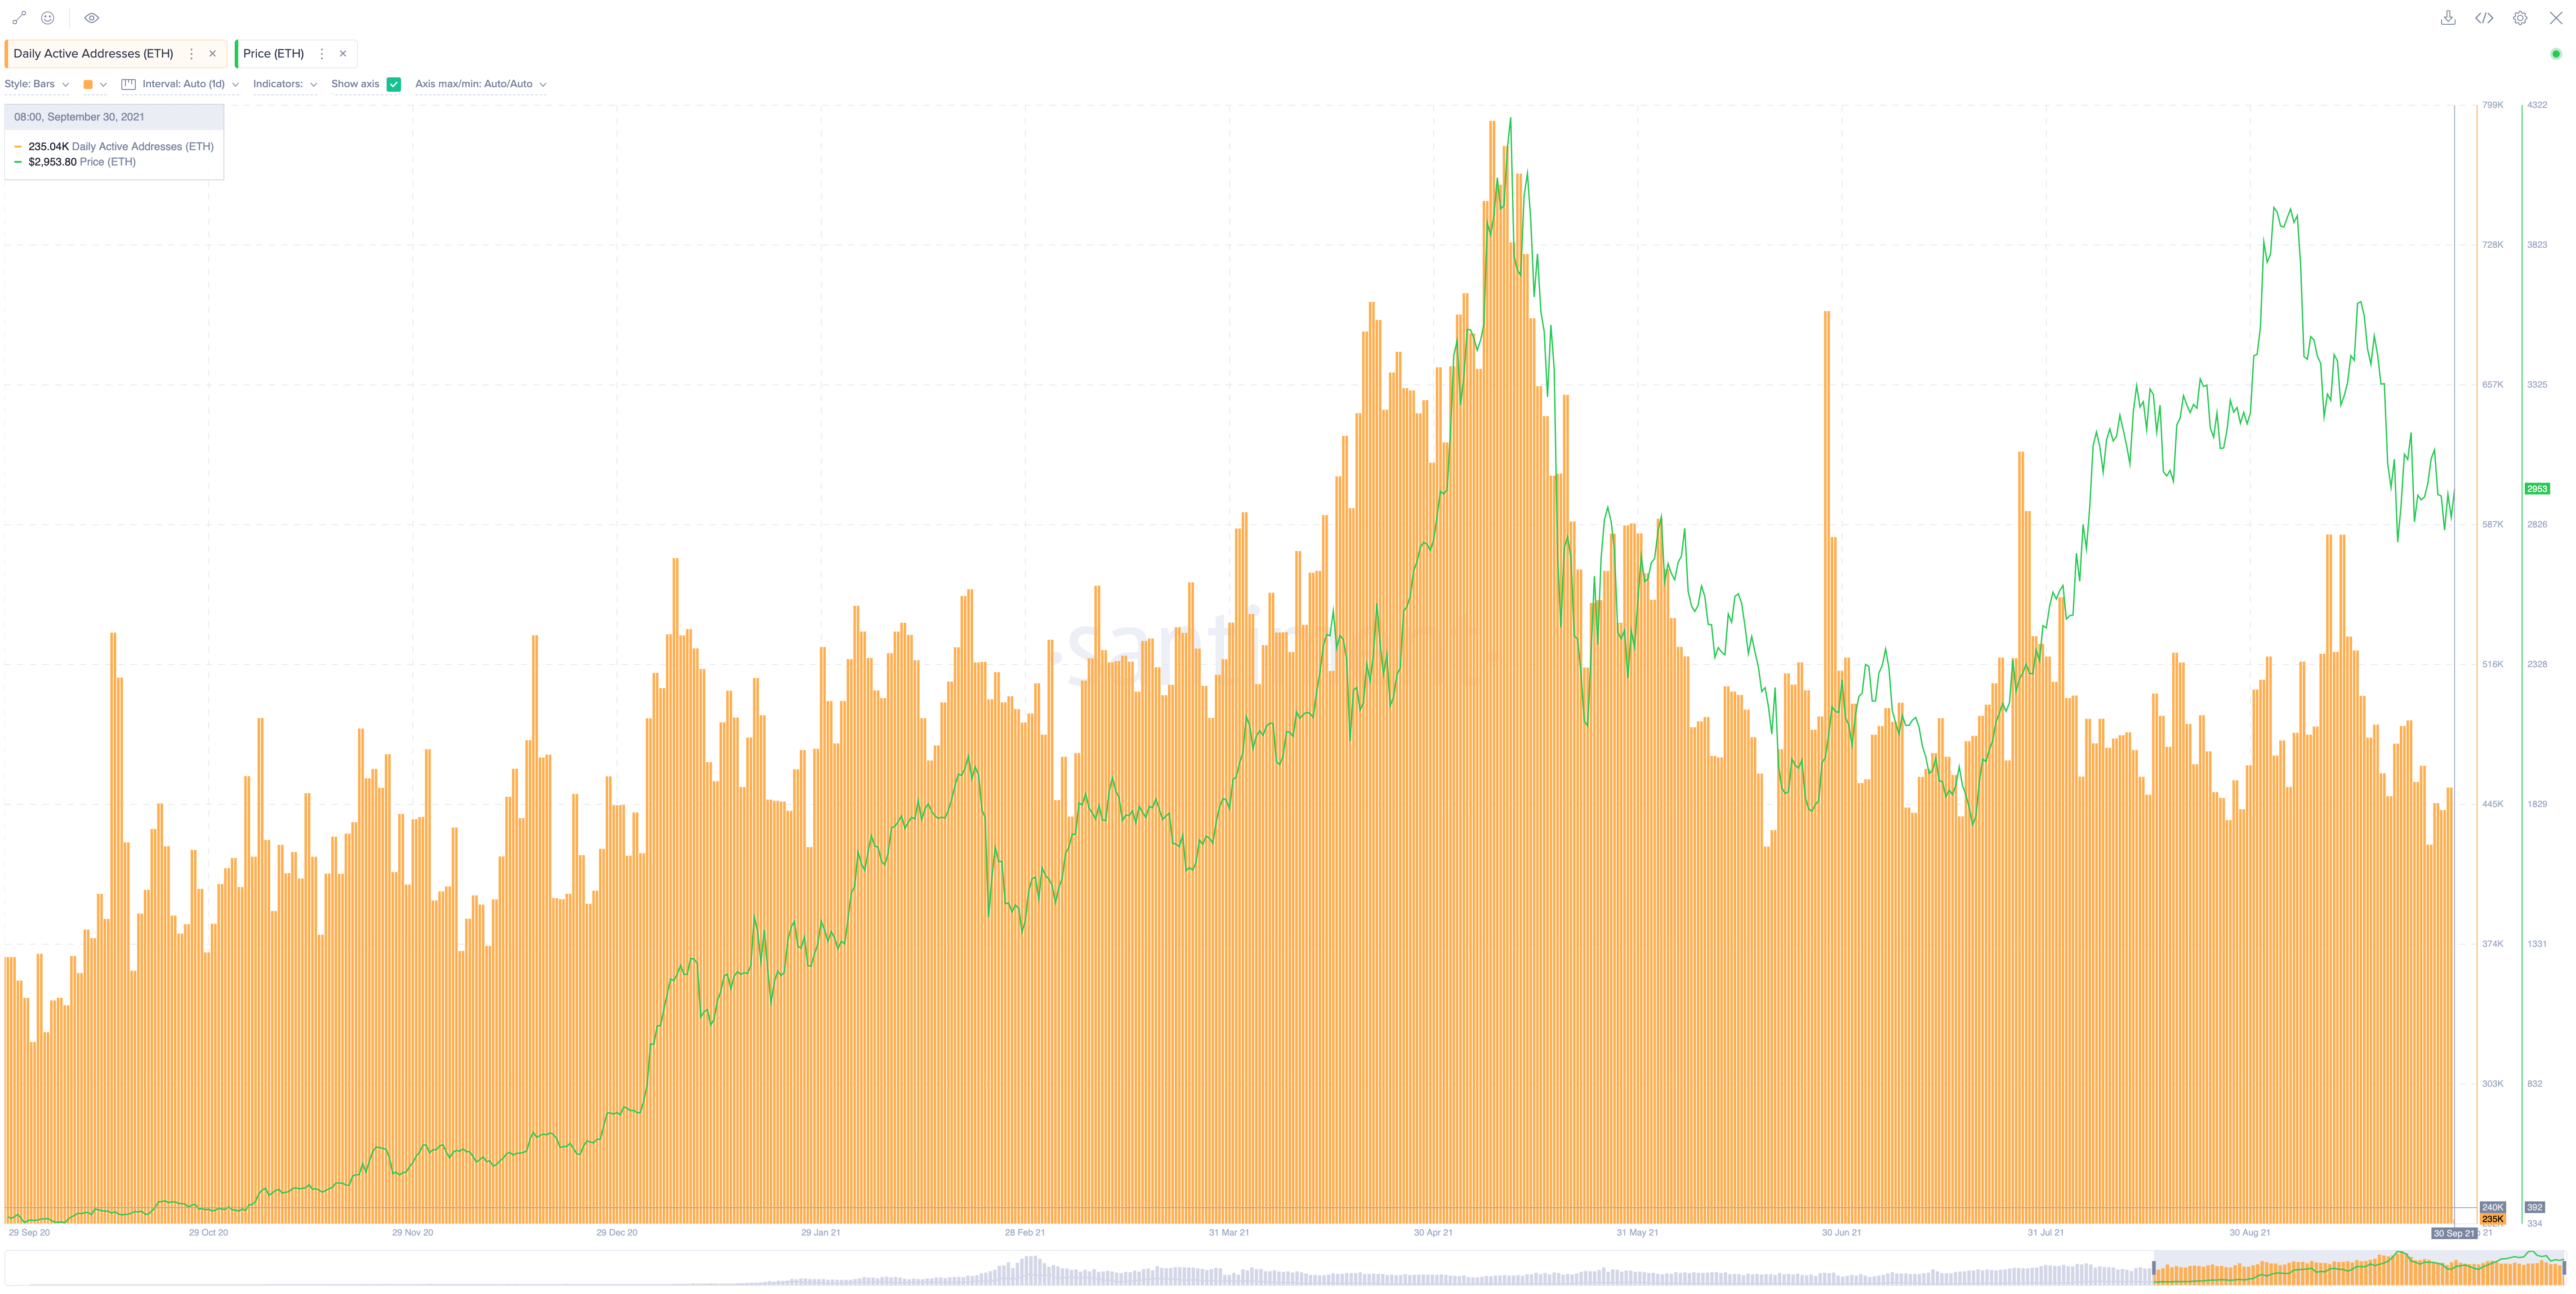
ETH's Daily Active Addresses continue to remain strong over the past 6 months.
Social Volume

ETH Social volume continues to decline since late July as Ethereum interest wanes as most of the crowd have gone on to other L1s for speculation.
The only exciting event was EIP1559, which went live in early August , hence the spikes in ETH mentions but it was all downhill since and likely to be so until some significant event happens. Whether it's a price rally or as we get closer to ETH 2.0.
MVRV 7D

ETH's MVRV 7D which measures the short-term profit/loss of holders is showing that we still have some room to go before we hit the danger zone (marked by rectangle)
Disclaimer: The opinions expressed in the post are for general informational purposes only and are not intended to provide specific advice or recommendations for any individual or on any specific security or investment product.
Thanks for reading!
If you enjoyed this insight please leave a like, join discussion in the comments and share it with your friends!
Never miss a post from Sanfam!
Get 'early bird' alerts for new insights from this author

Conversations (0)