ETH - A bounce finally

Assets covered: Ethereum (ETH)
Metrics used: Price, MVRV 7D, Supply on Exchanges, Daily Active Addresses, Network Growth, Social Volume
Charts: https://app.santiment.net/s/x7JR-w-H
Majority of the market's been on a downtrend as we head into the FOMC meeting, now that it's over, let's take a look at how ETH is looking.
Price

Supply on Exchanges

Over the past few days, we are seeing large spikes in ETH supply on exchanges, suggesting that a decent amount of sell pressure is looming.
Looks like sellers are using every price pump to exit their positions where possible (especially if they missed a chance to sell previously). Are we clearing out the weak hands?
MVRV 7D

ETHs MVRV 7D which measures the short-term profit/loss of holders is showing that we are in the danger zone, as all short-term holders are in the profit at the moment - Which could incentivise them to take some profits.
Network Growth

ETH's Network Growth is seeing some divergence, as price drops, we are seeing increase in Network Growth, which is kinda unusual. Could this be a sign of cautious (those that don't FOMO during price rises) new participants finally entering?
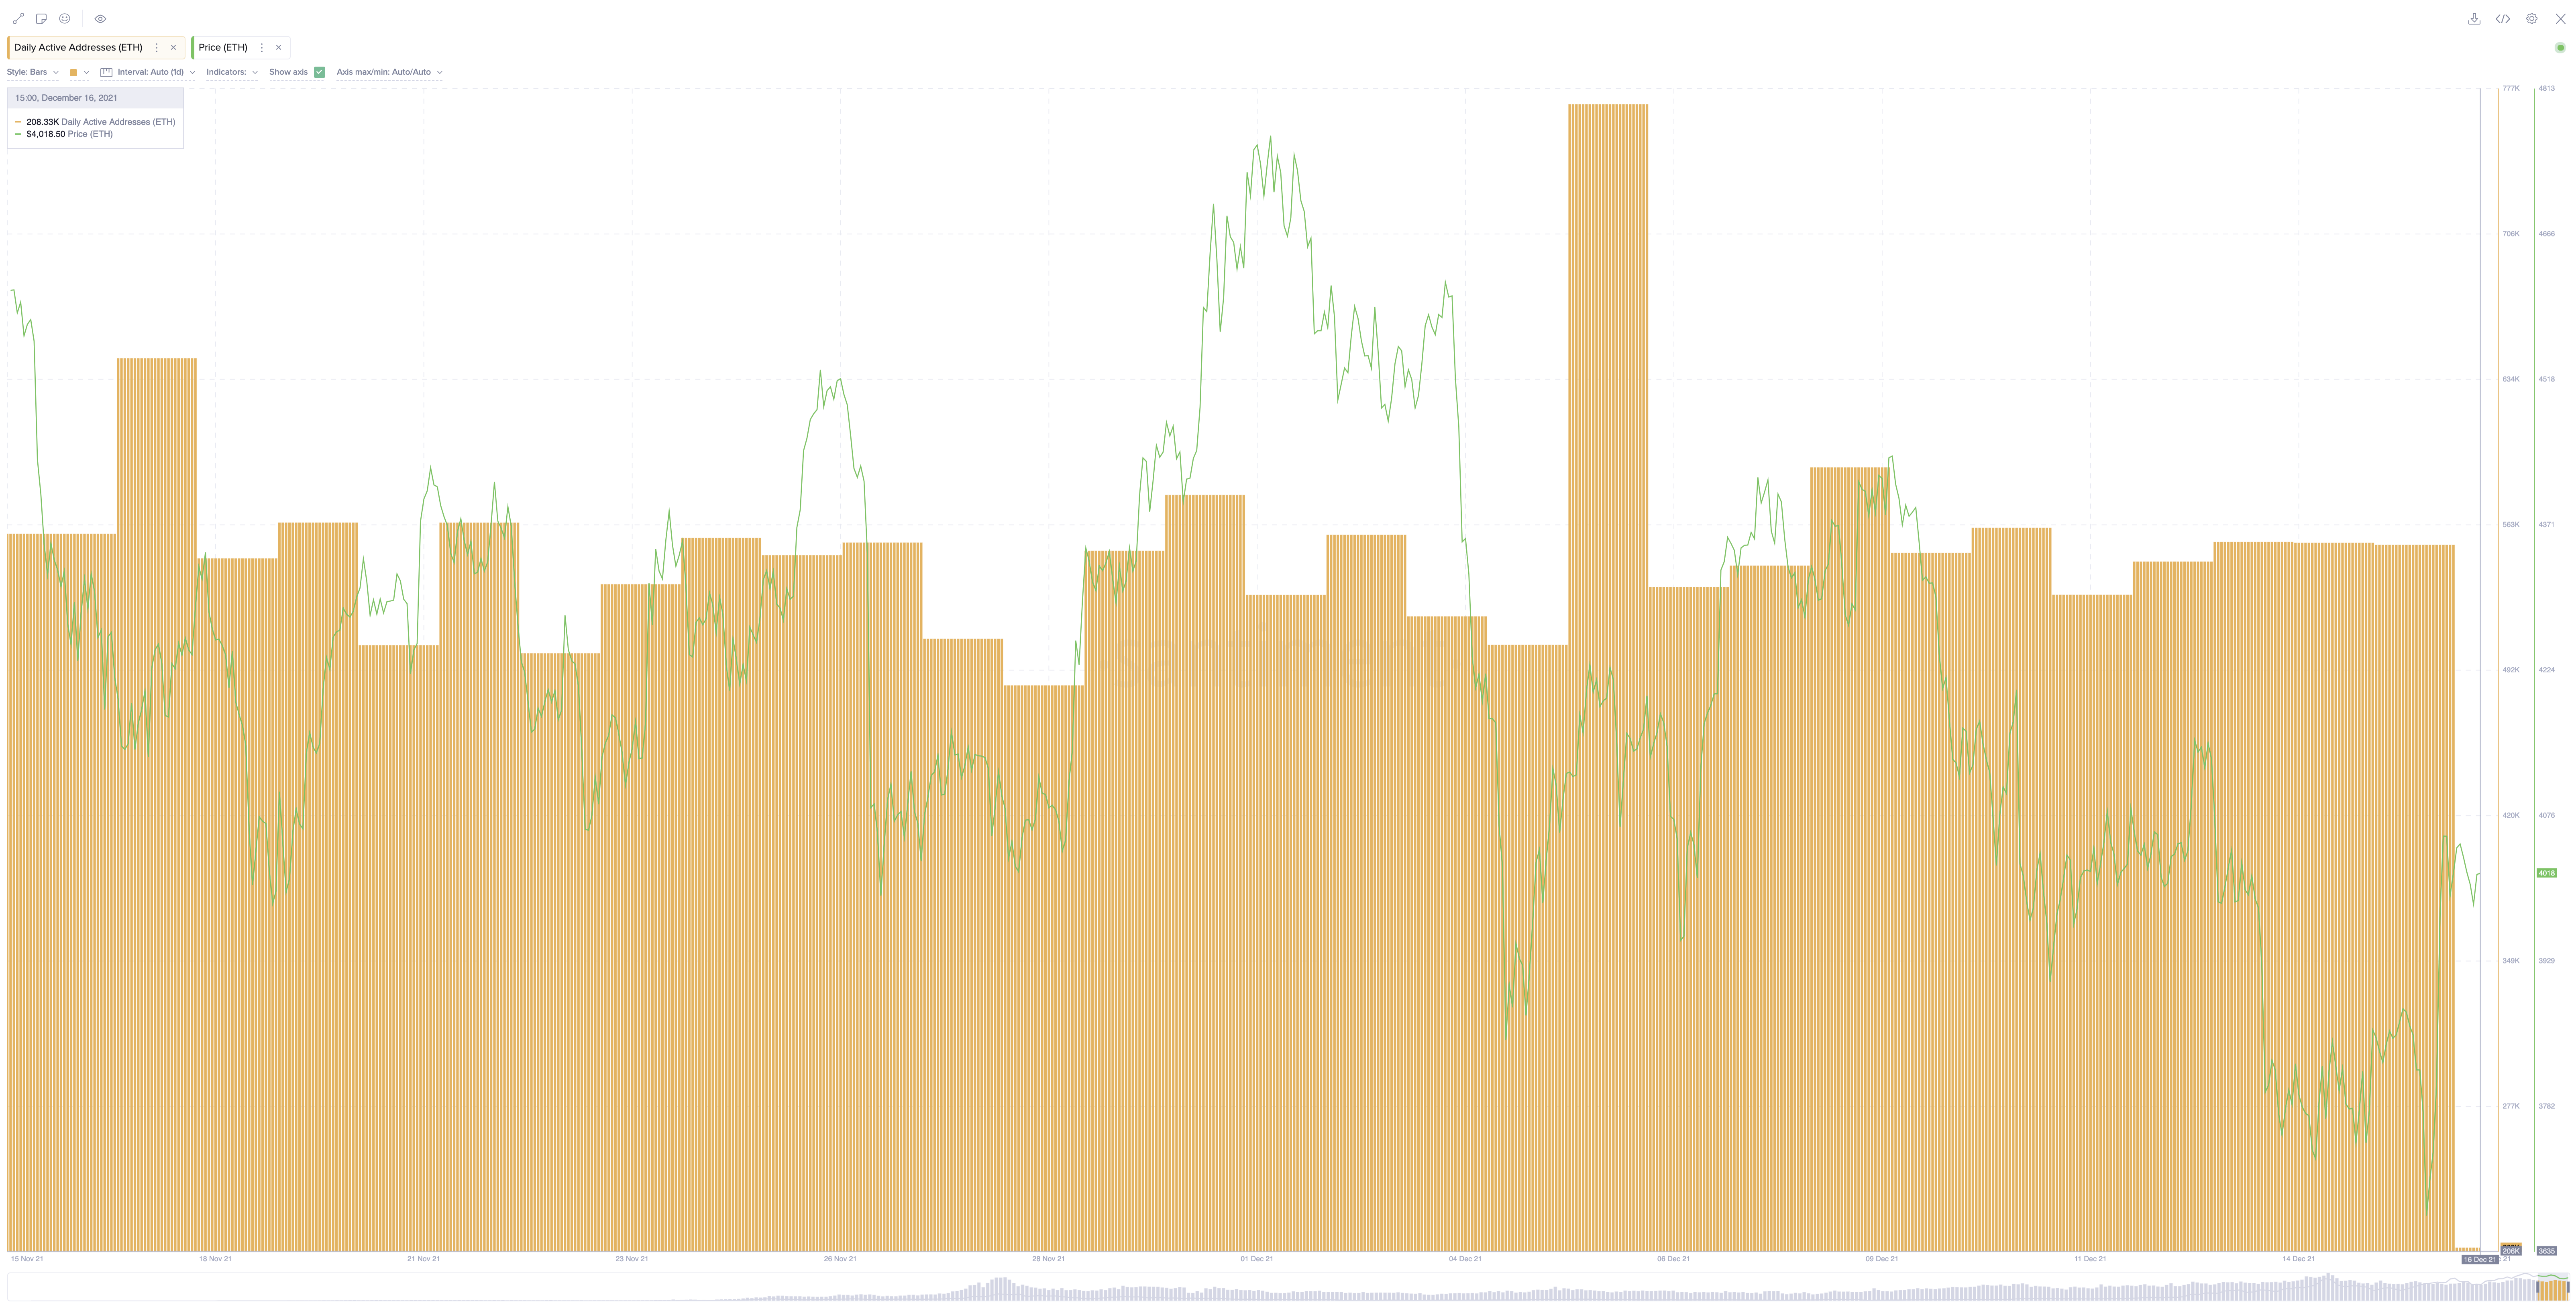
Daily Active Addresses (DAA)

ETH's Daily Active Addresses remain healthy looking, network is still very much active regardless of the price action we are seeing. Good sign so far.
Social Volume

The number of "ETH" mention remains pretty consistent over the past month, showing no real strong interest for now. Which is a good thing, as the crowd is either leaving ETH or just not that interested, by the time they are, it's probably when ETH's price pumped to a level that is nearing a local top.

Conversations (0)