
ERC-20 Network Growth: An Analysis Before and After Black Thursday

Network Growth is a fantastic measure to see exactly what kind of health a project’s network has in terms of new entries. This metric shows the number of new addresses being created on the project's respective network each day. Essentially, it illustrates user adoption over time, and can be used to identify when the project is gaining - or losing - traction.
We can generally see that a rising network growth leads to a rising price of any project over time, in most cases. On the flip side, declining network growth for a long enough stretch can usually indicate a future slumping price with the lack of newly created addresses constantly in-flowing the coin or token.
We will be taking a look at several projects on a 3-month timeline and focus particularly on what their network growth has looked like since Black Thursday. With prices of all crypto projects still down across the board since the historic March 11-12 drop, it is important to look at which projects we are seeing the most and least amount of network growth to determine the short to mid-term likelihood of their prices continuing to recover most rapidly back to their levels before their prices fell off a cliff.
Without further adieu, let’s take a look at...
THE GOOD:
Ethereum (ETH)
Ethereum, the #2 market cap project, has one of the most encouraging network growth patterns since Black Thursday, and has been on a very nice looking growth pattern for the past three months.
Already up 10.4% over the past week alone, we’re continuing to see signs of an upward trend (symbolized by the higher and higher spikes over the past three months on the brown line). Generally, we look for large spikes like the ones we see here, as a clear sign of upcoming price increases.
Status (SNT)

Status has gone back and forth a bit over the past couple months as the community tries to comprehend whether this ERC-20 that consistently makes our top 10 list for highest developed on Github is a legitimate contender for price growth, or if it’s just another sh*tcoin. According to our network growth chart, there appears to be legitimate reason to be excited, with an enormous spike in growth occurring on March 18th, a week after Black Thursday. With this spike came an accompanying price spike that really hasn’t started to retrace until yesterday (ever so slightly).
Regardless, network growth continues to be at higher levels on a daily basis than there it was prior to Black Thursday. And if we continue seeing these levels, there’s no reason to believe prices can’t continue climbing back to its levels that peaked at $0.0248 in mid-February.
Chainlink (LINK)

LINK has had a bit of a rough go of things in terms of price since Black Thursday. Like ETH and REN (brought up later on this list), it had a wonderful February before getting pounded to the ground on the historic correction on March 11th and 12th. However, its price has recovered very little.
In spite of the lack of movement, there were some good signs of network growth that occurred right when Black Thursday happened, followed by some other spikes about a week later. It has been relatively dormant for the past two weeks, however its daily network growth is still occurring at a higher rate than it was when its price first started to surge in January. And it is actually still below those January prices when network growth was lower. So from a divergence standpoint, it’s clear that there is some room to make up for on the upside for this increasingly popular asset.
Now that we’ve taken a look at three good looking network growth charts, to make things fair and equal, we’ll take a look at three projects with concerning looking network growths. Here are...
THE BAD:
Golem (GNT)

Golem’s price took off around February, but went on a steep decline for nearly a month before Black Thursday gave it a steep drop it has yet to recover from. A bad sign is the fact that network growth continues to decline slightly without any significant spikes to show a glimpse of encouragement. It’s up 9.04% over the past week, which is actually a bit under average compared to most ERC-20’s that have really risen rapidly as the markets continue to recover gradually. We will need to see some signs of life from GNT’s network growth chart before suggesting it as anything more than a hold or sell right now.
Ren (REN)
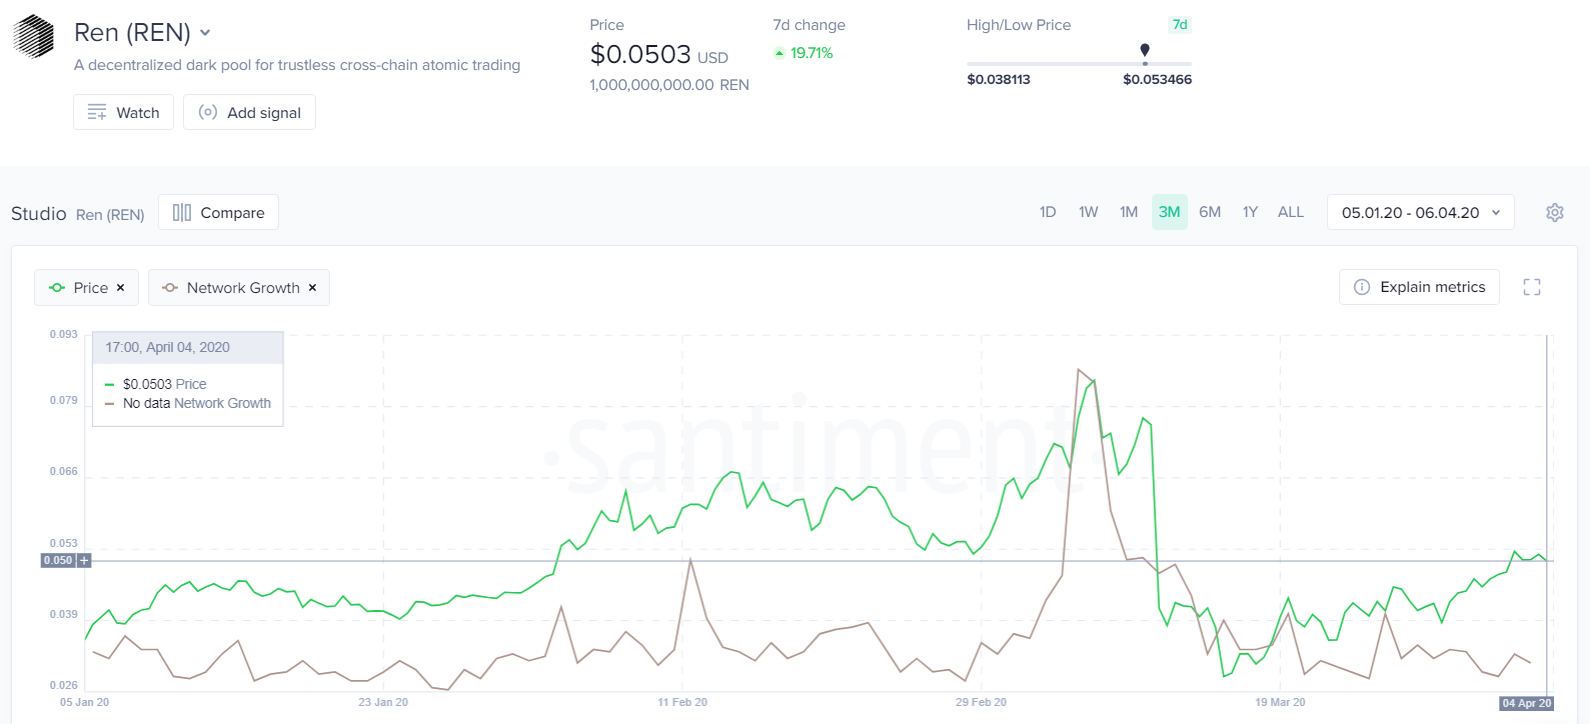
In terms of altcoins, REN was quite the hero in the month of February and even into March. Then, when Black Thursday happened, it was smashed to oblivion more than most projects out there. Though its price has recovered steadily, it still has a long way to go to get back to its peak of $0.084 back on March 7th.
It doesn’t help to see that despite a massive spike right before Black Thursday, the project’s network growth has mostly been on the decline ever since. Seeing this type of divergence between price moving up and network growth going down makes this project, at least for the interim, a decent sell candidate.
Nexo (NEXO)

Nexo has been interesting, with a surprising rise in late January, supported by a huge network growth spike in early February, which propelled it to a high of $0.227. However, it has declined significantly and is up just 6.3% in the past week, which is quite low compared to the rest of the altcoin pack.
Network growth is showing little signs of life, with levels lower than where it was even before it started its late January rise. Until further notice and some blips on the radar with new addresses being created at a healthy rate again, NEXO is looking like a proper sell candidate for the near future.
We look forward to following up to see how network growths change in the coming weeks and months for these projects. Let’s see how these predictions play out, and remember that there are of course multiple factors besides network growth on our platform to dictate the fundamental health of ERC-20’s and others. But in terms of singular price predictors, we stand by this metric as one of the most accurate foreshadowers.
To get complete real-time data and historical values for these projects and 900+ others, make yourself a Sanbase Pro member today by visiting our landing page. Cheers, and thank you for reading!