Charting the Graph. A general overview of GRT

Assets covered: The Graph (GRT)
Metrics used: Social volume, Weighted social sentiment, Daily active deposits, Exchange inflow, Active Addresses, Network Profit or Loss, MVRV, Supply distribution
The Graph is an indexing protocol for querying networks like Ethereum and IPFS. Anyone can build and publish open APIs, called subgraphs, making data easily accessible.
GRT is backed by Coinbase Ventures and a number of smaller funds.
GRT token is used to allocate resources in the network. Active Indexers, Curators and Delegators can earn income from the network proportional to the amount of work they perform and their GRT stake. Indexers earn indexing rewards (new issuance) and query fees, while Curators earn a portion of query fees for the subgraphs they signal on. Delegators earn a portion of income earned by the Indexer they delegate to.
Let's see where the Graph is according to Santiment social and onchain data.
Social volume
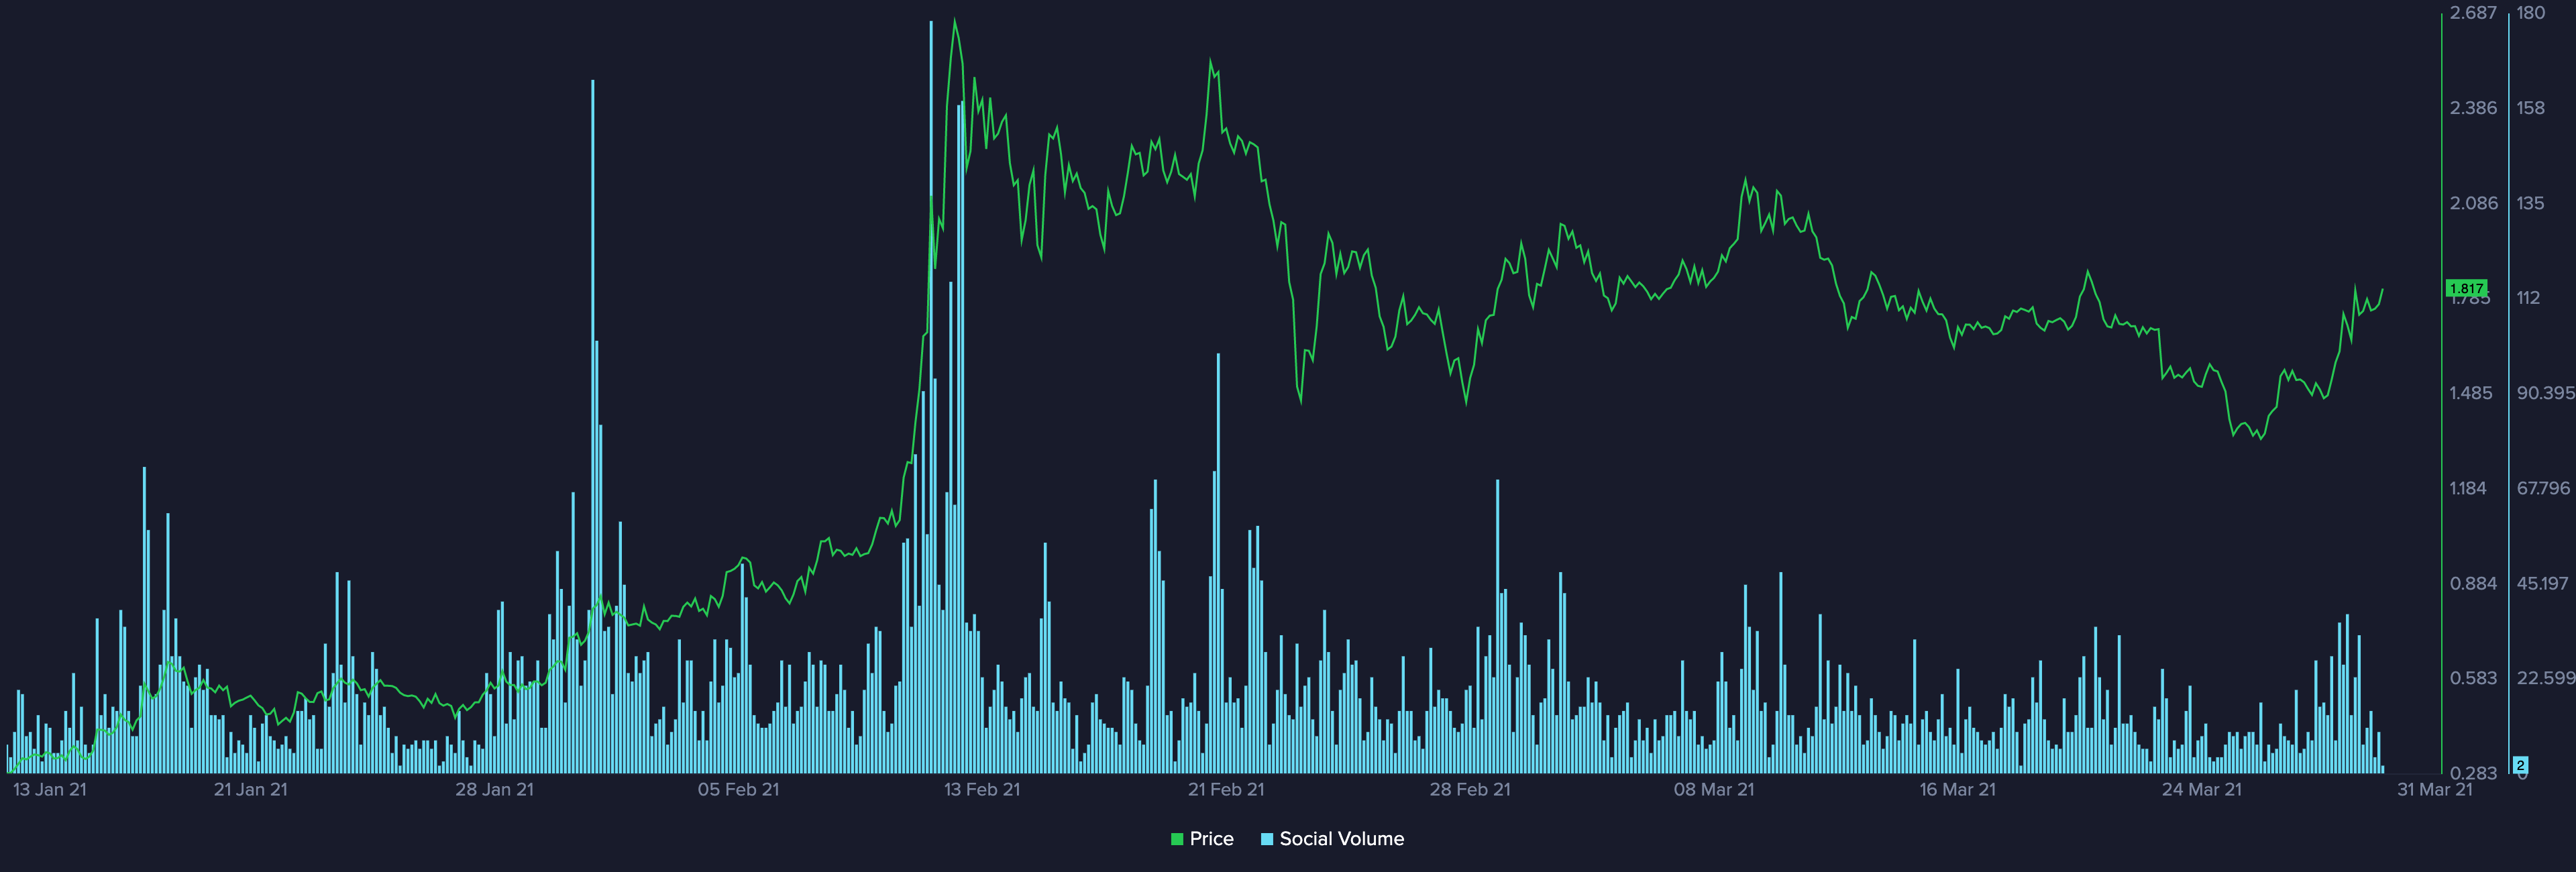
GRT's social volume is on uptrend. Amount of the Graph mentions in crypto social media bottomed out a few days ago and now seems to be increasing. Still far from the danger territory, but definitely nice to keep an eye on this metric to monitor it's possible growth.
For now it seems that social volume does apply to the Graph similar to other coins.
Previous SV spikes can be noticed around local price upticks.
Weighted Social Sentiment

WSS is quite low recently, indicating a sort of a 'silent' bearish mood in community.
Overall it seems that WSS data hasn't done much for the coin. When we see major positive sentiment spikes like Feb 12 and March 3 it does seem to coincide with local price tops.
Daily Active Deposits

GRT active deposits skyrocketed on Feb 11th pump, as expected. People were moving funds to exchange to take advantage of the pump. Interesting find: the last spike on Mar 19th came a day earlier than the local top.
Exchange Inflow

Definitely seeing some elevated exchange inflow activity in February and obviously around Mar 9th, the latest top for GRT.
If we zoom into a few last days there is a bit of an uptick once again:
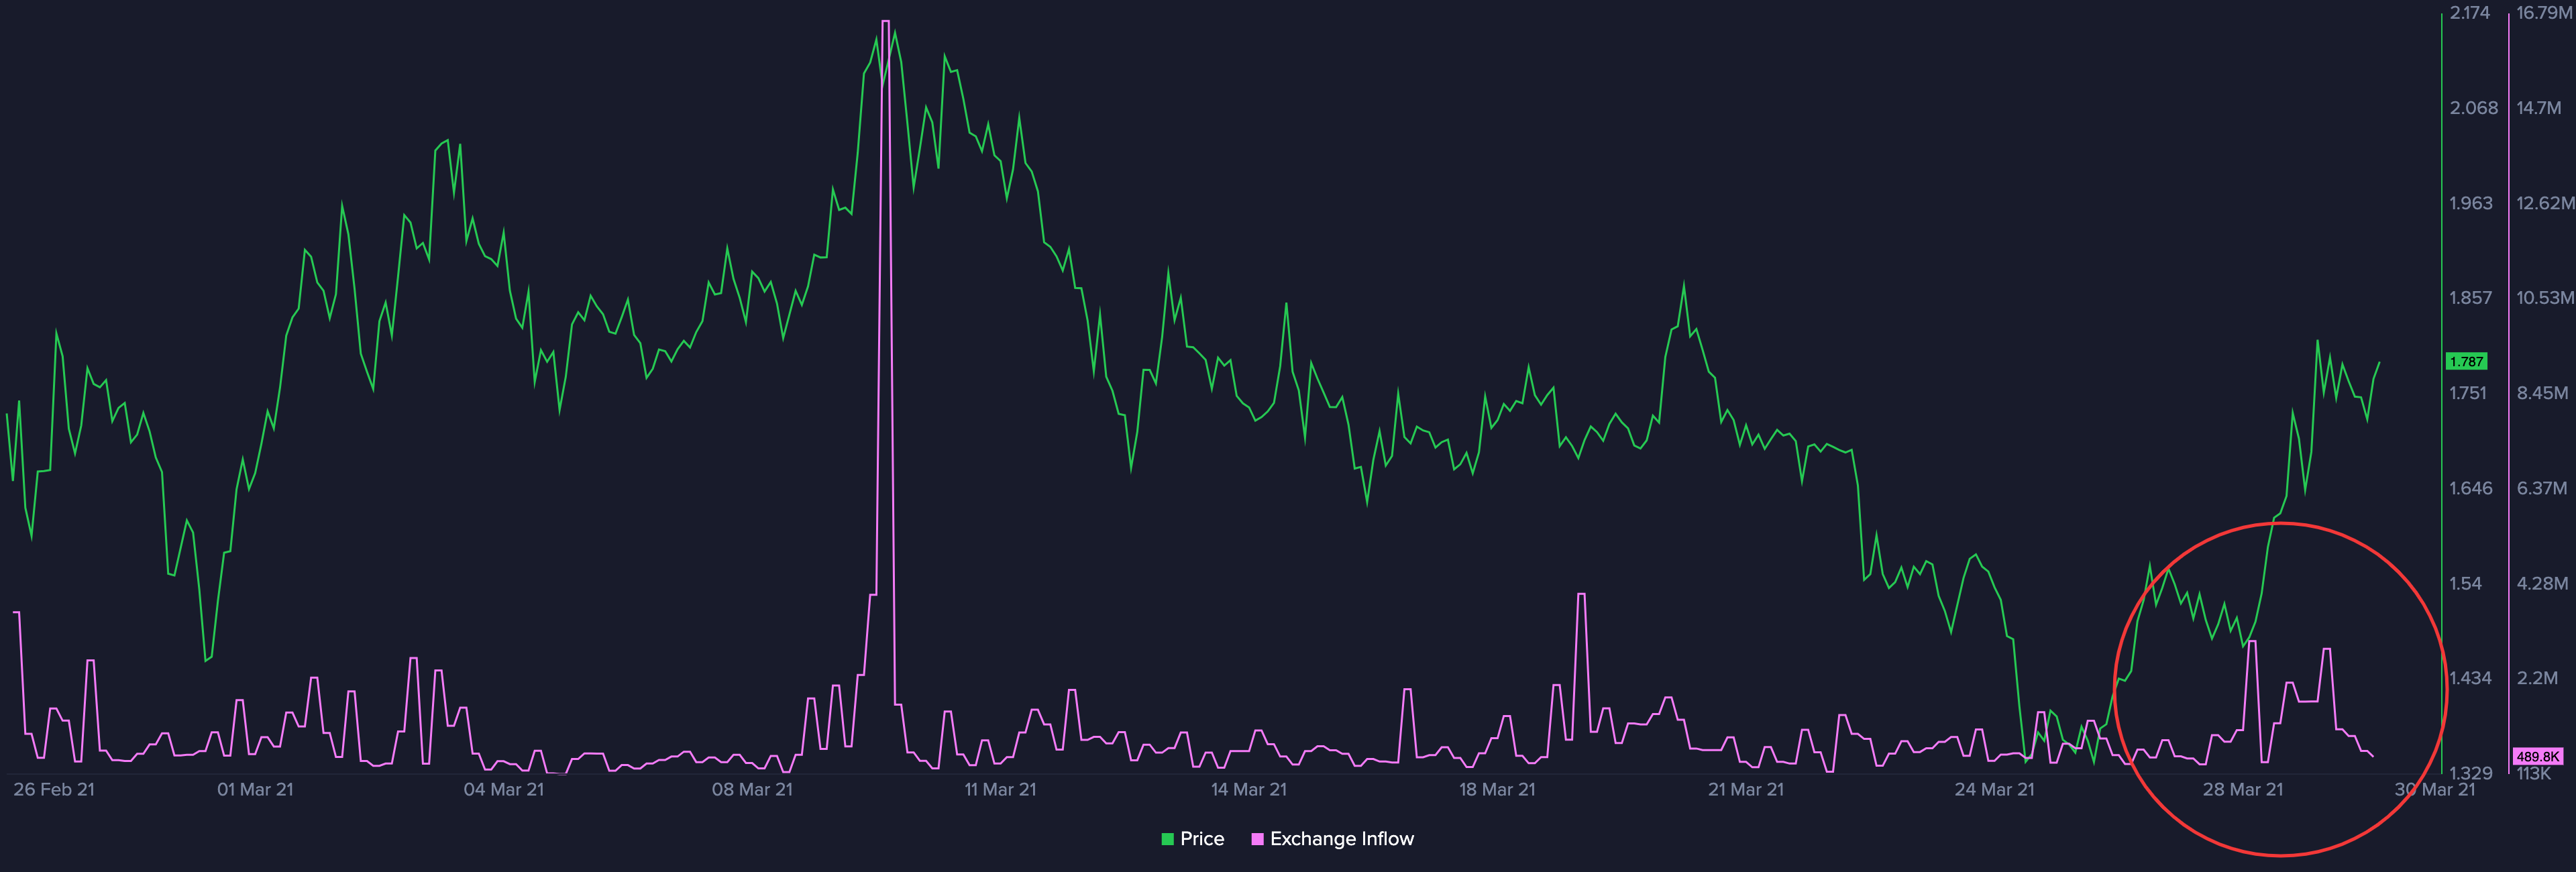
Nice to see that around local bottoms 28-29 Mar there were a bunch of FUD sell offs, and they marked the local bottom and the start of the uptick. We might see some elevated sell offs or potential for short term correction if it continues.
Active Addresses

Graph active addresses amount is currently above 1.7K, almost the same as SUSHI. It proves that GRT tokens are being used. And February was the peak of the mania. Then it has stabilized in terms of onchain activity. Yeah, there is still a downtrend especially like the last week or so. It seems like GRT has found where it belongs to in sort of onchain activity. Which is not bad.
Network Profit or Loss

The thing with GRT is it had a period of price appreciation, a lot of these NPL spikes are going to be way in positive.
We had a few small dips, seems to have been sell offs from people that have been acquired around the highest top. Overall didn't really impact the price in the positive way:

Generally we had a period of profit taking, then consolidation and price down. The last NPL spike coincides with exchange inflow. It means someone took profits. May be he was tired of decline. We would have expected to see more of these dips. But it seems because the price appreciation was so high, most of chart is deep in positive zone.
MVRV

We've been around break even for a while now in terms of 30d MVRV. Short term holders (people that have acquired in previous 30 days) are not really doing well. Metric value is from negative to neutral. Means short term holders are kind of suffering. Even longer term holders, visible on 90d MVRV, are fairly low on their initial investment:

Whales (Supply Distribution)

Above is the story of wealthy holders from 1M to 10M GRT tokens.
Summing up
The Graph keeps it's secret. It's fundamentally strong project with solid investors. Listed on major exchanges. Could show much more impressive performance on higher levels of onchain and social activity.
When altszn?
Disclaimer: The opinions expressed in the post are for general informational purposes only and are not intended to provide specific advice or recommendations for any individual or on any specific security or investment product.