ChainLink: slowing down under water

Assets covered: ChainLink (LINK)
Metrics used: Network Growth, Active Addresses, Exchange Inflow, Network Profit Loss, MVRV
Technically ChainLink doesn't look good against BTC. Where we are atm against USD? There are some good signs, some bad signs, let's see.
Worrying signs
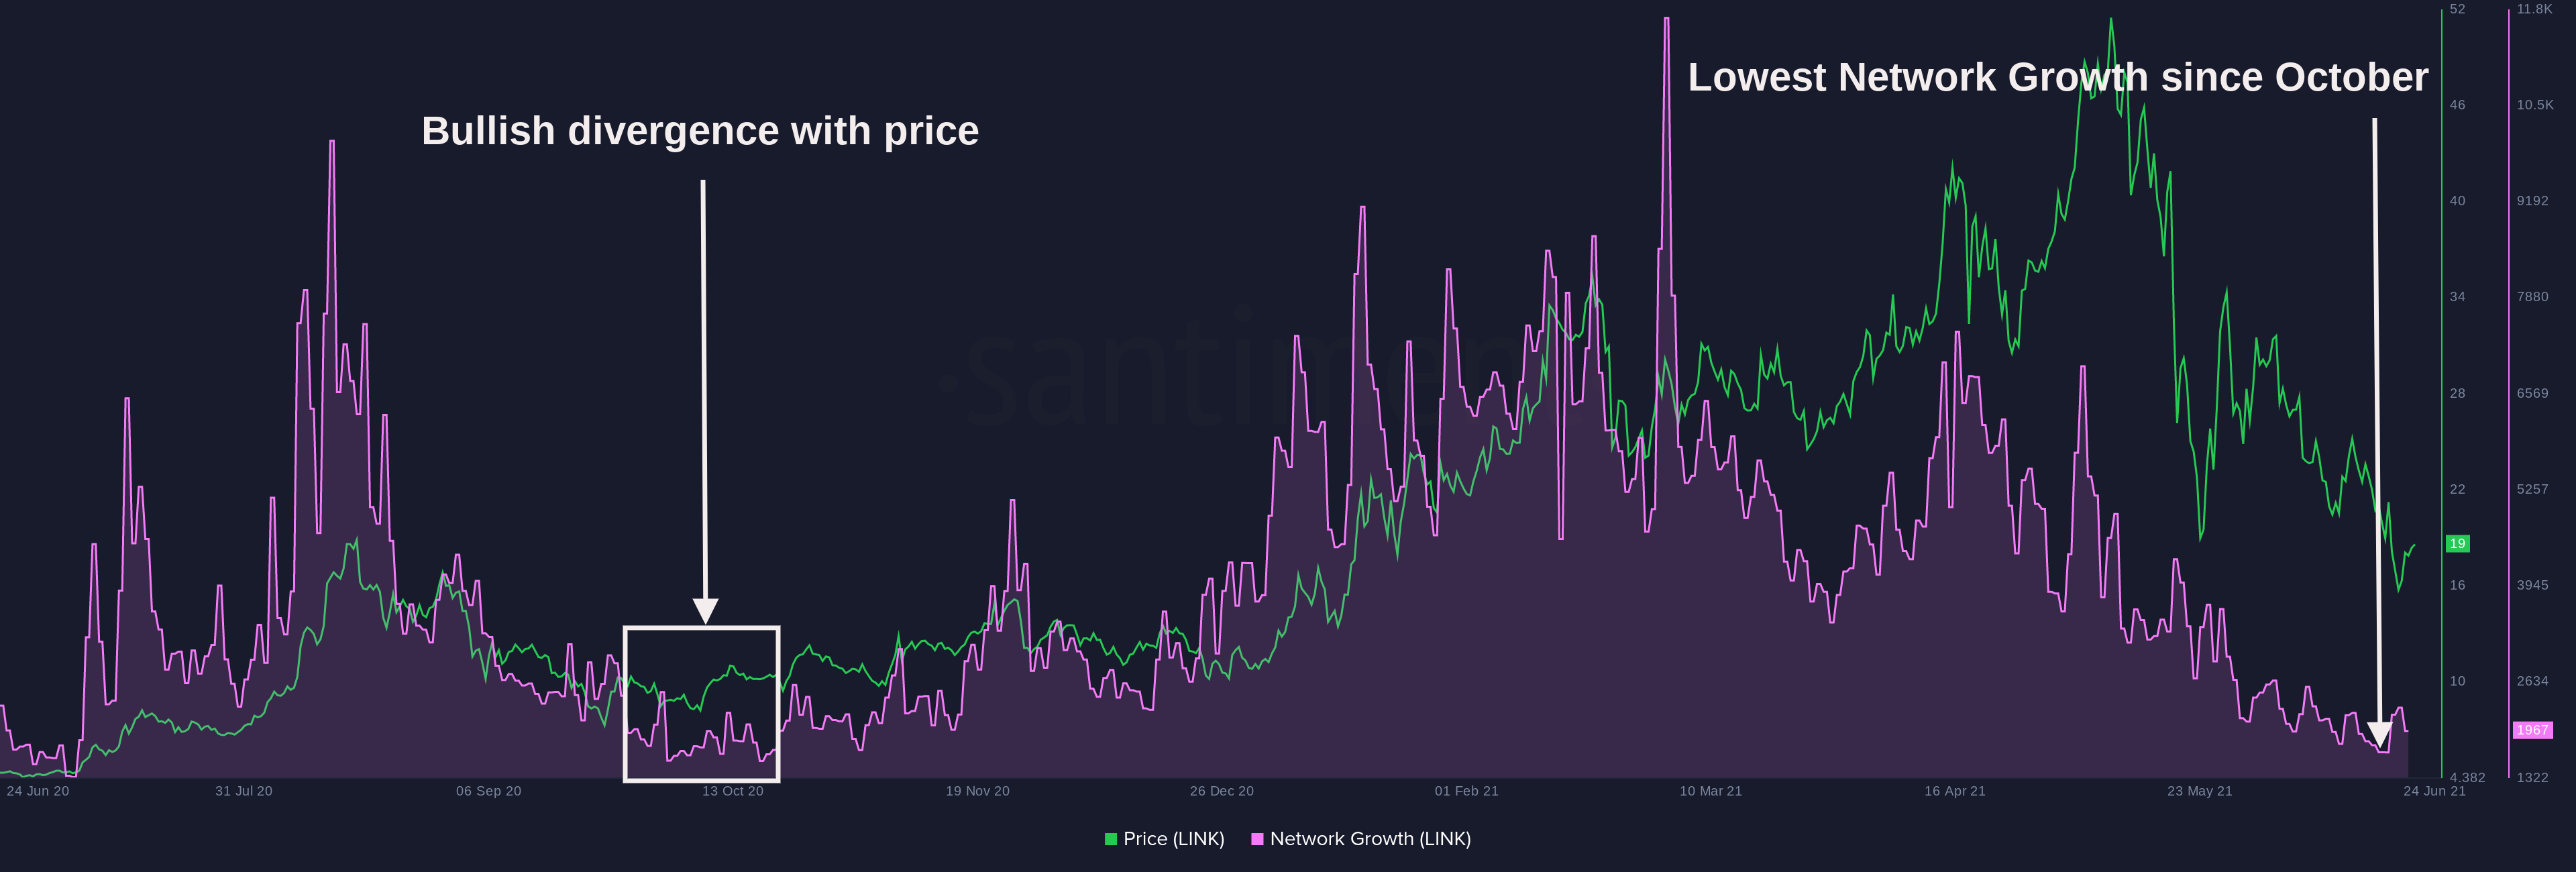
Network Growth
It shows the number of new LINK addresses being created on the network each day. This metric illustrates user adoption over time, and can be used to identify when ChainLink is gaining or losing traction.
A few days ago NG has been lowest for LINK since late October. Less and less addresses were interacting with LINK for the first time. This doesn't look like a great sign.
An interesting thing around the previous bottom is an unusual divergence between Network Growth and price. You might notice that back in October there was a period of declining NG into surging price. It was that time when we turned from bear to bull.
October: price tries to grow first but NG stands still. So it's a kind of divergence. Price starts increasing but NG disagrees. Network doesn't believe. Like around 11 Oct 2020. Then it turned around, and we got a strong bull signal.
If you want to play safely you might want to look like patterns like this. When price tries to recover but Network Growth says no.
So that you know what to look for.
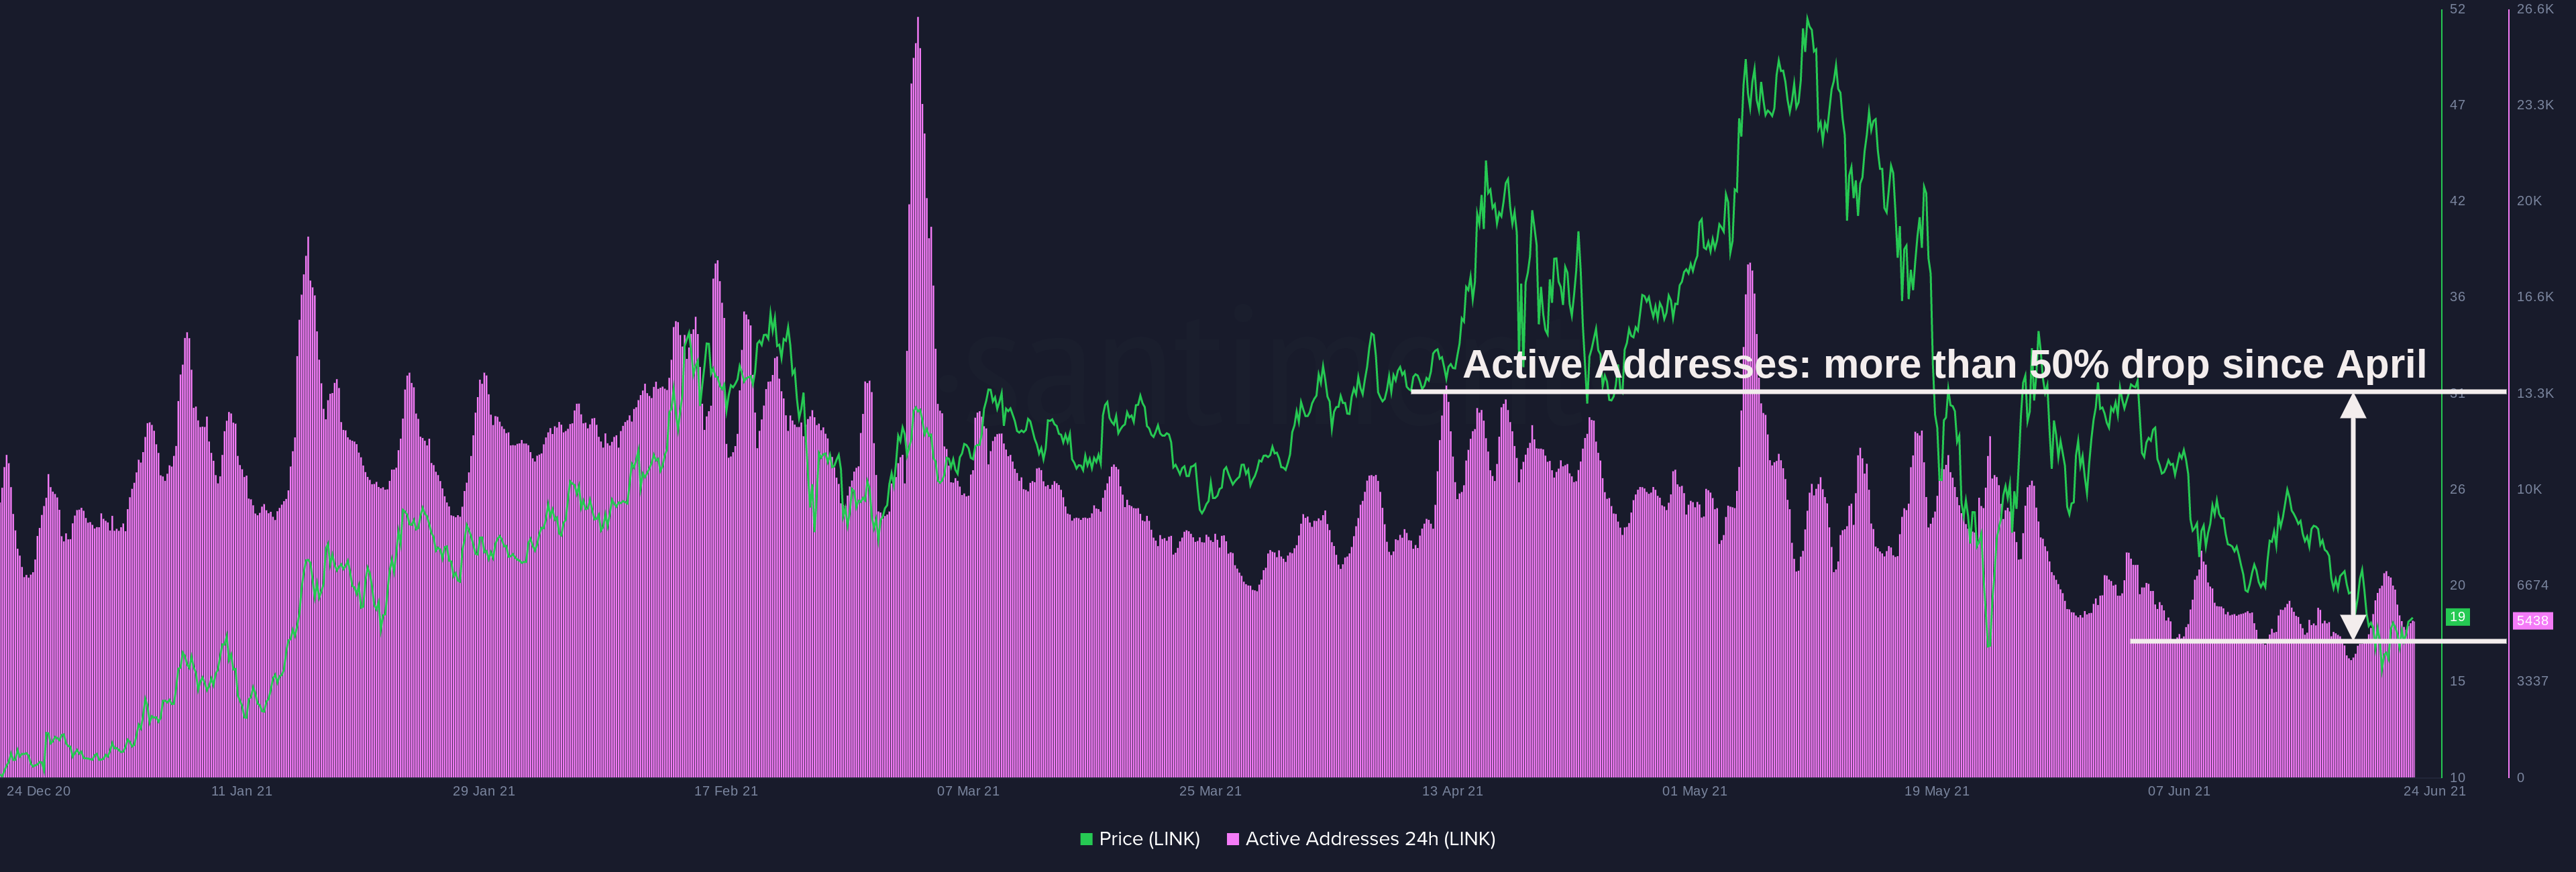
Active Addresses
LINK has dropped significantly in terms of average active addresses compared to spring. Just around 5K addresses daily are active on the network nowadays. From 13K in April:
Good signs
Exchange Inflow
A bunch of sell offs is visible, on Monday, Tuesday and Wednesday:

It's good cause it's indicating a sort of panic selling, capitulation in crowd. Happening usually around bottoms.
Network Profit Loss
A big drop in NPL detected on Thursday. That should mean the average loss of LINK tokens moved this day is significantly higher than usual.

A significant loss combined with Exchange Inflow spikes could indicate crowd fear, it's good for price.
MVRV
We're quite low today in terms of short term MVRV 30d. We bounced back from –30% support. It's amazing how all these support levels, trend lines and resistance are also working on onchain data. We're already back a bit but still quite undervalued:

Long term MVRV 365d remains very low. This looks like we are in a bounce back zone for ChainLink. Which is good. At least according to MVRV:

Summing up
Good:
- Exchange Inflow spikes
- Network Profit Loss dips
- Very low MVRV
Bad:
- General onchain activity like Active Addresses and
- Network Growth
Both can be laggy indicators, but for now it's suggesting less and less interaction with LINK. For example Shiba Inu has more active addresses than ChainLink. Nothing said.
Take care.
Disclaimer: The opinions expressed in the post are for general informational purposes only and are not intended to provide specific advice or recommendations for any individual or on any specific security or investment product.