Bold Predictions XXVI - Well, Hello There Volatility, Old Friend!


This 7-day look at the crypto markets here in the second week of January really says it all. A completely mixed bag of major returns for top 100 assets, mixed with some major disappointments, and Bitcoin and Ethereum mostly flat. As the calendar has jumped to a new year, the days and nights in the crypto markets have essentially become progressively more volatile. History has been made in multiple categories for hundreds of assets in just the past couple of months. Bitcoin dominance was heading toward record ratios, as it seemingly left altcoins in the dust on its road to an almost unfathomable all-time high of ~$41,820 on Friday.
As we've learned time and time again in crypto, though, what goes up does eventually come back down. But it seems that after Bitcoin's pitstop back down to $30,570 pm Sunday, things have really opened up and the months of profits accumulated through Bitcoin have began to be spread out handsomely among many different projects. And Bitcoin itself has recovered halfway back to its all-time high after having its biggest daily plummet (-25%) since Black Thursday last March.
We'll be jumping into Bitcoin and Ethereum as usual, while also taking a look at some interestingly volatile projects, Synthetix and Band, in this week's issue of Bold Predictions. All of the models we'll be going over in this article are available for Sanbase PRO members. And we continue to offer 25% off your first month's subscription on any Santiment service you have your eye on! Just take 15 seconds to provide feedback for us on this poll. Then just visit the Sanbase pricing page to get started with your 25% discount now, and enter SIGNALS25 at checkout! Any help needed on redeeming this, just email us at support@santiment.net.
With every weekly volume we release of our Bold Predictions series, we are taking a look at the most recent previous days of our metrics to assess what divergences may be forming to imply future market movement. None of our assessments should be considered investment advice, and we encourage you to explore Santiment's metrics for yourself to formulate your own opinions based on your own trading strategies.
As a reminder, these signals are to be used at your own risk, like all metrics and charts on Santiment that have historically provided insight on future market performance. These indicators are for traders to assess local tops and bottoms based on historically predictive and backtested leading indicators. Our rating system is simplified on a 0 to 10 scale, with 0 being as bearish as possible and 10 being as bullish as possible. This would mean that a 5 would be neutral and imply sideways movement estimates over the next couple weeks until the next edition. Whether we call a project bullish or bearish for the next week or two, please remember that this has no relevance as to what we think of the asset's long-term viability as an investment.
----------------------------------------------------------------------------------
This Week’s Assets:
- BTC, ETH, SNX, BAND
This Week’s Metric Breakdowns:
- MVRV Opportunity/Danger Zones
- Whale Growth (Holders Distribution)
- Exchange % of Supply
- Weighted Social Sentiment
----------------------------------------------------------------------------------
Bitcoin ($BTC) - #1 Ranked Market Cap
- 7-Day Movement: -12.0%
- 30-Day Movement: +80.1%
- 90-Day Movement: +203.3%
MVRV Opportunity/Danger Zones

We love identifying how average trader performance is looking compared to an as actual price performance. More often than not, average traders are performing significantly worse than the actual percentage returns of the project. And this past week has been no exception for Bitcoin. The price has dropped a modest 4% over the past week, yet 7-day traders (those who entered into the space a week ago) are down 10%. After Friday's all-time high, there were clearly signs of major panic selling as BTC made its way rapidly down to $30,000, leaving traders wondering if the past months of climbing was all one giant fake-out. The good news is that this short-term bleeding from traders leads to a nice opportunity for entries. The bad news is that longer term returns are still through the roof, and entering while the average return over the past year is +70% is going to have major associated risk.
Rating: 2.0
Whale Growth/Holder Distribution

The climb in the amount of whale addresses for Bitcoin (which we deem as 1,000 $BTC or more held) has been highly publicized by us, and you may have seen plenty of updates about it over the past week on our Twitter. Over the past two weeks, the number of these addresses has grown by over 4%, which is quite a massive jump. If you don't believe us, take a look at just how much of a spike this is compared to the normal climb that has happened over the previous year. This only avoids a perfect score since yesterday was the first day of the new year where the number of whales actually decreased.
Rating: 9.0
Exchange Percentage of Supply

You may notice that the Exchange % of Supply metric on Sanbase looks a bit different. Our developers are currently working on adding data that was previously unavailable to give us a more comprehensive look at how much of Bitcoin's supply is sitting on exchanges vs. off. For now, though, until its optimized, we'll look at our old method which aligns more with our competitors. This is an extremely valuable metric, as it indicates how likely a major sell-off could be coming. And the lower, the better in this case. Bitcoin is nearing its year low in the supply ratio sitting on exchanges, and this is an encouraging sign to show that major holders are content right now.
Rating: 9.5
Weighted Social Sentiment (Twitter)
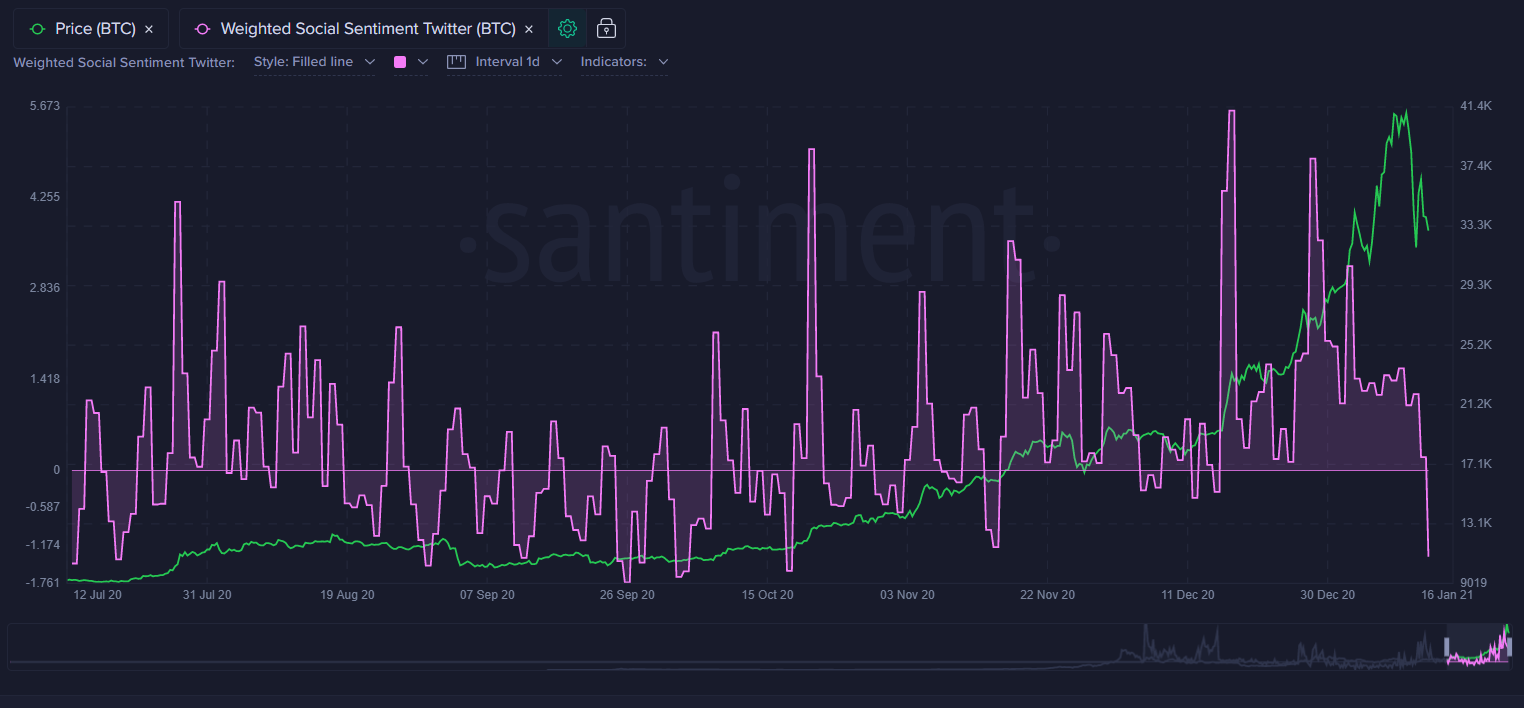
Our weighted social sentiment metric is revealing that the crowd has finally turned negative on Bitcoin, compared to its normal average positive/negative ratio of commentary, after more than three straight weeks of positivity and flat-out euphoria. As a trader, this is what you want to see, as it indicates there is some fear forming after the sharp drop a few days ago. Just be aware that things could kick right back up to euphoric of all-time high ranges begin to show up again.
Rating: 7.0
BTC Average Rating: 6.8 (Semi-Bullish)
----------------------------------------------------------------------------------
Ethereum ($ETH) - #2 Ranked Market Cap
- 7-Day Movement: -13.1%
- 30-Day Movement: +81.7%
- 90-Day Movement: +181.0%
MVRV Opportunity/Danger Zones
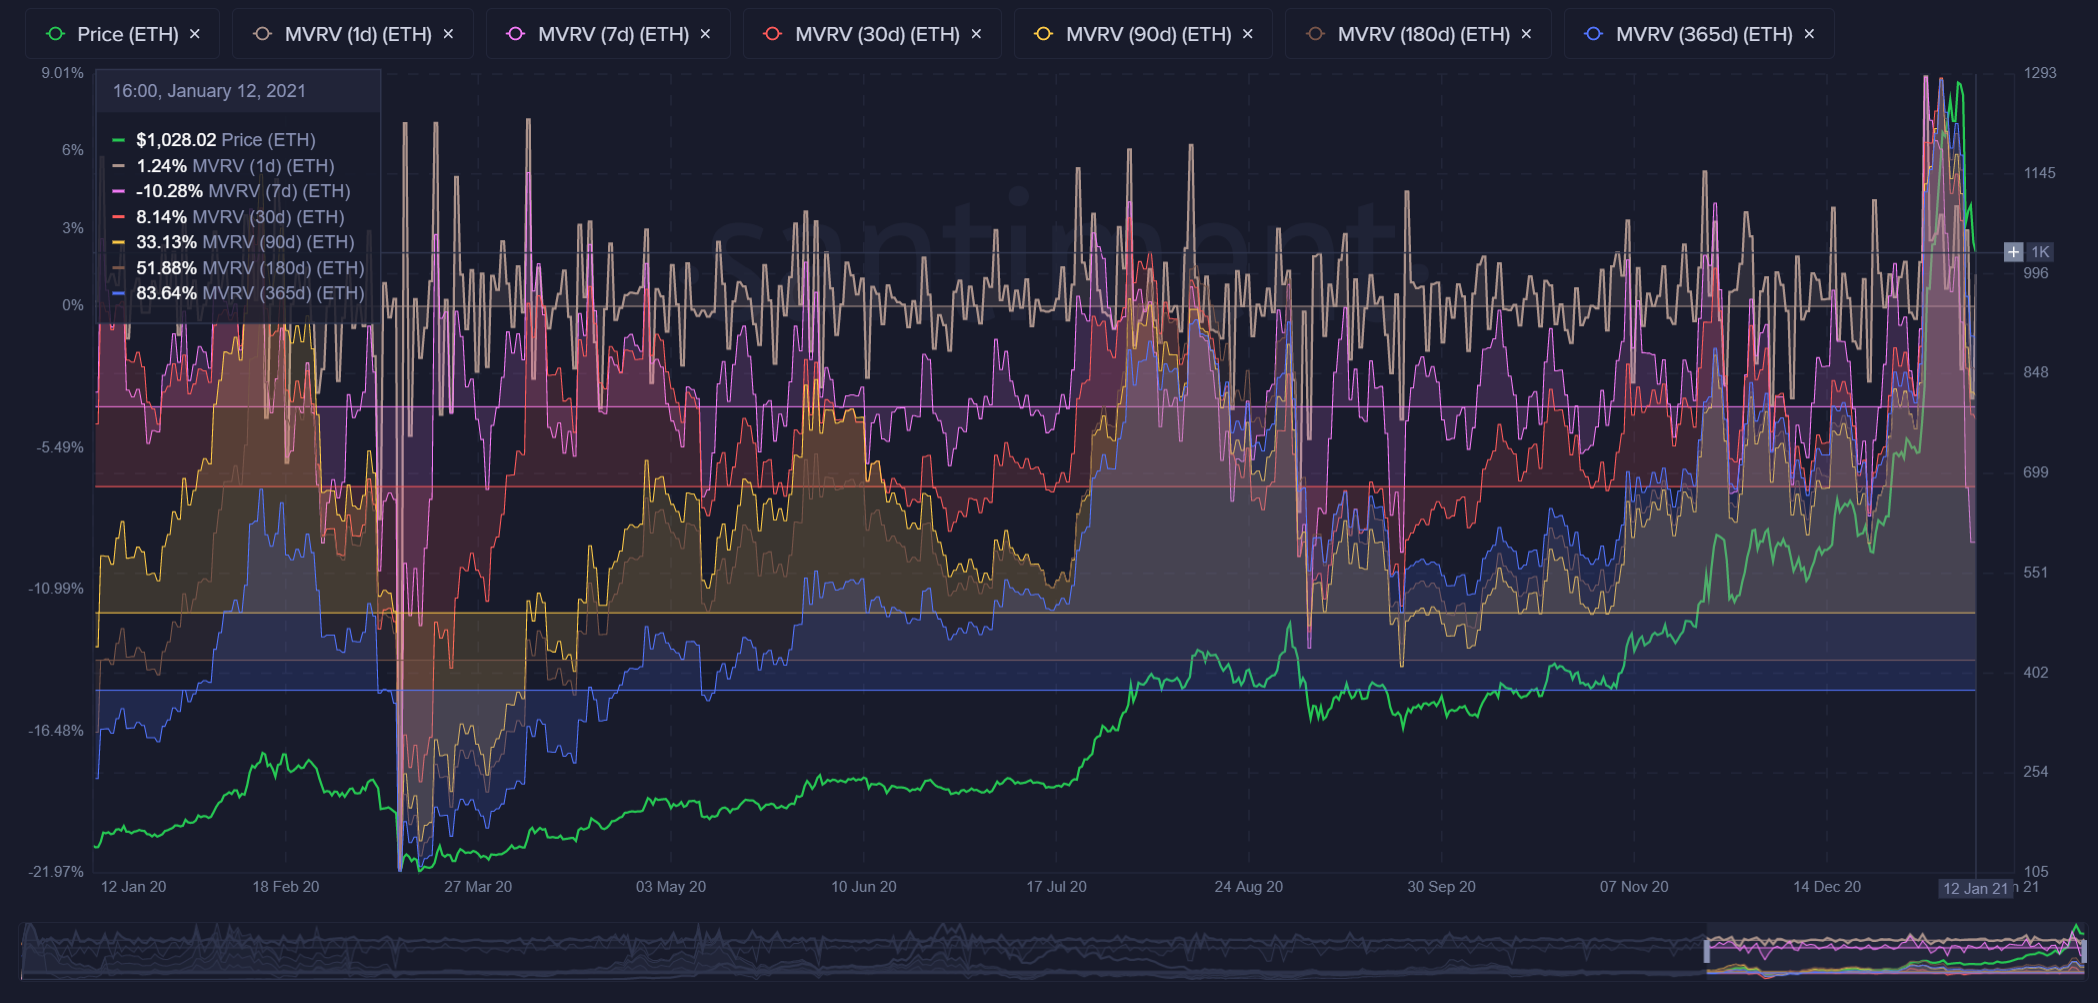
Ethereum is in a similar spot to Bitcoin in terms of average trader returns. Most timeframes are positive still, but the 7-day MVRV has taken a beating and in the negative double digits after Ethereum looked like it was headed toward a new all-time high of its own a week ago. There is a bit of 'blood in the streets' thanks to this one-week timeframe, but long-term gains are still far too large to get too excited about this.
Rating: 2.0
Whale Growth/Holder Distribution

Ethereum whale numbers, which we qualify as any address with over 10,000 tokens, continue to grow rapidly. Back over 1,200 of such addresses, there are now as many of these whales as there were before Black Thursday. And the rate in which they have grown, similar to Bitcoin's whales, is incredibly good to see here.
Rating: 9.0
Exchange Percentage of Supply

Ethereum's percent of supply on exchanges is staying low, in spite of the fact that its seen a deep price correction these past couple of days. ETH holders are known for being quite patient through the volatile times, and right now appears to be no exception to this strong reputation.
Rating: 9.0
Weighted Social Sentiment (Twitter)

Ethereum is also getting its share of negative posts and FUD right now after a dip back below $1,000 when many thought it would never see triple digits again. We'll want to watch this negative commentary carefully to see if it continues. If it does, it's a great sign that a bounce will happen rapidly and fake out a lot of the doubters of the #2 market cap asset in crypto.
Rating: 6.5
ETH Average Rating: 6.6 (Semi-Bullish)
----------------------------------------------------------------------------------
Synthetix ($SNX) - #26 Ranked Market Cap
- 7-Day Movement: +37.5%
- 30-Day Movement: +236.7%
- 90-Day Movement: +272.0%
MVRV Opportunity/Danger Zones

Synthetix is one of those projects we were referring to as having a field day with Bitcoin's profits funneling into altcoins. The combined average returns for all six of our major timeframes displayed in the above chart, are near a combined average all-time high thanks to a +37% week. In short, this is scary, and starting a long investment now comes at a time when many traders are already declaring victory.
Rating: 1.0
Whale Growth/Holder Distribution

The whale numbers for Synthetix did most of their growing from September through November. And the numbers haven't really fallen off much at all ever since. There's nothing wrong with a plateau when the number of whales have increased by about 55% over the past 10 months, and it's not surprising to see this rally, which is likely related to the sustained number of 10k+ holders of SNX.
Rating: 7.5
Exchange Percentage of Supply
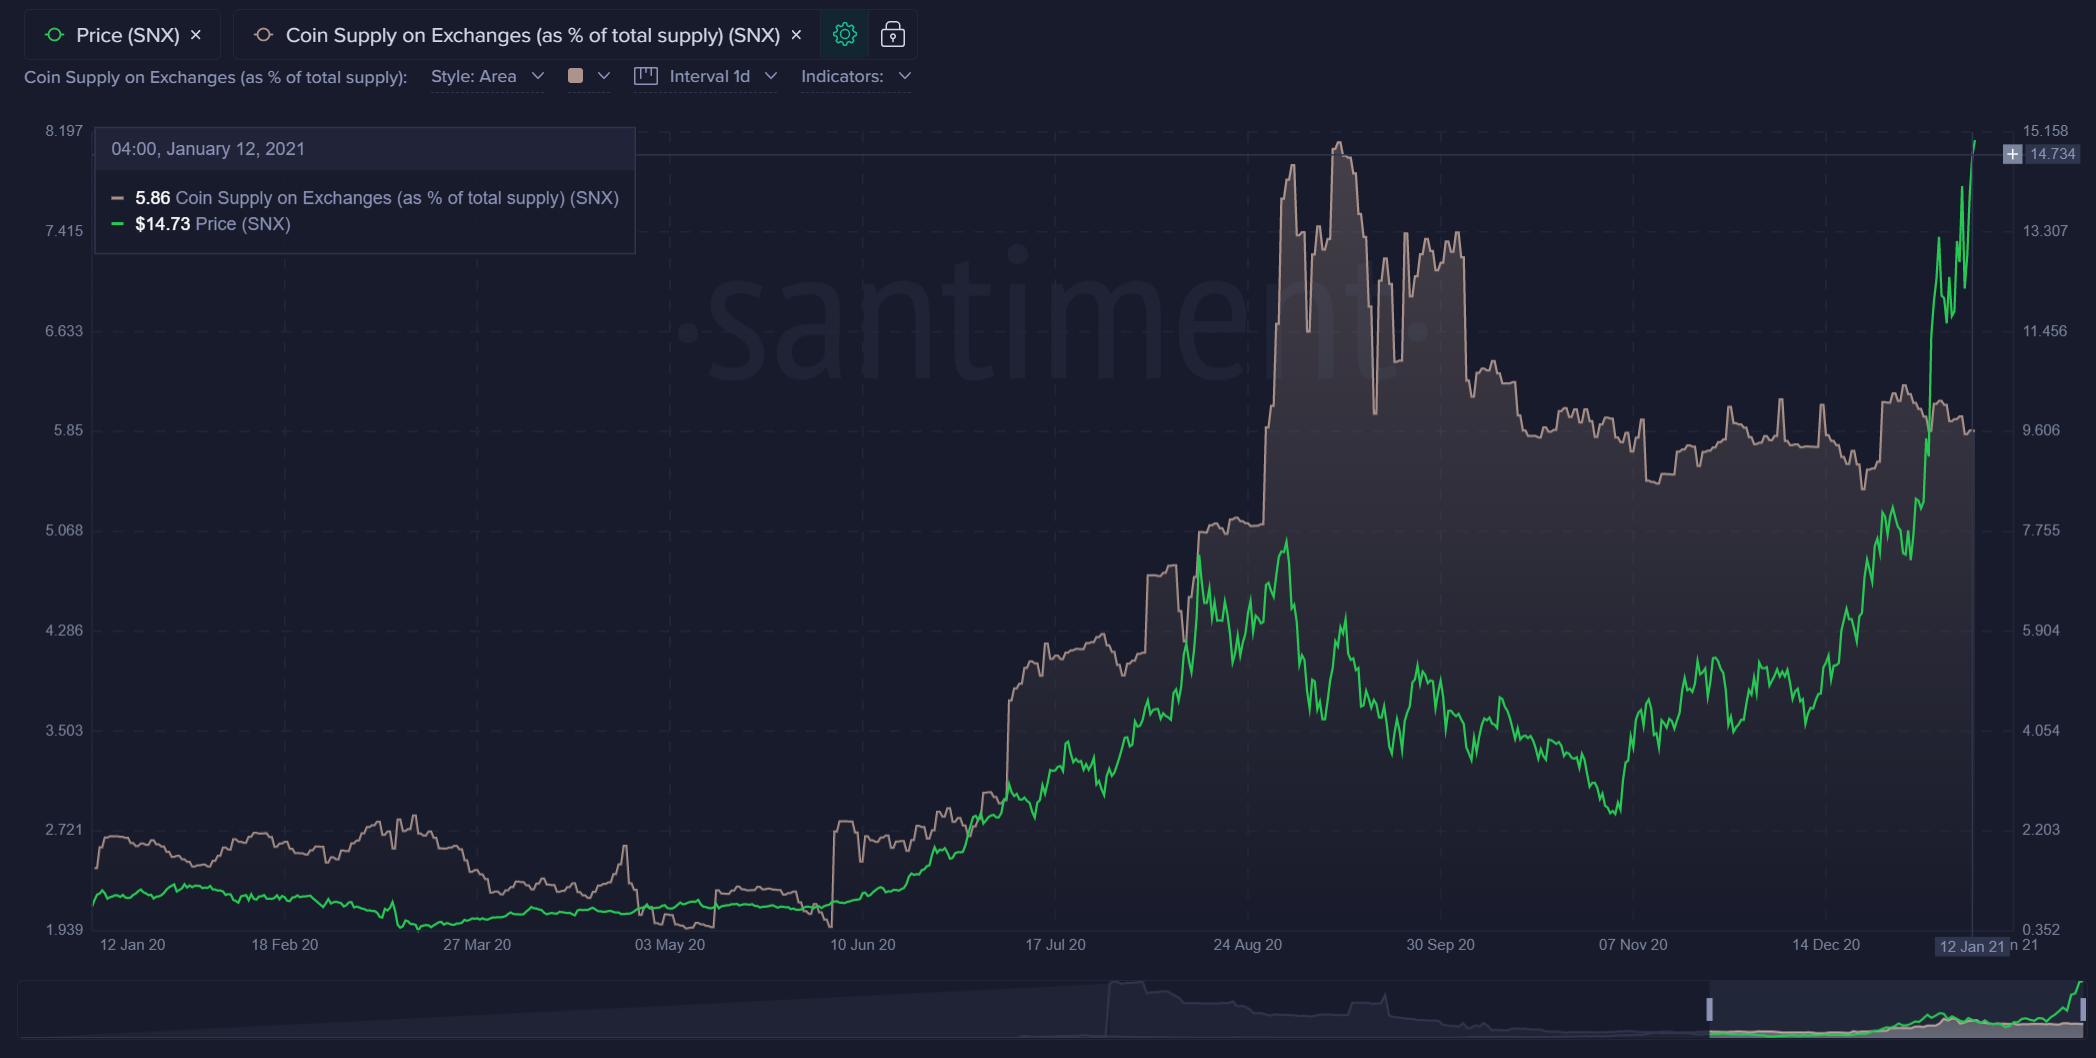
Synthetix saw a major spike in tokens being moved to exchanges in late August, and this coincided with a large two and a half month correction. However, the ratio on exchanges has ticked down a bit as prices have risen to new all-time highs. It's still a bit concerningly high though, and well above the levels this metric was sitting at before the scary spike in late August. This is definitely a candidate for a trap door drop at some point.
Rating: 3.0
Weighted Social Sentiment (All Tracked Platforms)

Looking at the total weighted social sentiment, we see that euphoria actually hasn't really kicked in despite the surging prices. This means that the 26th ranked crypto asset isn't quite getting the recognition it deserves yet. Without this crowd discovery, there is an increased likelihood that this rally can continue!
Rating: 7.0
Synthetix Average Rating: 4.6 (Neutral)
----------------------------------------------------------------------------------
Band Protocol ($BAND) - #70 Ranked Market Cap
- 7-Day Movement: -5.6%
- 30-Day Movement: +18.0%
- 90-Day Movement: +24.8%
MVRV Opportunity/Danger Zones

Band Protocol often gets the dubious reputation of being Chainlink's little brother. But it has been rising and falling quite independently from LINK since 2021 kicked off. Like many altcoins, BAND had a great middle portion to 2020 that sent average trader returns sky high. And the one-year MVRV sitting at +83% is still a pretty big concern. The good news is that short term returns (1d, 7d, and 30d) are averaging out to be negative. This means there is some lower risk opportunity to get in on a position for at least the short term.
Rating: 3.5
Whale Growth/Holder Distribution

The Band Protocol whales are beginning to grow in serious numbers again after a pretty sizable drop-off in late September. Right now, this is one of the fastest rising altcoins we track in terms of percentage raised of top tier holders in the past 3 months. Still a ways to go to hit its year-high of over 100 10k+ BAND holders, though.
Rating: 8.5
Exchange Percentage of Supply

The coin supply of BAND sitting on exchanges correlates quite closely to price, as we can clearly see that coins being moved to offline wallets in June and July sparked the massive rally that the #70 crypto asset experienced in August. As of now, the supply on exchanges is mostly hovering in neutral after ticking down, and then back up the past few days as the price expectedly spiked and then fell accordingly.
Rating: 5.0
Weighted Social Sentiment (All Tracked Platforms)

BAND's social sentiment on public platforms is rather positive right now, and there is definitely an increase in excitement thanks to its spike to $11.39 on Sunday. As long as this trend of positive commentary continues, we have to give the asset a slight downgrade due to the crowd discovery.
Rating: 3.0
BAND Average Rating: 5.0 (Neutral)
----------------------------------------------------------------------------------