Bold Predictions XXV - Bitcoin All-Time Highs and Altcoin Woes. What's Next?

SANBASE SIGNALS
December 23, 2020
Wow, what a two-week stretch we have seen for Bitcoin and the rest of the crypto markets. Several new Bitcoin all-time highs were made, including the most recent one on December 20th at ~$24,150. With this push, altcoins have actually fallen further behind, and Bitcoin dominance is beginning to become the theme in crypto. However, with this narrative that "alts are dead" that's starting to become prominent again, comes an opportunity to invest in them while they're low. As we've learned and discussed many times in our Bold Predictions insights, markets generally move toward the path of the crowd's least expected outcome. And right now, the vast majority of euphoria is understandably attributed to the performance of Bitcoin. Keep this in mind as we touch on BTC and a few other assets of interest!

All of the models we'll be going over in this article are available for Sanbase PRO members. And we continue to offer 25% off your first month's subscription on any Santiment service you have your eye on! Just take 15 seconds to provide feedback for us on this poll. Then just visit the Sanbase pricing page to get started with your 25% discount now, and enter SIGNALS25 at checkout! Any help needed on redeeming this, just email us at support@santiment.net.
With every weekly volume we release of our Bold Predictions series, we are taking a look at the most recent previous days of our metrics to assess what divergences may be forming to imply future market movement. None of our assessments should be considered investment advice, and we encourage you to explore Santiment's metrics for yourself to formulate your own opinions based on your own trading strategies.
As a reminder, these signals are to be used at your own risk, like all metrics and charts on Santiment that have historically provided insight on future market performance. These indicators are for traders to assess local tops and bottoms based on historically predictive and backtested leading indicators. Our rating system is simplified on a 0 to 10 scale, with 0 being as bearish as possible and 10 being as bullish as possible. This would mean that a 5 would be neutral and imply sideways movement estimates over the next couple weeks until the next edition.
Whether we call a project bullish or bearish for the next week or two, please remember that this has no relevance as to what we think of the asset's long-term viability as an investment.
----------------------------------------------------------------------------------
This Week’s Assets:
- BTC, ETH, LINK, SNX
This Week’s Metric Breakdowns:
- MVRV Opportunity/Danger Zones
- Exchange % of Supply on Exchanges
- NVT Token Circulation
- Social Volume/Dominance
----------------------------------------------------------------------------------
Bitcoin ($BTC) - #1 Ranked Market Cap
- 7-Day Movement: +2.9%
- 30-Day Movement: +23.6%
- 90-Day Movement: +124.2%
MVRV Opportunity/Danger Zones

Bitcoin's average trader returns, as one may expect, are at a 6-month high when factoring in the averages of several different timeframes. Interestingly, despite BTC's actual 7-day return being at around +3%, the average trader returns are about breakeven. This tells us that there has been quite a bit of "buying high, selling low" to keep traders off balance. That being said, the MVRV's here still are absurdly high, and there will have to be a further shakeout of weak hands to reduce the risk of entering a new position right now.
Rating: 1.0
Exchange Percentage of Supply on Exchanges

Bitcoin's percentage of supply on exchanges has been fluctuating back and forth after hitting a low on December 10th, which functioned as rocket fuel for the #1 crypto asset to blast through its previous $19.8k all-time high. Now, coins have been trickling back on to exchanges. But not significantly enough to justify that a selloff is going to occur.
Rating: 6.5
NVT Token Circulation

As far as token circulation (unique tokens moving on the asset's network) goes, Bitcoin is getting a very healthy amount of movement to justify these high prices. Heading into Christmas, some of the most bullish days have just occurred, in fact. And with this, it's difficult to argue with this model continuing to look great with a semi-bullish signal showing through 23 days of December.
Rating: 8.0
Social Volume/Dominance

You would think that Bitcoin's social dominance would be higher than it is right now. But with Ripple announcing its expected lawsuit by the SEC, and several altcoins doing AMA's on Binance, these assets have taken away the spotlight slightly. And with the attention off of BTC, this could actually work to its advantage. Many appear to believe that Bitcoin can range in the low $20,000's for a while, and traders tend to become disinterested when ranging becomes the norm. This is a wait and see for now, but it has upside.
Rating: 6.0
BTC Average Rating: 5.4 (Neutral)
----------------------------------------------------------------------------------
Ethereum ($ETH) - #2 Ranked Market Cap
- 7-Day Movement: -9.6%
- 30-Day Movement: -2.2%
- 90-Day Movement: +72.3%
MVRV Opportunity/Danger Zones

Ethereum saw its top occur as Bitcoin broke its initial $20k barrier last week. However, unlike Bitcoin, Ethereum has immediately been dropping back down along with most other altcoins. Because of this, the 7-day and 30-day MVRV's are in the negatives currently. And longer-term MVRV's are showing slight signs of coming back to earth after really being stratospheric for long stretches over the past 6 months. On our Opportunity/Danger Zone model (pictured at the top of this article), ETH sits at a fairly neutral -0.13 now, and though still very mildly bearish, this is the best opportunity to get in with reeling trader returns in quite some time.
Rating: 4.0
Exchange Percentage of Supply on Exchanges

Ethereum's supply on exchanges continues to encouragingly be moved off of exchanges in a hurry. The 22.73% now on exchanges is within shouting distance of a 2-year low, with the previous low of 22.43% being made back in May, 2019. Obviously, we've stated that the lower the percentage of supply, the more assets can thrive. So this is a tremendous development for ETH bulls.
Rating: 9.5
NVT Token Circulation

For an 8th straight month, it looks like Ethereum is having an excess of token circulation compared to its current market cap. And it's no wonder that the price has continued to rally for most of this stretch. We see no signs that this sea of green that began back in May, can't continue into 2021.
Rating: 8.5
Social Volume/Dominance

Ethereum has been lost in the sea of discussions about Bitcoin and Ripple, with all of the news about the #1 and #3 market cap assets as of late. Social dominance is currently sitting at 4.65% for the #2 asset, and that's a bit lower than where its averaged over the past 6 months. With that in mind, this is a slightly better than average time to jump in, given the lack of attention ETH is currently receiving.
Rating: 6.0
ETH Average Rating: 7.0 (Slightly Bullish)
----------------------------------------------------------------------------------
Chainlink ($LINK) - #7 Ranked Market Cap
- 7-Day Movement: -22.9%
- 30-Day Movement: -32.6%
- 90-Day Movement: +18.7%
MVRV Opportunity/Danger Zones

Chainlink traders have been getting fairly crushed as Bitcoin dominance has been the theme in December. In fact, traders have been getting so crushed, that the 7-day, 30-day, 90-day, and 180-day MVRV's are all in the negative range now. This hasn't occurred at all in 2020, and 1-year traders are very close to going negative as well (at just +2.15% returns). The good news is that with these kinds of numbers, it's a pretty opportune time to get in and go against the sea of red that LINK holders and traders have been experiencing.
Rating: 8.5
Exchange Percentage of Supply on Exchanges
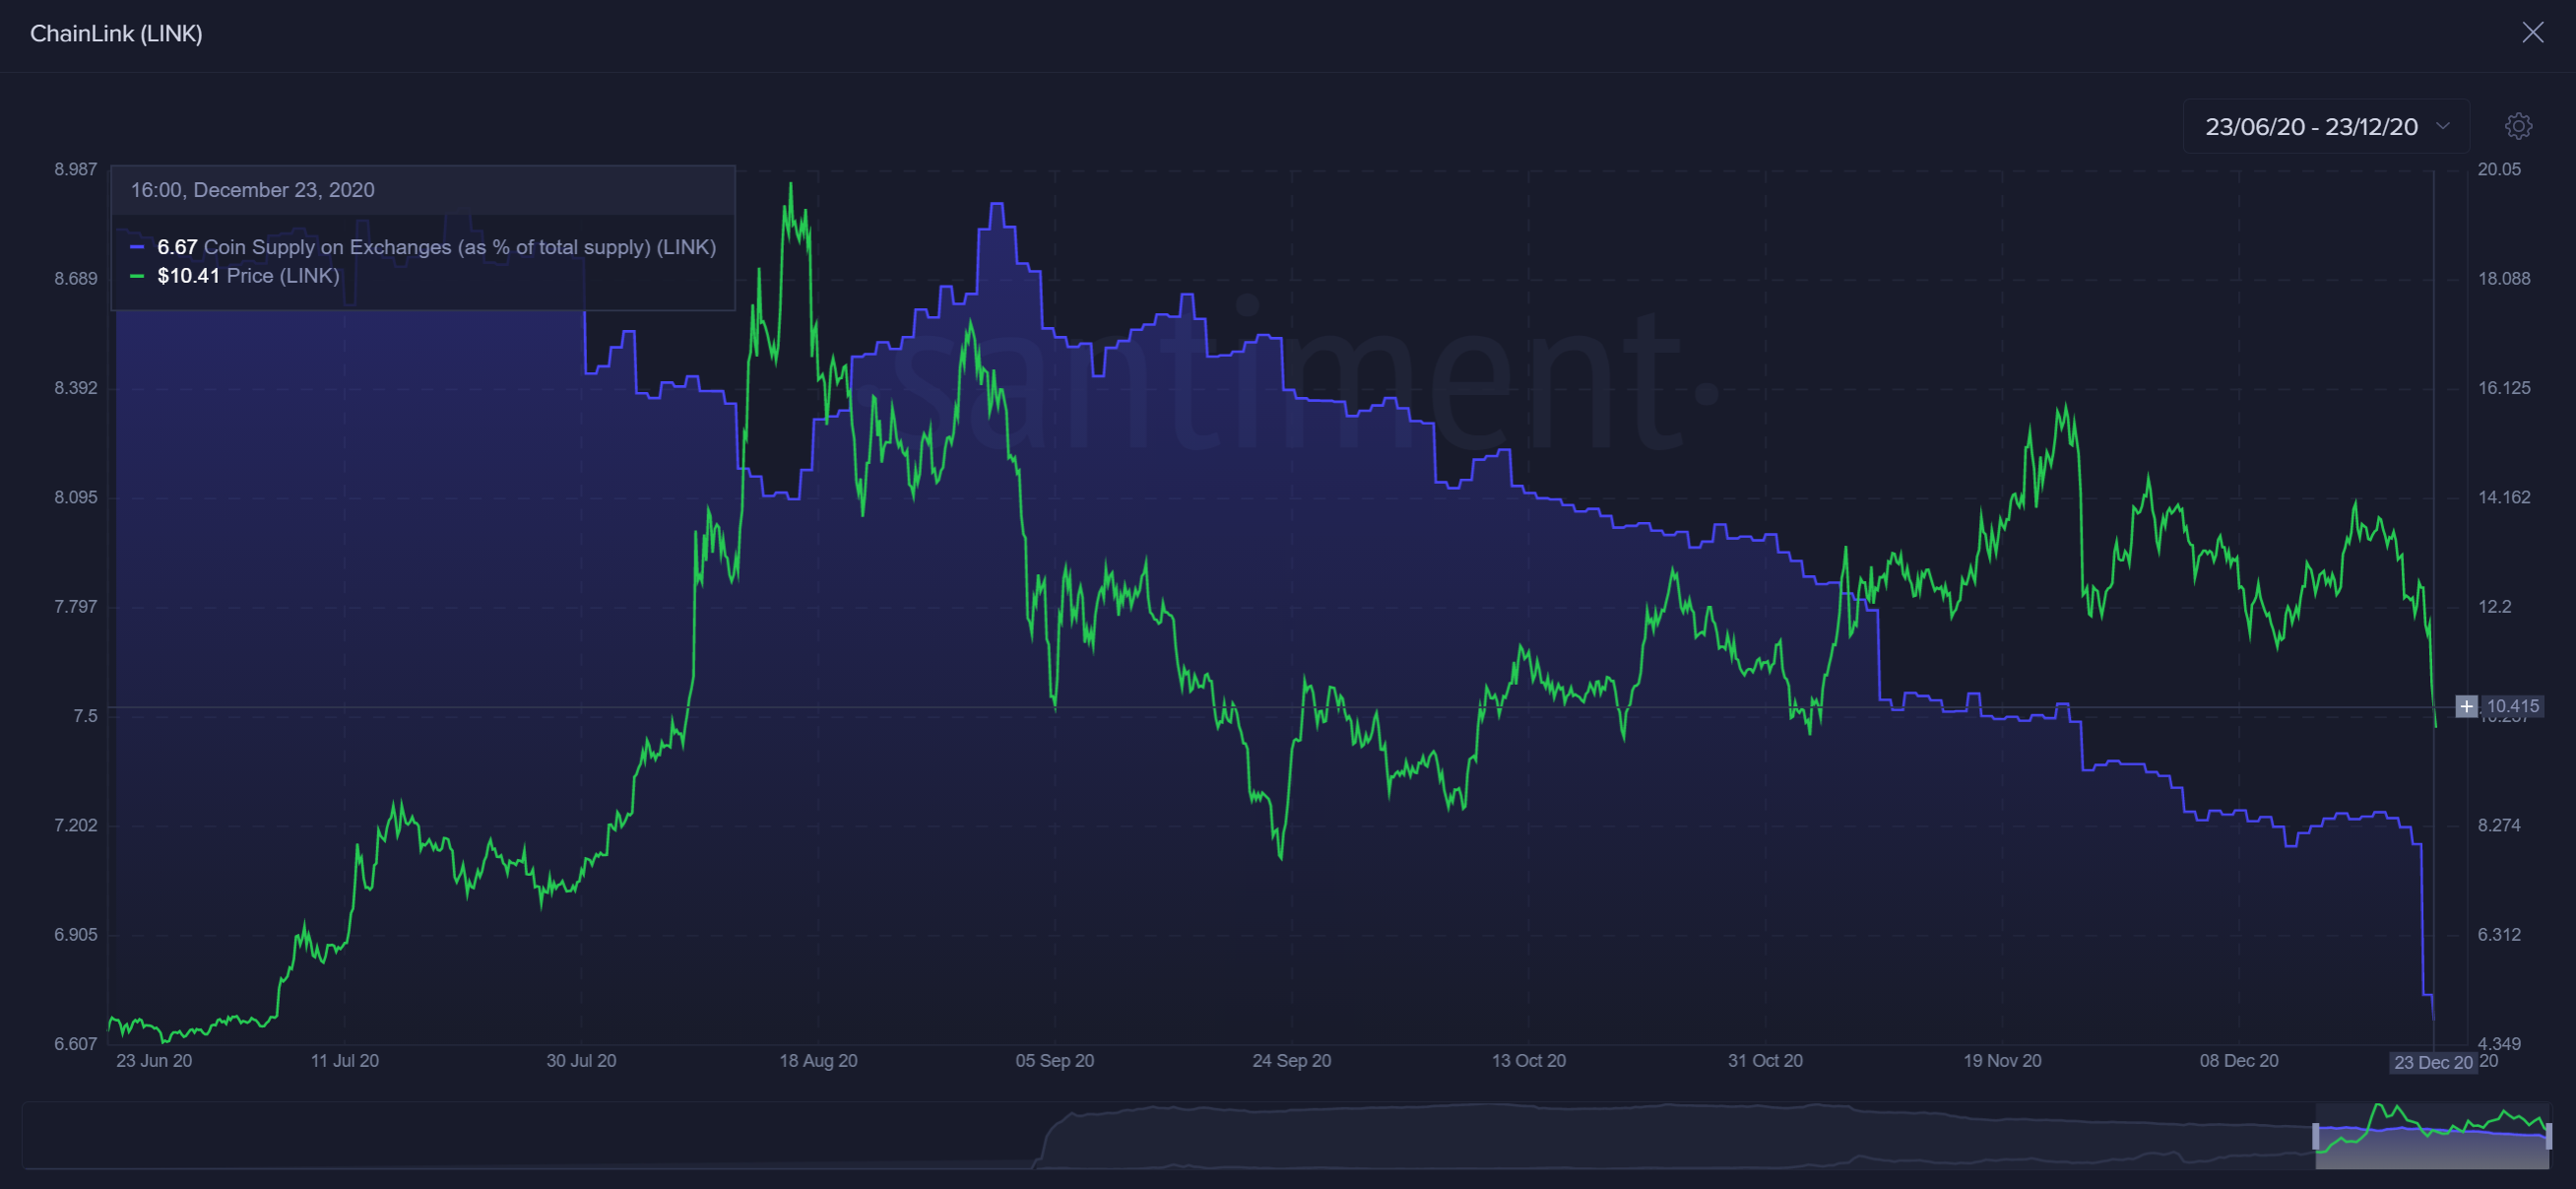
The amount of Chainlink sitting on exchanges is down to 6.67% now after seeing its largest single-day move off of exchanges in 6 weeks. This amount of supply on exchanges is the lowest amount since its ICO back in May, 2017. That being said, based on this metric alone, this is about as bullish of a sign as you'll ever see.
Rating: 10.0
NVT Token Circulation

Chainlink has been enjoying 11 straight months of bullishness, according to our NVT Token Circulation model. The trend has been slowing down just slightly until August, and the asset is getting very close to finally crossing over the green trendline (to be discounted just slightly to "Semi-Bullish". Regardless, LINK is still sitting in a great spot.
Rating: 8.0
Social Volume/Dominance

Chainlink's social volume saw its largest spike since August after dropping hard over the past 24 hours. Traders are obviously concerned, while others are viewing this as an opportunity. The overall trend for social volume and dominance is fairly neutral overall, though, compared to the norm.
Rating: 5.0
LINK Average Rating: 7.9 (Bullish)
----------------------------------------------------------------------------------
Synthetix ($SNX) - #32 Ranked Market Cap
- 7-Day Movement: +28.6%
- 30-Day Movement: +31.0%
- 90-Day Movement: +62.7%
MVRV Opportunity/Danger Zones

Part of the reason that Synthetix was chosen to be featured on this edition of Bold Predictions was because of the fact that it was one of the few thriving altcoins over the past week. With that, trader returns are very positive, as they often have been for one of the hottest altcoins of 2020. This doesn't look like the best opportunity to enter a position, because all five timeframes shown are well into the positive range.
Rating: 2.0
Exchange Percentage of Supply on Exchanges

The supply of SNX on exchanges has been mostly flat over the past couple months. But it is declining slightly over the past week, and this is encouraging to see. 4.6% of tokens on exchanges is already a very small number for an altcoin, so it will be tricky to see even more movement downward. But we'll have to wait and see how this plays out.
Rating: 6.5
NVT Token Circulation

Token circulation has continued to be predictably fantastic for Synthetix. A market cap that was outside the top 50 just a couple months ago, it's not surprising at all to see the sea of green continue for an asset that has been one of the few highlights for alts as of late.
Rating: 9.0
Social Volume/Dominance

With Synthetix receiving massive attention after an outstanding start to the week, its social dominance spiked to a near one-year high. As we often see when dominance or volume spike, this almost immediately signaled a top. This is a bit concerning, and we'll be watching to see if social volume bars stay down through Christmas.
Rating: 2.5
SNX Average Rating: 5.0 (Neutral)
----------------------------------------------------------------------------------
Conversations (0)