Bold Predictions XXIV - On-Chain Metrics Favoring Altcoins After Major Dropoffs Following Bitcoin's Correction

SANBASE SIGNALS
December 8, 2020
At this time, Bitcoin has fallen back to the low $18k range after its near historic push above $20k last week. With the retracement, as is often the case, altcoins have been hit the hardest. And with this, they are now presenting the best opportunities for a rebound according to our 'Opportunity & Danger Zone Divergence' model. This model calculates the average returns of traders from multiple starting points to assess how close they are to historic fantastic buy zones and sell zones:

Of course, our metrics cover a lot more than just average trader returns, and there are plenty of other factors that are relevant to keep an eye on to be able to accurately speculate whether Bitcoin can rebound back to $19k and make another push at its all-time high. In this edition of Bold Predictions, we're taking a look at Bitcoin and Ethereum, as well as two very interesting altcoins, Chainlink and Maker, to see what our models are foreshadowing on where prices will be most likely heading in the next two weeks!
All of the models we'll be going over in this article are available for Sanbase PRO members. And we continue to offer 25% off your first month's subscription on any Santiment service you have your eye on! Just take 15 seconds to provide feedback for us on this poll. Then just visit the Sanbase pricing page to get started with your 25% discount now, and enter SIGNALS25 at checkout! Any help needed on redeeming this, just email us at support@santiment.net.
With every weekly volume we release of our Bold Predictions series, we are taking a look at the most recent previous days of our metrics to assess what divergences may be forming to imply future market movement. None of our assessments should be considered investment advice, and we encourage you to explore Santiment's metrics for yourself to formulate your own opinions based on your own trading strategies.
As a reminder, these signals are to be used at your own risk, like all metrics and charts on Santiment that have historically provided insight on future market performance. These indicators are for traders to assess local tops and bottoms based on historically predictive and backtested leading indicators. Our rating system is simplified on a 0 to 10 scale, with 0 being as bearish as possible and 10 being as bullish as possible. This would mean that a 5 would be neutral and imply sideways movement estimates over the next couple weeks until the next edition. Whether we call a project bullish or bearish for the next week or two, please remember that this has no relevance as to what we think of the asset's long-term viability as an investment.
----------------------------------------------------------------------------------
This Week’s Assets:
- BTC, ETH, LINK, MKR
This Week’s Metric Breakdowns:
- DAA vs. Price Divergence (2-Year Deviation From Mean)
- MVRV Opportunity/Danger Zones
- Exchange % of Supply
- NVT Token Circulation
----------------------------------------------------------------------------------
Bitcoin ($BTC) - #1 Ranked Market Cap
- 7-Day Movement: -5.0%
- 30-Day Movement: +18.9%
- 90-Day Movement: +79.5%
DAA vs. Price Divergence (Long-Term Deviation)

The long-term trend of Bitcoin's daily active address activity continues to be bearish. After an encouraging uptick in address activity, it is, at the very least, out of the light red range that has tended to signify local tops quite accurately since entering this long bearish divergence range. But we have continued to not see an excess of address activity since mid-October. So with the amount of addresses interacting on the BTC network not keeping up with this price rise experienced over the past month, this continues to look like a very bearish metric.
Rating: 1.0
MVRV Opportunity/Danger Zones

Even though the long-term returns for average traders still remain well into the positive territory, we've seen the weekly return actually fall into negative range and monthly return fall back to even returns. This is actually a very encouraging sign that at least a mild short-term bounce could occur. Two weeks ago, this metric was through the roof high for all time ranges, and that meant that there was an extremely high risk in entering the markets while so many average traders had already profited. Now, though still a bit too much positive returns for the 3-month, 6-month, and 1-year timeframes for Bitcoin, the divergence has changed from extremely bearish to just a mild one.
Rating: 3.0
Exchange Percentage of Supply

We love to take a look at how Bitcoin's supply is fluctuating between exchange address and offline wallets as an indicator on how likely some major selloffs could occur. As we announced in a Tweet earlier today, an uptick of +0.08% of Bitcoin's supply being moved to exchanges occurred yesterday, which was actually the highest move upward in 5 weeks. This may not sound like a major amount, but running the math, this accounts for approximately $278M worth of tokens that are now on exchanges that weren't there before. So we're advising to proceed with caution.
Rating: 3.0
NVT Token Circulation

Bitcoin is getting an expected amount of token circulation (unique amount of tokens moving on BTC's network) based on its current market cap. Yesterday in particular was a promising day of high circulation, just like we saw on the daily active address side of things. So far through this first week of December, we still have optimism that there could be a third straight month of a bullish divergence, just like our NVT model accurately projected during October's and November's price explosion.
Rating: 2.5
BTC Average Rating: 2.4 (Bearish)
----------------------------------------------------------------------------------
Ethereum ($ETH) - #2 Ranked Market Cap
- 7-Day Movement: -8.0%
- 30-Day Movement: +24.0%
- 90-Day Movement: +49.6%
DAA vs. Price Divergence (Long-Term Deviation)

Like Bitcoin, Ethereum is firmly in bearish territory still in terms of the amount of unique addresses interacting on the ETH network. It's a bit worrisome to see how long this trend has gone on now, and until anything changes, we continue to advise being cautious given that price and address activity will eventually need to converge to equalize back to 0.
Rating: 1.0
MVRV Opportunity/Danger Zones

The average returns of Ethereum traders are just about in the same position as Bitcoin's, where 7-day investments have been hit hard and 30-day returns are about neutral. Long-term success of Ethereum traders continue to show massive success, though, so waiting until there is a bit more blood in the streets from longer term traders will be the symbol many are waiting for to pounce on a solid entry point.
Rating: 3.0
Exchange Percentage of Supply

Ethereum is still hovering around all-time low levels in terms of the percentage of total supply that is sitting on exchanges. And this is a fantastic sign for bulls. Do keep in mind, though, that many large addresses that were previously counted as ETH addresses, are now being recorded as ETH 2.0 addresses. So there is going to be some skewness in the data.
Rating: 9.0
NVT Token Circulation
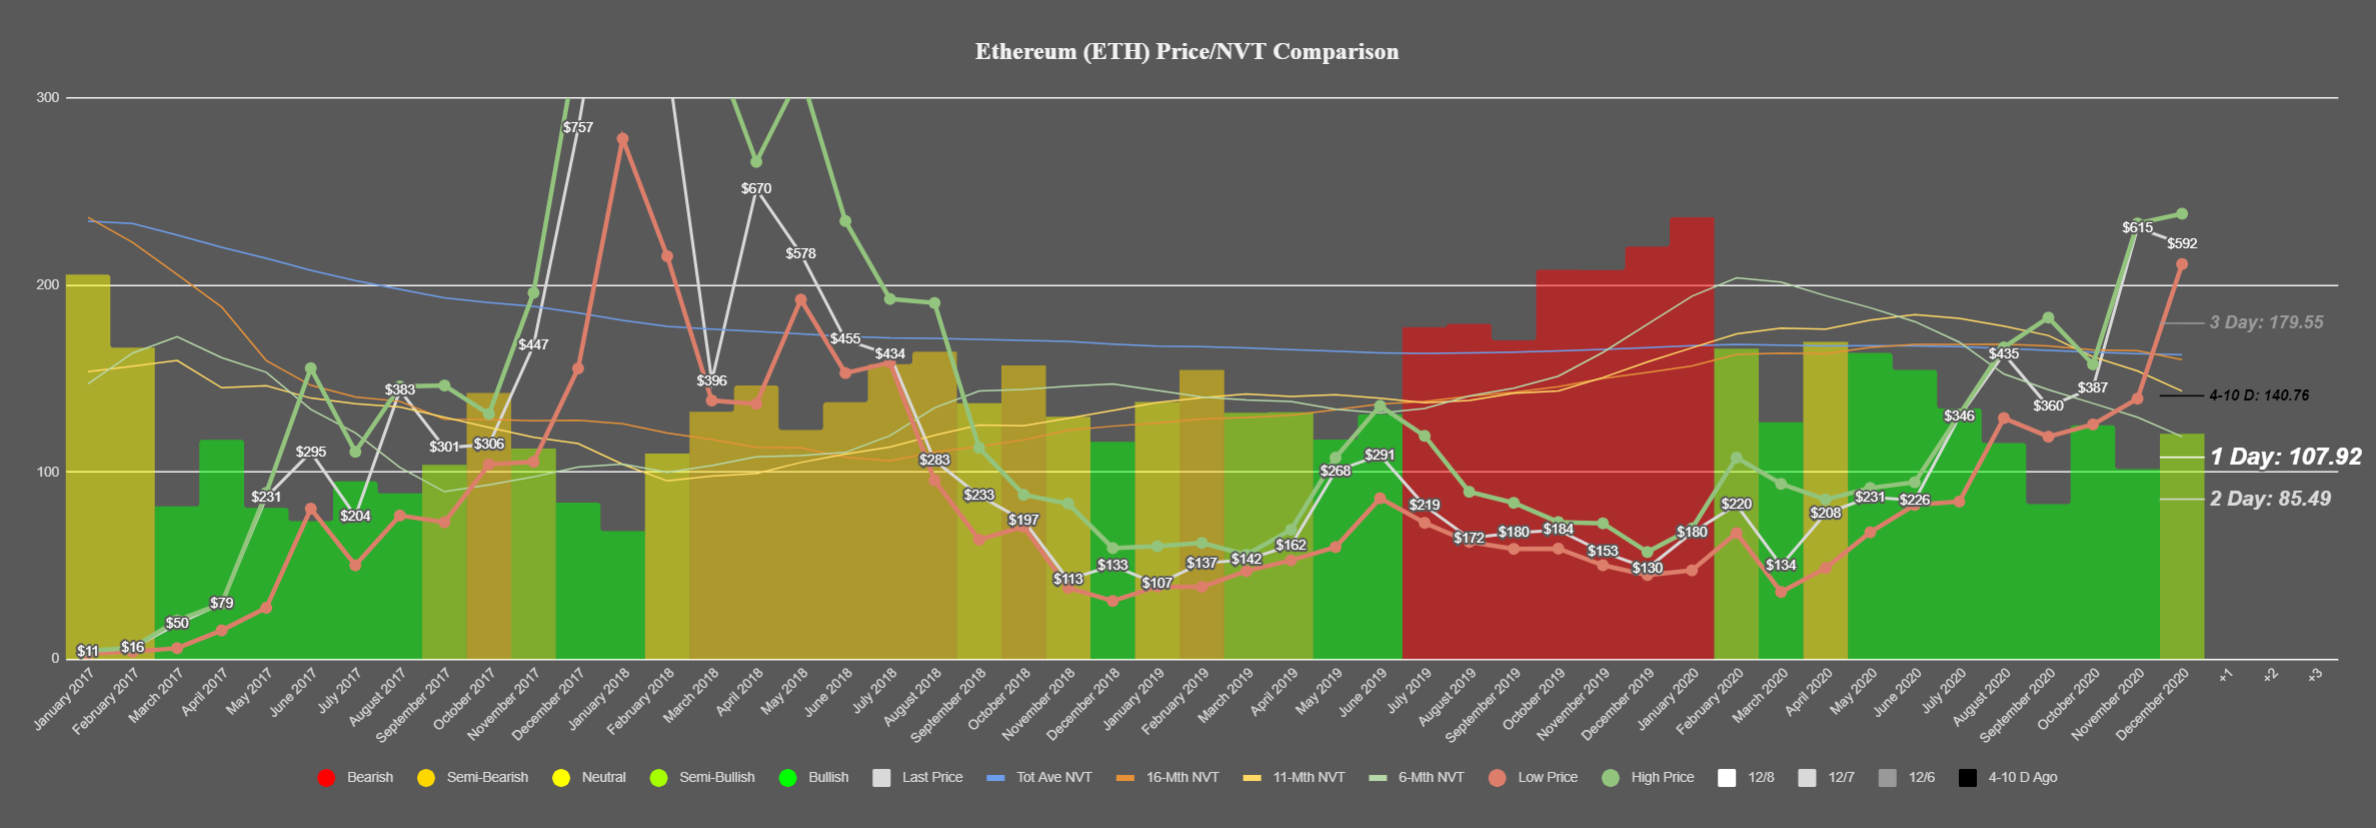
Ethereum's token circulation is showing signs of falling back just a little bit, according to the trendlines on our NVT model. With seven straight months of a clear bullish divergence for ETH, the momentum of token circulation increasing along with price had to give way eventually. Granted, we only have one week worth of December data to work with thus far, there is still a long way to go to see whether this 7-month streak of bright green on our model will finally be broken!
Rating: 7.5
ETH Average Rating: 5.1 (Neutral)
----------------------------------------------------------------------------------
Chainlink ($LINK) - #7 Ranked Market Cap
- 7-Day Movement: -13.9%
- 30-Day Movement: -4.4%
- 90-Day Movement: -4.8%
DAA vs. Price Divergence (Long-Term Deviation)

Chainlink's address activity has been ebbing and flowing fairly dramatically these past couple months, just as its price has. Being in the dark green range for the past four days indicates that we're still on a nice long-term bullish divergence trajectory, but in the previous instances of this range, we've actually seen fairly sizeable corrections. So this is mixed news at best.
Rating: 6.0
MVRV Opportunity/Danger Zones

The average trader returns for LINK are actually converging to hit their lowest average points in quite some time. As one of the major darlings of 2020, part of the massive fanbase for Chainlink can be chalked up to the fact that such a high percentage of their investors have been well into the green throughout the year. But over the past month, traders are actually down an average of -9.4%, which has dampened sentiment slightly. Though this isn't quite as bullish of a signal as we saw in mid-September when LINK temporarily bottomed out, our Danger vs. Opportunity zone model (pictured at the top of this article) has LINK at a +0.26 mean divergence (where +1.0 is as bullish as assets typically get). So this is looking like a potential short-term opportunity.
Rating: 7.0
Exchange Percentage of Supply

The supply of Chainlink currently sitting on exchanges is still at near all-time low levels of 7.24%. LINK traders are notoriously patient and strong-willed with their hodling strategies, so this isn't a major surprise whatsoever. This is a very good sign that there aren't plans to sell off the 7th ranked asset by the Chainlink community any time soon. Just note that Bitcoin could still have other plans for the entirety of the crypto markets.
Rating: 9.0
NVT Token Circulation
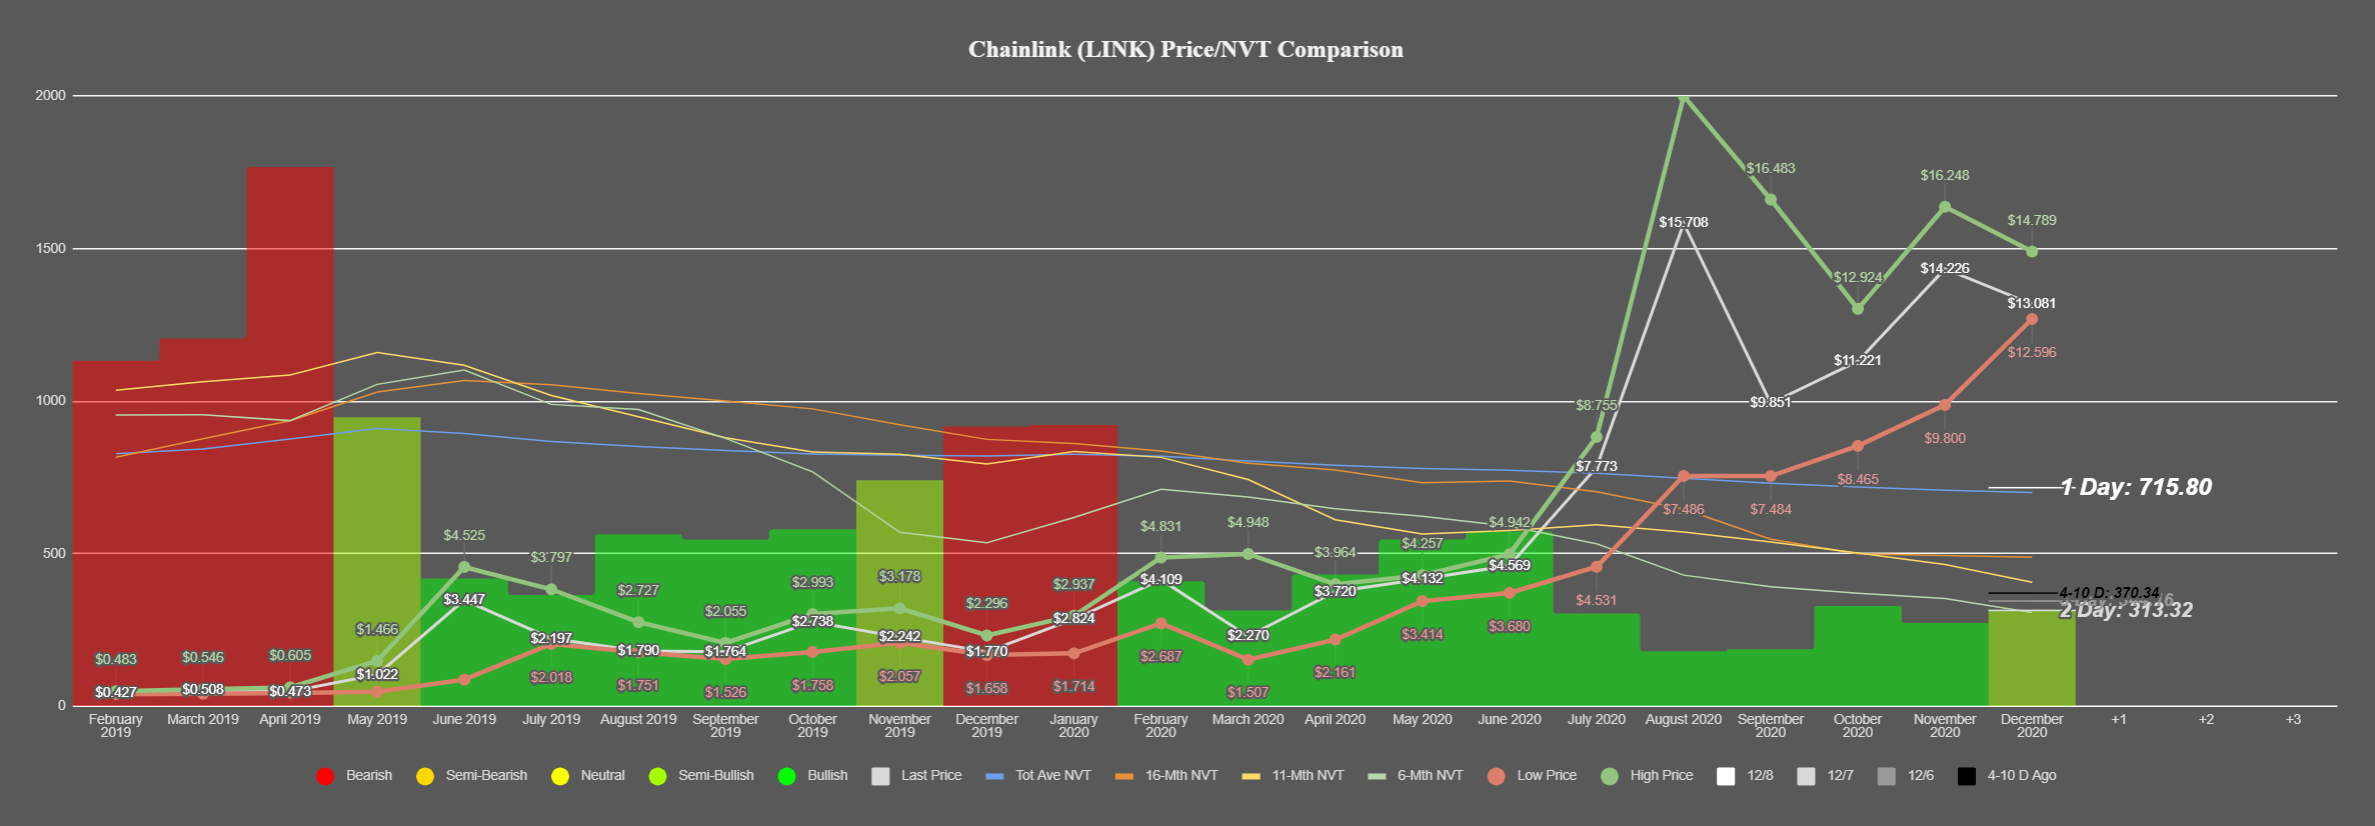
Like we saw with Ethereum above, Chainlink's token circulation is starting to edge down a bit, and prices dropping to $13.00 recently has been a reflection of this. The model has indicated 10 straight months of a bullish divergence with NVT, going back to February. So we will have to watch and see if LINK can pick up and avoid extremely bearish token circulation days like we saw yesterday.
Rating: 6.5
LINK Average Rating: 7.1 (Slightly Bullish/Bullish)
----------------------------------------------------------------------------------
MakerDAO ($MKR) - #43 Ranked Market Cap
- 7-Day Movement: -10.0%
- 30-Day Movement: -5.7%
- 90-Day Movement: -7.3%
DAA vs. Price Divergence (Long-Term Deviation)

Yesterday marked the first day since September 24th that Maker showed a mildly bullish divergence compared to its active addresses transacting on its network. It's impossible to predict whether this is the start of a trend that can continue. But with such a volatile level of price movement over the past couple of months, the MKR community may best want to see a clear price trend in one direction before assessing whether its time to place buy orders again, according to our DAA-Divergence model's advice.
Rating: 5.0
MVRV Opportunity/Danger Zones

September 24th was the last time that all five of these MVRV time ranges were all in the negative range for Maker. This metric is all about waiting for there to be some blood in the streets, and all five of these time ranges, combined with a +0.23 on our model posted at the beginning of this article, is an encouraging sign to justify going against a bearish crowd for the first time in months.
Rating: 7.5
Exchange Percentage of Supply

Well, this isn't great to see. Maker's supply moving on to exchanges has been on a pretty steep move upwards over the past 5 days. The 7.91% of tokens now sitting in exchange addresses is the highest level we've seen since November 1st, when the percentage of supply sat at 8.29%. The consistent rise since last Thursday is a pretty major concern.
Rating: 2.0
NVT Token Circulation

Token circulation for MKR is currently neck and neck with the month of August for being at an all-time high. And thanks to the price of Maker being significantly lower now than it was in August, the signal on our NVT model is even more bullish than it was then. Unique tokens are being moved at fairly unfathomable levels, and for that, the bullishness we have for MKR from this model alone, is at the highest level we can possibly score it.
Rating: 10.0
MKR Average Rating: 6.1 (Slightly Bullish/Neutral)
----------------------------------------------------------------------------------