Bold Predictions XXII - Bitcoin's Price Still Speeding, but Altcoins are Bleeding

SANBASE SIGNALS
November 2, 2020
At the time of this writing, we're just two and and a half days past Bitcoin's push above $14,000 for the first time since January, 2018. The 33-month milestone came as the trading crowd had already been turning overwhelmingly positive after flipping their stance from bearish to bullish after it surged past $13,000 just a week earlier. So this being said, FOMO likely played a factor after new entries and an increase in activity bolstered Bitcoin's price between October 23rd and its inevitable $14,000 cross on October 31st.

The price of Bitcoin is currently at a slightly more reasonable $13,400 currently, and we'll get into why we say just "slightly" as we cover our on-chain and social metrics from BTC and others. But at its peak at approximately $14,100 to close out October, many technical analysis traders were rejoicing at this long-term higher high that just squeaked by the ~$13,700 price high that occurred 16 months ago on June 26, 2019. To simplify this event as an indication that all technical traders became convinced that a continuation to $15,000 and beyond, would be unfair to the many extremely talented traders in crypto. But this cross above $13,700 did have many calling for the $20,000 level reached (or nearly reached depending on the exchange) on December 17, 2017, as the next test.
At Santiment, we obviously put a pure focus on the fundamental side of things through our world-leading comprehensive on-chain and social metrics we offer. And on this end of things, it appears as though prices jumped a little more than the numbers suggested it would under healthy, organic growth. That being said, if you've been with us for a while, you've learned along with us just how irrational and inorganic cryptocurrency can be. So we'll be exploring together just how likely a return to $20,000 can be for Bitcoin, as well as understanding how altcoins can play out alongside it, especially now that it appears the DeFi madness has taken a breath.
We continue to offer 25% off your first month's subscription on any Santiment service you have your eye on! Just take 15 seconds to provide feedback for us on this poll. Then just visit the Sanbase pricing page to get started with your 25% discount now, and enter SIGNALS25 at checkout! Any help needed on redeeming this, just email us at support@santiment.net.
With every weekly volume we release of our Bold Predictions series, we are taking a look at the most recent previous days of our metrics to assess what divergences may be forming to imply future market movement. None of our assessments should be considered investment advice, and we encourage you to explore Santiment's metrics for yourself to formulate your own opinions based on your own trading strategies.
As a reminder, these signals are for traders to assess local tops and bottoms based on historically predictive and backtested leading indicators. Our rating system is simplified on a 0 to 10 scale, with 0 being as bearish as possible and 10 being as bullish as possible. This would mean that a 5 would be neutral and imply sideways movement estimates over the next couple weeks until the next edition. Whether we call a project bullish or bearish for the next week or two, please remember that this has no relevance as to what we think of the asset's long-term viability as an investment.
----------------------------------------------------------------------------------
This Week’s Assets:
- BTC, ETH, KNC, SNX
This Week’s Metric Breakdowns:
- DAA vs. Price Divergence (2-Year Deviation From Mean)
- MVRV Opportunity/Danger Zones
- Development Activity (Long & Short-Term)
- Weighted Social Sentiment
----------------------------------------------------------------------------------
Bitcoin ($BTC) - #1 Ranked Market Cap
- 7-Day Movement: -1.4%
- 30-Day Movement: +26.2%
- 90-Day Movement: +14.6%
DAA vs. Price Divergence (Long-Term Deviation)

Yep, you're indeed seeing this sea of red correctly. The nine consecutive days of neon red territory on the DAA Divergence model indicates that prices are WAY inflated compared to the growth that unique addresses have seen as the price rose to above $14,000 to end October. Now, with a decline quickly back to $13,400, this could be just the beginning of the bleed. November 2nd marked the single most bearish divergence in over a year.
Rating: 0.0
MVRV Opportunity/Danger Zones

The new MVRV 'Opportunity vs. Danger Zone' model available to our Sanbase PRO members has been showing that Bitcoin is not quite across the extreme red dashed line (indicating a historical danger zone for the averaged 1-day, 7-day, 30-day, 90-day, 6-month, and 1-year timeframes for average trader returns), but it is awfully close for comfort. Historically, anything in the negative range for this chart is a worse than average time to get in on an investment. If it reaches -100%, it's a time that has nearly always coincided with a price top. Right now, at -79.6%, Bitcoin is looking a lot like an asset that is about to make a lot of BTC FOMO'ers have a bad time.
Rating: 1.5
Development Activity (Long & Short-Term)

This week, we're looking at development activity for a nice change of pace to the normal on-chain and social metrics we use. Github submission rates in themselves are not the most direct and immediate price reflective metrics, but they do present a nice long-term layout of what's going on with an asset's inner team. For Bitcoin, we can see a clear move in the right direction over the past year, with quite a fair bit of dev. activity parallel to its price. In mid-October when development peaked, Bitcoin saw 183 Github submissions in a single day. Now, it's back to a still impressive, but more reasonable 93.
Rating: 7.0
Weighted Social Sentiment

Weighted social sentiment for all platforms discussing Bitcoin, has been more positive than down. And just as discussed in this article's intro, the swing from slightly negative to extremely positive occurred expectedly when prices began to take off from $12k to $13k, and it peaked right about when the price topped, according to the 30-day moving average illustrated in pink. It's currently looking very positive still, which is a bearish sign.
Rating: 2.5
BTC Average Rating: 2.8 (Bearish)
----------------------------------------------------------------------------------
Ethereum ($ETH) - #2 Ranked Market Cap
- 7-Day Movement: -7.1%
- 30-Day Movement: +6.5%
- 90-Day Movement: -6.5%
DAA vs. Price Divergence (Long-Term Deviation)

Ethereum is still getting red, bearish signals, just as it has consistently since the beginning of August. This three month stretch of lacking address activity isn't a wonderful sign for bulls, but it's at least been in the mild bearish territory, unlike Bitcoin. Still, this trend is likely going to continue unless Bitcoin defies the odds and jumps to $15k and beyond, taking alts with it.
Rating: 2.5
MVRV Opportunity/Danger Zones

Ethereum's in mildly bearish territory, according to the averages of several different MVRV timeframes. Interestingly, the short-term timeframes are looking a bit bullish thanks to ETH's recent retrace along with the rest of the altcoin markets. However, the massive three and six month returns of traders who began their investments post-Black Thursday (when Ethereum fell to $85) are still well into profit. And the markets will have to shake out some of their profits a bit before the waters look safe here again.
Rating: 3.0
Development Activity (Long & Short-Term)

Ethereum's development has been mostly chopping up and down over the past year, but there's a very mild uptrend here that was looking promising until developers cut back on their github submissions toward the end of October. Still, the longer term timescale beyond this one year chart looks extremely reassuring that ETH has no plans of going anywhere.
Rating: 7.5
Weighted Social Sentiment
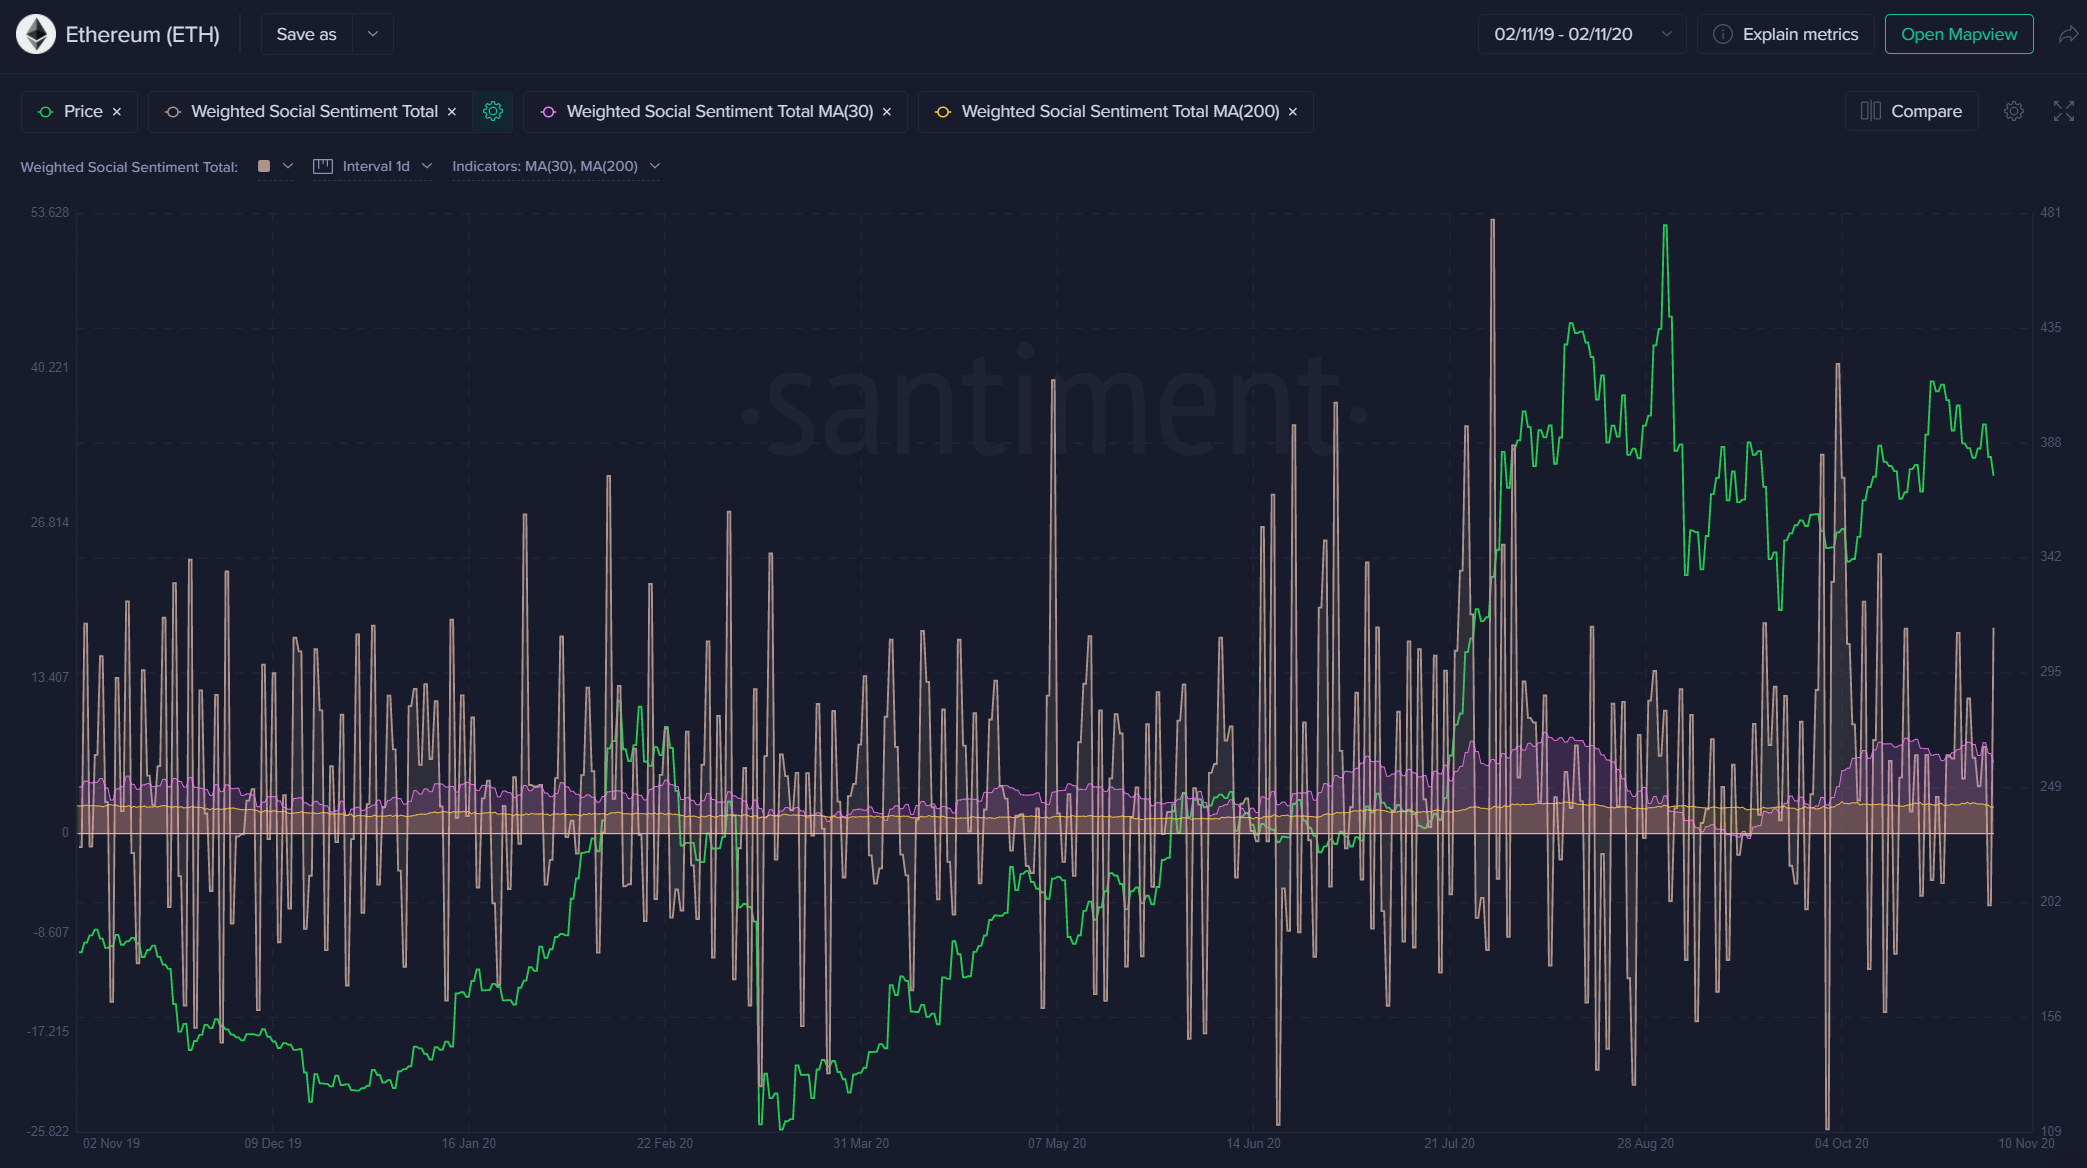
The 30-day rolling average of weighted social sentiment is showing that the positivity toward ETH is still quite high even with short-term traders being well in the red since September's top of $485. There is quite a bit of denial in many chat groups that the price could ever fall back below $300. But the nice thing about Santiment metrics is that we see that there is a fairly decent risk of that. ETH traders are looking rather overly optimistic right now.
Rating: 1.5
ETH Average Rating: 3.6 (Slightly Bearish)
----------------------------------------------------------------------------------
Kyber Network ($KNC) - #71 Ranked Market Cap
- 7-Day Movement: -18.6%
- 30-Day Movement: -20.5%
- 90-Day Movement: -51.9%
DAA vs. Price Divergence (Long-Term Deviation)

Kyber Network has now lost more than half of its market price in the past 90 days. And it looks like the healthy amount of addresses have left as the price has slid down. We'll very likely need to wait until another altcoin & DeFi rush occurs to start recommending jumping back into the mix with KNC, based on this particular model.
Rating: 2.5
MVRV Opportunity/Danger Zones

The good news about a historically well regarded asset like KNC dropping more than half of its value in three months is that buy opportunities via the MVRV metric become ripe for the picking, like it's starting to looks like now. A +76.6% bullish divergence thanks to 90-day traders being well under water means that it's getting close to major no-brainer buy territory. However, we're not there yet, and this model is good about letting our Sanbase PRO users know not to pull the trigger just yet.
Rating: 8.0
Development Activity (Long & Short-Term)

The development activity trend for KNC has been fairly underwhelming, and it appears that its team has descended back to github submission rates last seen in December, 2019. This is certainly not the most enticing looking chart to look at when trying to be encouraged that a project team is working hard behind the scenes.
Rating: 3.0
Weighted Social Sentiment

The 30-day trend for Kyber's weighted social sentiment is just slightly on the positive side, which is somewhat surprising. Social volume is a fairly mixed bag, but it's likely coming for the wrong reasons right now.
Rating: 4.0
KNC Average Rating: 4.4 (Neutral/Slightly Bearish)
----------------------------------------------------------------------------------
Synthetix Token ($SNX) - #42 Ranked Market Cap
- 7-Day Movement: -29.7%
- 30-Day Movement: -42.7%
- 90-Day Movement: -42.6%
DAA vs. Price Divergence (Long-Term Deviation)
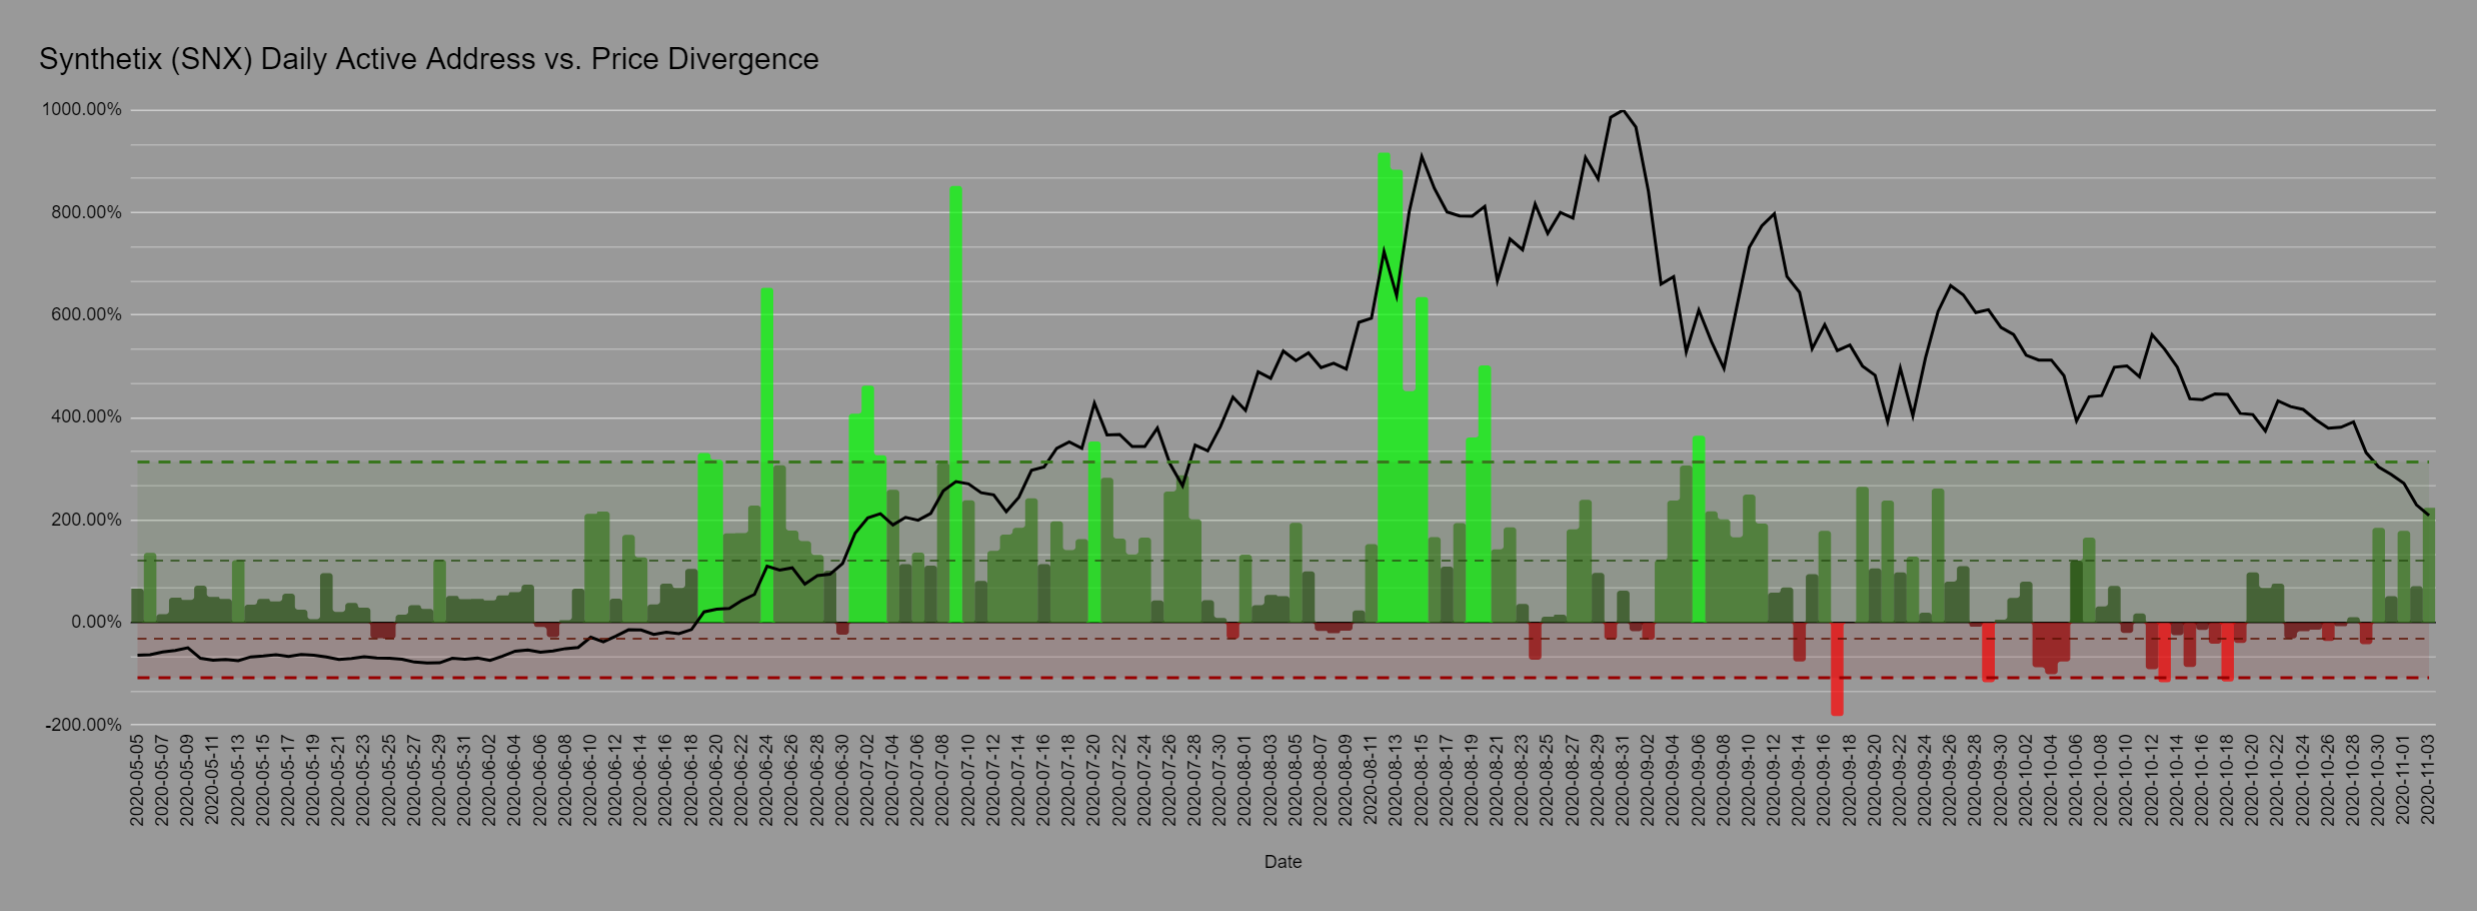
Synthetix has been sliding like the rest of the altcoin universe right now, but the address activity is actually showing some signs of life. Yesterday marked the biggest bullish divergence for SNX since September 25th, and if and when altcoins are finally able to have their moment in the sun again, expect this project to see some isolated pumps.
Rating: 8.0
MVRV Opportunity/Danger Zones

Synthetix is one of many altcoins that has gotten quite hammered since August. And after losing another 30% in market price over just the past week, it's also been one of the biggest short-term droppers. But with this comes opportunity. And with so many SNX traders bleeding big right now, its +68% bullish divergence on this model indicates it could be a great time to take a chance if Bitcoin can stay propped up for a while.
Rating: 8.0
Development Activity (Long & Short-Term)

The Synthetix team has been upping its submission game by a pretty impressive amount over the past year. The team was outputting just 1-3 github submits in early January, and jumping to today, it's now doing between 50-80 daily over the past couple weeks. The recent drop-off is the only reason this isn't a 10/10 here.
Rating: 9.0
Weighted Social Sentiment

The weighted social sentiment has become much less volatile for Synthetix over the last month, which is understandable after its epic summer price climb. It saw some extreme negativity as the price was dropping, but the mood has mostly neutralized.
Rating: 5.0
SNX Average Rating: 7.5 (Bullish)
----------------------------------------------------------------------------------
Conversations (0)