Bold Predictions XXI - Wait, Bitcoin's Going... Up?

SANBASE SIGNALS
October 19, 2020
The long-term negative sentiment toward Bitcoin finally came to fruition over the past two-week cycle... by catching traders off guard and moving up while the crowd waited to catch long positions at lower prices last week. And after prices rose and sentiment edged into positive territory, the price ranged for most of last week. When this ranging happened, traders again began calling for tops, and the price jumped yet again to above $11.7k.

This cycle of consistently catching traders off guard is nothing new to crypto. And with so much disbelief of prices continuing to rise, being the predominant sentiment, we have to investigate what is actually happening from an on-chain perspective for Bitcoin, Ethereum, and other alts. Historically, this above chart implies that price can jump up to $12,000 until the crowd can't resist FOMOing back in. But we still need to see daily active addresses rise, token circulation thriving, and exchanges not foreshadowing massive sell-offs. So check out what our key models are indicating to answer these questions below...
We continue to offer 25% off your first month's subscription on any Santiment service you have your eye on! Just take 15 seconds to provide feedback for us on this poll. Then just visit the Sanbase pricing page to get started with your 25% discount now, and enter SIGNALS25 at checkout! Any help needed on redeeming this, just email us at support@santiment.net.
With every weekly volume we release of our Bold Predictions series, we are taking a look at the most recent previous days of our metrics to assess what divergences may be forming to imply future market movement. None of our assessments should be considered investment advice, and we encourage you to explore Santiment's metrics for yourself to formulate your own opinions based on your own trading strategies.
As a reminder, these signals are for short-term traders to assess local tops and bottoms based on historically predictive leading indicators. Our rating system is simplified on a 0 to 10 scale, with 0 being as bearish as possible and 10 being as bullish as possible. This would mean that a 5 would be neutral and imply sideways movement estimates over the next couple weeks until the next edition. Whether we call a project bullish or bearish for the next week or two, please remember that this has no relevance as to what we think of the asset's long-term viability as an investment.
----------------------------------------------------------------------------------
This Week’s Assets:
- BTC, ETH, OMG, MKR
This Week’s Metric Breakdowns:
- DAA vs. Price Divergence (2-Year Deviation From Mean)
- MVRV Combined Time Frames
- NVT Token Circulation
- Token Age Consumed/Exchange Balance
----------------------------------------------------------------------------------
Bitcoin ($BTC) - #1 Ranked Market Cap
- 7-Day Movement: +3.0%
- 30-Day Movement: +7.6%
- 90-Day Movement: +23.5%
DAA vs. Price Divergence (Long-Term Deviation)

If you're looking at our Daily Active Address vs. Price Divergence model here for the first time and wondering if all of the red bars here are indicating some bearishness for Bitcoin, the answer is... a resounding yes. We could be in the midst of another major bull trap happening after BTC exceeded $11.75k on Monday for the first time since September 2nd. The past 10 days have been dominated by red, bearish signals, which indicate that Bitcoin's historical level of unique addresses is not quite keeping up with the price levels above $11k, let alone $11.7k. These large, bright red bars that occurred this past Saturday and Sunday indicate that the amount of addresses on BTC's network were in the bottom 10% in proportion to price historically over the past four years. It's also worth noting that Sunday's DAA were the lowest single day in nearly four months.
Rating: 0.5
MVRV Combined Time Frames
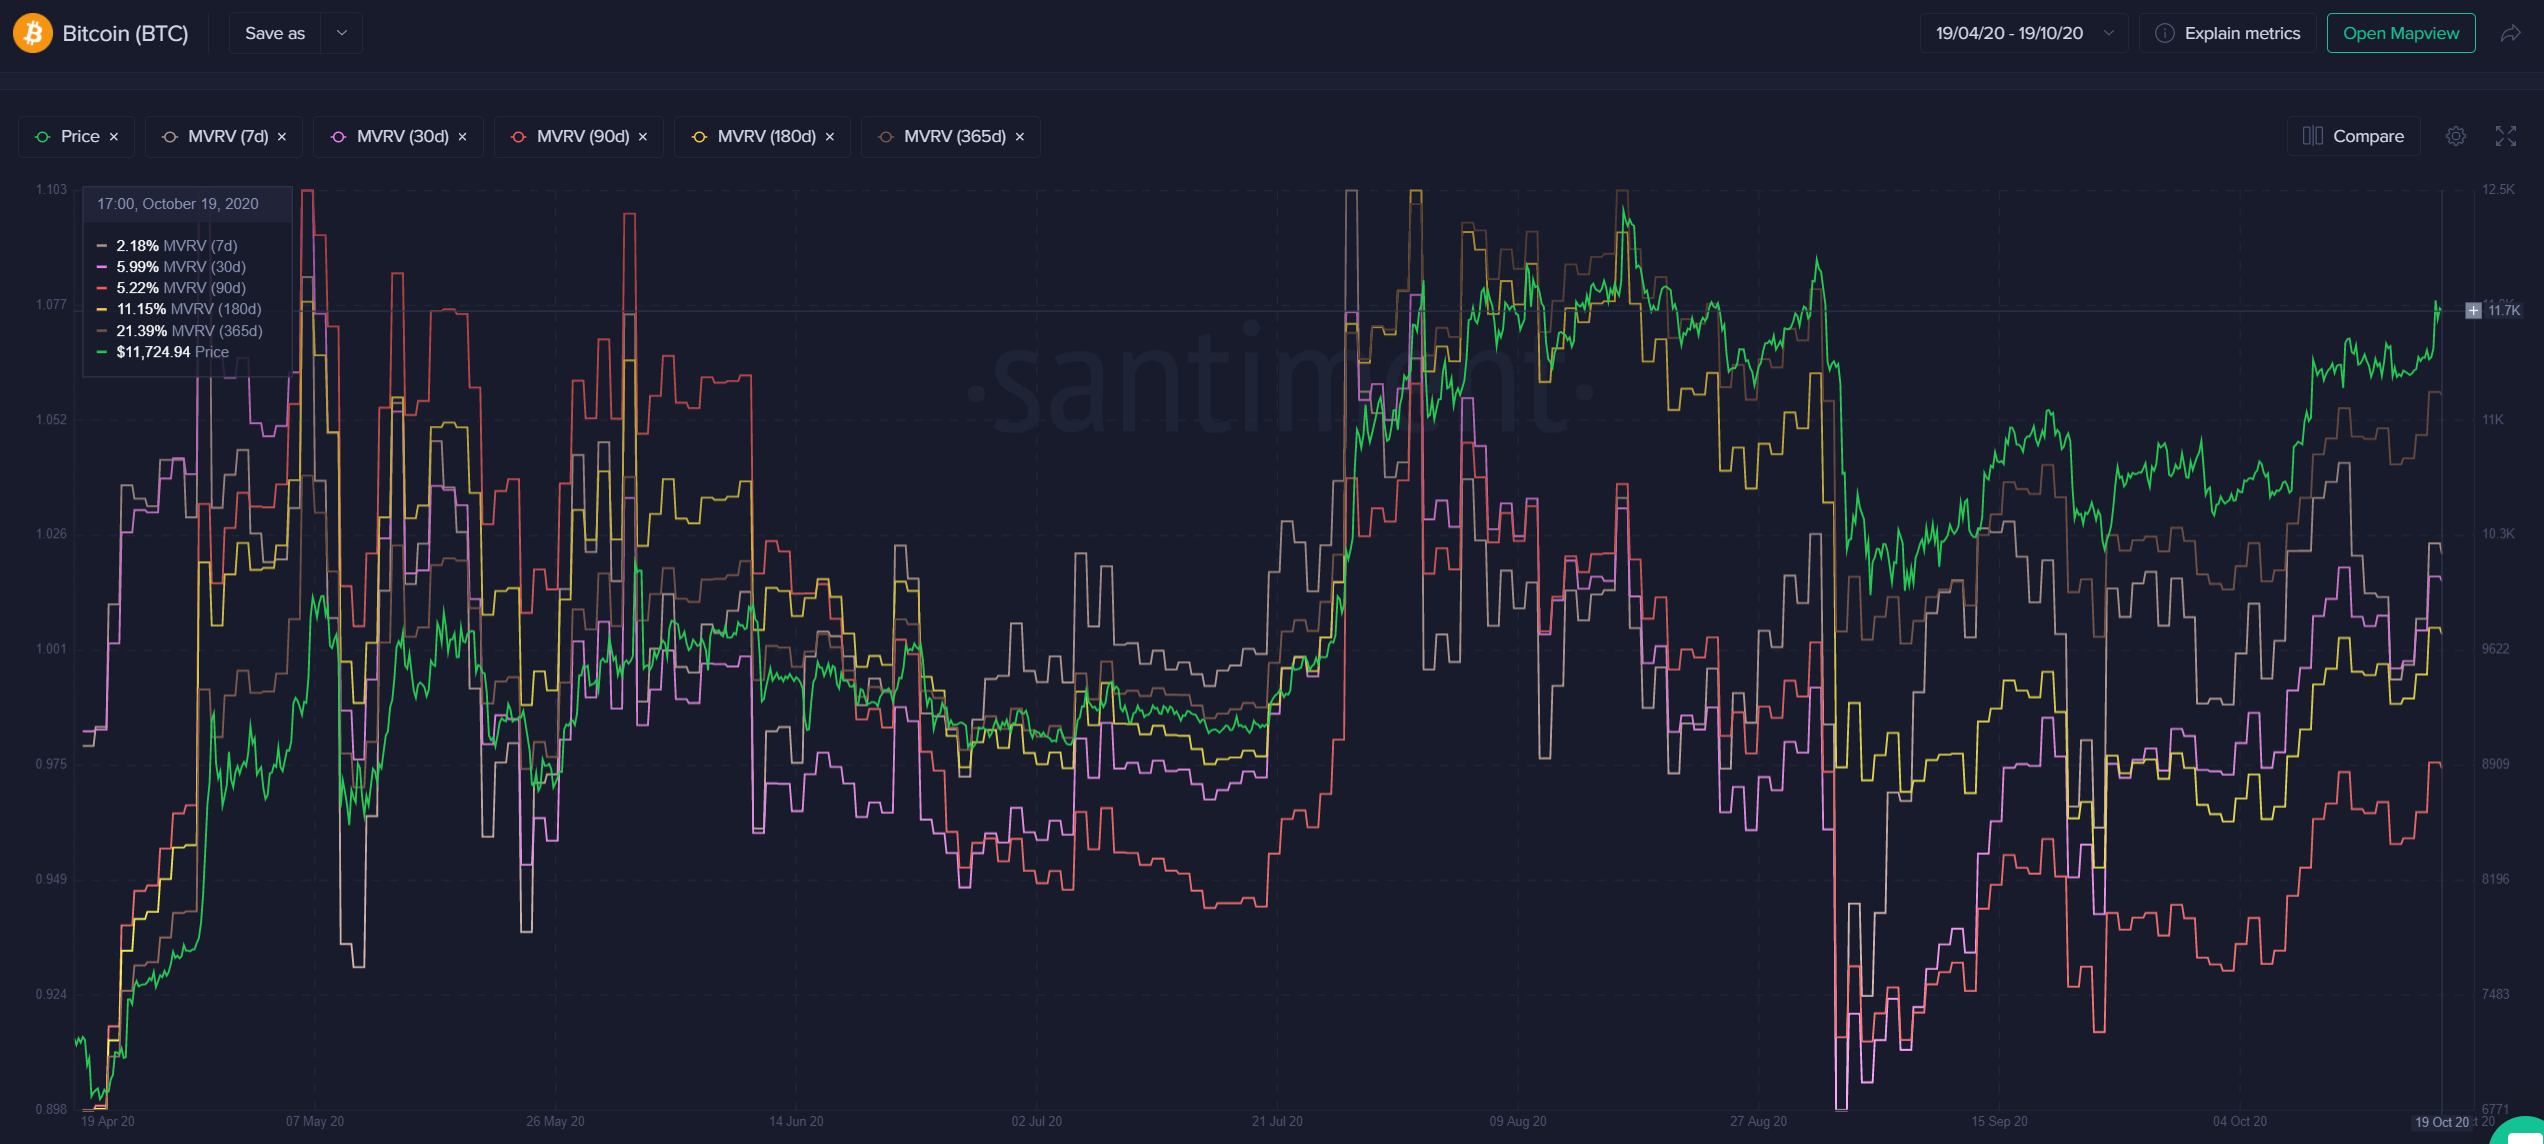
MVRV plays a major part in indicating to fundamentalists whether the crowd is overvaluing or undervaluing an asset at any given time. Anything in the positive means the average traders over the specified period of time are in profit, while anything negative means the average trader is in the red. Currently, the 7d, 30d, 90d, 180d, and 365d MVRV's are all in the positive, but none are really in what we would call the "danger zones" (severely high historical percentages for their respective time frames). For example, +20% or -20% would be fairly common top and bottom MVRV's for 30 days of trading, but Bitcoin's 30-day trading is fairly neutral at +6%. All MVRV's indicating average traders are in the green, however, is still a moderately bearish sign.
Rating: 3.0
NVT Token Circulation
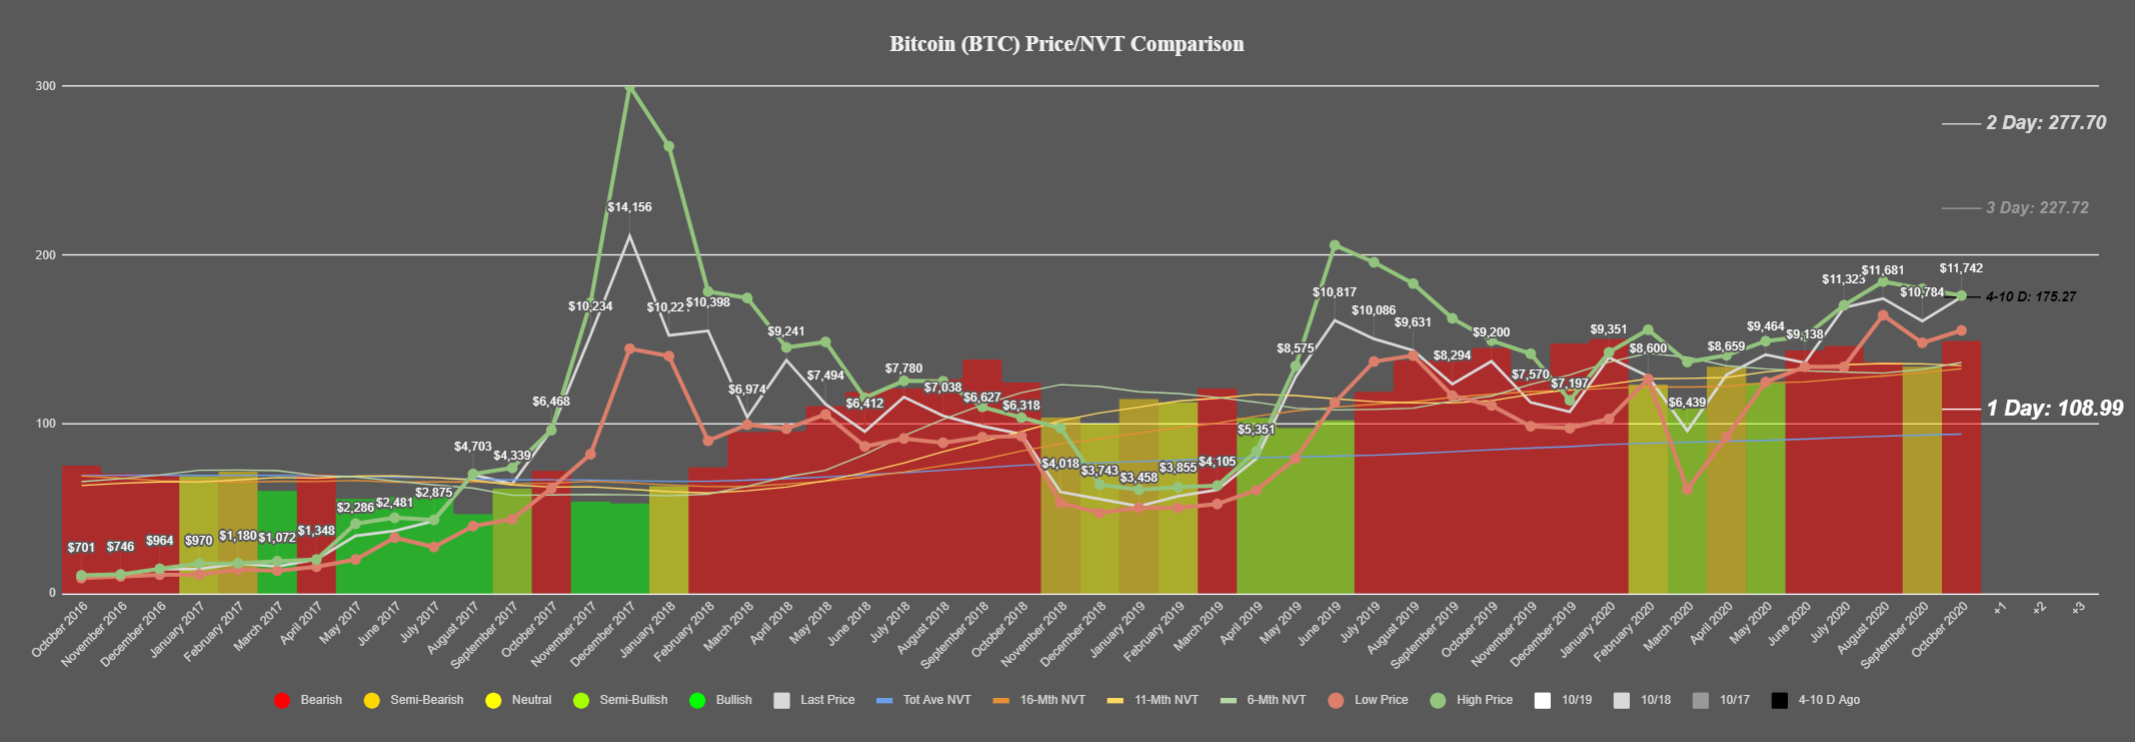
The amount of token circulation occurring on Bitcoin's network is lacking, and it's why our model is indicating that October is on pace to be the 4th month in the last 5 to have a bearish divergence. Monday's token circulation showed a bit improvement, as illustrated by the "1 Day" hashmark being well below the red bar's average for the month of October. But there will need to be a whole lot more improved token circulation days in the final two weeks of October to avoid a bearish projection heading into November.
Rating: 7.0
Token Age Consumed/Exchange Balance

Bitcoin's token age consumed hit a 3-week high yesterday, and spikes in these metrics very often indicate a trend reversal. This particular spike wasn't necessarily high enough to be a massive outlier from BTC's usual day to day age consumed metric. But it was large enough that seeing it coincide with a large "Exchange Outflow" day indicates a slight degree of bullishness for the near future. When funds are moved off exchanges, it's generally a sign that major sell orders are less likely to occur. And vice versa, when exchanges are seeing an increase in funds. When combining the Exchange Funds balance, it's a great two-way indicator to understand the direction the markets are going to react. And right now, this looks to be more good news than bad.
Rating: 7.5
BTC Average Rating: 4.5 (Neutral)
----------------------------------------------------------------------------------
Ethereum ($ETH) - #2 Ranked Market Cap
- 7-Day Movement: -0.7%
- 30-Day Movement: +2.0%
- 90-Day Movement: +44.4%
DAA vs. Price Divergence (Long-Term Deviation)

Ethereum's DAA divergence saw a sudden shift to bullish territory on Thursday and Friday last week, aided by some major DeFi movement. However, once that movement faded, so did ETH's active addresses. As we can see, the sea of red since August has been a major indication that unique addresses transacting on the Ethereum network are still not where they should be (although we're not seeing nearly the deficit that we saw in late August right before the major drop in early September). For now, though, we're considering the two major bullish days as outliers, and continuing to view the divergence as bearish based on the vast majority of the past weeks.
Rating: 3.0
MVRV Combined Time Frames

Ethereum's average traders are in about the same spot as Bitcoin's. Gains throughout different time frames over the past year, but none that would put these MVRV's in top-heavy zones yet. It's still a sign that prices are a wee bit inflated, but they aren't in a territory where it would be alarming to see prices continue moving toward $400 before dropping.
Rating: 3.0
NVT Token Circulation

The NVT for Ethereum is continuing to show bullishness, but note that for the first time in six months, the ratio isn't improving upon the last month (where lower and lower bars equal more and more bullishness. As a result, this is the first month where the month-high price hasn't exceeded the last. We are still above the $360 price level that ETH closed at, though. This is still bullish, but takes a hit for seeing a bit of a drop-off in token circulation since September.
Rating: 7.5
Token Age Consumed/Exchange Balance

Ethereum's token age consumed saw a moderate spike that coincided with a mild downswing, and it's been relatively calm since then. With very little dormant coin movement, volatility should be relatively tame for the time being. Exchange flow balance is also quite calm currently, meaning there is really no push or pull toward the bullish or bearish side from these metrics' perspectives.
Rating: 5.0
ETH Average Rating: 4.6 (Neutral)
----------------------------------------------------------------------------------
OMG Network ($OMG) - #42 Ranked Market Cap
- 7-Day Movement: -5.2%
- 30-Day Movement: +15.0%
- 90-Day Movement: +95.3%
DAA vs. Price Divergence (Long-Term Deviation)

OMG Network holders are a patient bunch at this point, after the gains made after the sudden skyrocketed 3x price in late August (foreshadowed by massive bullish divergences, we may add), have all but vanished with bearish signals ever since. There hasn't really been any neutralization of the divergence between DAA and price as its price has declined back to its $3.35 level it's at now. So address activity has essentially declined fairly proportionally along with price. Expect more downside based on this model, unless there's a BTC or ETH explosion out of the blue.
Rating: 2.0
MVRV Combined Time Frames

OMG Network has actually seen a pretty steep decline on various MVRV time frames, as one may expect with such a massive drop off in a short period time. The 30d, 90d, and 180d average trader returns are all in the negatives, meaning there could be a bit of undervaluation here, especially on the 90-day perspective (currently at a reasonably undervalued -18%). When things do turn positive again for OMG Network, it could have a pretty large rally due to being one of the lower MVRV's of any top 100 altcoin. But there will still need to be some encouraging on-chain events to trigger this.
Rating: 6.5
NVT Token Circulation

OMG Network is currently in "Semi-Bullish territory after spending its last five months firmly as a bullish asset, according to its level of token circulation. Therefore, there is a bit of concern here that prices may not be propelled the way they had been (at least the way they suddenly were in August).
Rating: 6.0
Token Age Consumed/Exchange Balance
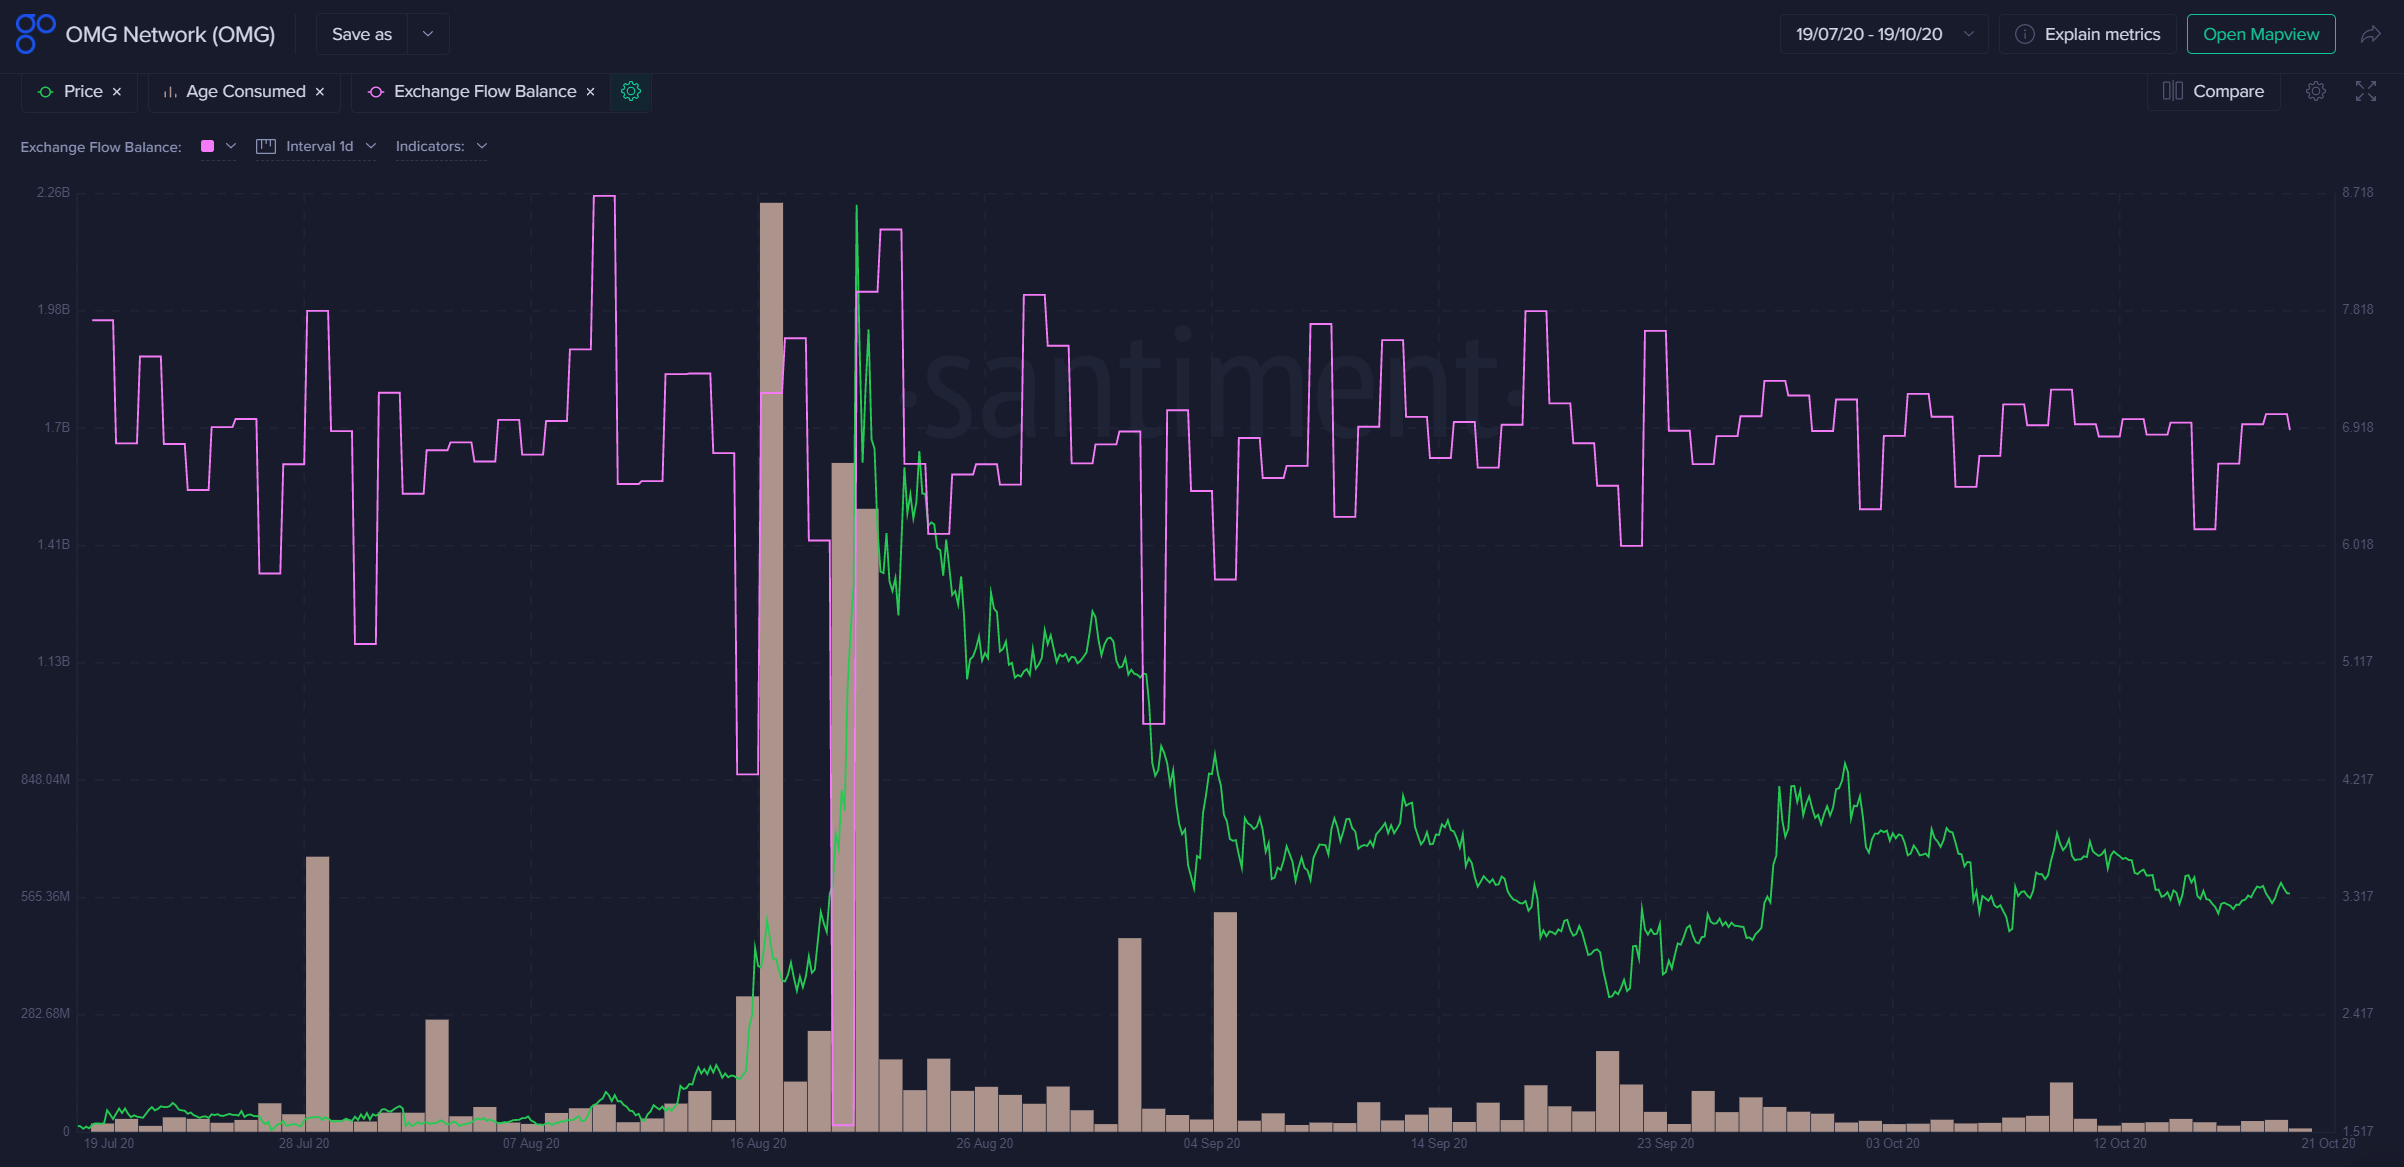
There is very little movement happening with OMG Network's dormant coins, let alone its coins in general. Therefore, volatility should be expected to remain low on the 42nd ranked asset until further notice. Look for a low exchange flow balance day as a sign that a local bottom is in the process of forming, but for now, none is in sight.
Rating: 4.5
OMG Average Rating: 4.8 (Neutral)
----------------------------------------------------------------------------------
Maker ($MKR) - #37 Ranked Market Cap
- 7-Day Movement: +0.9%
- 30-Day Movement: +18.8%
- 90-Day Movement: +14.7%
DAA vs. Price Divergence (Long-Term Deviation)

Maker appears to be due for a price breakout according to its high level of active addresses that have been quite prevalent throughout the month of October. The six consecutive days of extremely bullish DAA from October 1st to October 6th was met with a fairly mediocre price reaction, and its overall level of unique addresses interacting on the MKR network continues to look impressive based on historical levels. We really like the way this model looks for Maker.
Rating: 8.5
MVRV Combined Time Frames

Maker's five key MVRV time frames are all showing positive returns, but they are mostly sitting in "just barely positive" territory. Particularly in the 180d and 365d time frames, where many altcoins are in the double digit positive return territory for average investors, Maker's MVRV is much more neutral at just +4% and +6% territory. There is an argument that this is an indication that the asset is best set up as a "hold for the long-term" type of strategy. But it's still validation that it isn't in major danger, either.
Rating: 4.0
NVT Token Circulation

Other than September, Maker has had nothing but bullish divergences on Santiment's NVT Token Circulation model in 2020. And other than the market-wide drop in mid-March during the pandemic-related Black Thursday event, this has mostly been a pretty good indicator of the direction of Maker's price. October's token circulation of MKR thus far has put it on pace to be the second largest bullish divergence since June, 2019. Combined with its also impressive address activity, this appears to be rather promising as far as the activity happening behind the curtains for Maker.
Rating: 9.0
Token Age Consumed/Exchange Balance

Not a lot of major dormant coin movement for Maker lately, and exchange flow balance has mostly stayed steady as well. With the price mostly in a ranging pattern right now, the next outflow combined with a token age consumed spike will very often be the one to signal that it's buy time. Especially if it's an even larger spike than the one that occurred on September 16th, which coincided with a major outflow (indicated by the pink line dipping).
Rating: 5.0
MKR Average Rating: 6.6 (Slightly Bullish/Bullish)
----------------------------------------------------------------------------------
The surprising return of Bitcoin back to near $12k has many showing a bit of tepidness, unsure whether to profit take or FOMO in more. This hesitation can often be advantageous to altcoins, almost as a stall tactic for many traders, while they wait for whales or key triggers to signify where markets are likely moving to next. Token age consumed combined with exchange flow balance, which hasn't really been discussed much in our previous Bold Predictions editions, are valuable metrics to be watching right now. Expecting the unexpected from assets that aren't being discussed much in crypto circles is a good thing to keep in mind. And as a Sanbase PRO member, we encourage you to check out the models that mathematically identify which obscure assets are likely to pop next based on the models we've discussed here today. Cheers, and we'll see you back for our 22nd Bold Predictions edition in two weeks!