Bold Predictions XIX - If All Dips Were for Buying, We'd All Be Rich!

SANBASE SIGNALS
September 22, 2020
Well, the massive altcoiners had to eventually get punished a bit. The past three months in particular for DeFi projects was beginning to look a lot like the altcoin surge of 2017, which saw any new project with a cool logo instantly receive a major price jump as soon as it hit a semi-major exchange. These days, the same trend has been associated with any project with relation to DeFi. Any in the first three weeks of September, the massive returns for most who have followed the hype train of the latest and greatest DeFi projects, have significantly diminished.
Bitcoin, on the other hand, despite its retrace to its current price of ~$10.5k, has seen an expectedly much smaller dropoff. This is nearly always the case, with many altcoins essentially fluctuating around Bitcoin the same way a 2x or 3x leveraged ETF fluctuates around the S&P 500. However, plenty of metrics are readily available to identify which projects actually merit a dip buy now that prices have come back to Earth around the same ranges we saw between March and May, 2020. We've explored several of our top leading indicators below to take a look at opportunities for Bitcoin, Ethereum, and two other widely discussed altcoins, Aave and OMG Network. Take our analysis not as direct investment advice, as always, but as a guide to identify the likelihood of some price recovery over the next two weeks!
We continue to offer 25% off your first month's subscription on any Santiment service you have your eye on! Just take 15 seconds to provide feedback for us on this poll. Then just visit the Sanbase pricing page to get started with your 25% discount now, and enter SIGNALS25 at checkout! Any help needed on redeeming this, just email us at support@santiment.net.
With every weekly volume we release of our Bold Predictions series, we are taking a look at the most recent three-day averages (or percent changes) for each metric we're covering. As a reminder, these signals are for intra-day traders to assess local tops and bottoms based on historically solid leading indicators. Our rating system is simplified for this week. A 0 to 10 scale, with 0 being as bearish as possible and 10 being as bullish as possible. This would mean that a 5 would be neutral and imply sideways movement estimates over the next week. Whether we call a project bullish or bearish for the next week or two, please remember that this has no relevance to what we think of the asset's long-term viability as an investment.
----------------------------------------------------------------------------------
This Week’s Assets:
- BTC, ETH, LEND, OMG
This Week’s Metric Breakdowns:
- DAA vs. Price Divergence (2-Year Deviation From Mean), MVRV (30-Day), NVT, Weighted Social Sentiment (Twitter)
----------------------------------------------------------------------------------
Bitcoin ($BTC) - #1 Ranked Market Cap
- 7-Day Movement: -2.5%
- 30-Day Movement: -9.7%
- 90-Day Movement: +13.1%
DAA vs. Price Divergence (Long-Term Deviation)

Bitcoin's daily active address have actually had some pretty wild back and forth days since its initial plummet from $12k down to $9.9k three weeks ago. As we see with the green bullish signals from September 4-10, there was an initial abundance of DAA after this drop, indicating a mild recovery at minimum would be likely (which ended up being the case after a bounce up to $11k last week). However, address activity dropped off almost immediately after that price point was hit, and the neon red signal on September 20 essentially signaled the latest drop down to $10.3k. Now, we're back in an essential neutral area, if not still slightly bearish. This isn't the worst opportunity to buy, but considering we're still just mildly in bearish territory on the latest complete day, we might advise dipping your toes in after things begin looking green again.
Rating: 4.0
MVRV (30-Day)

When the average trader sits below 1.0 for any MVRV metric on Sanbase, it means the trader sentiment is below average and a buy is justified from a social metric perspective. With an average return of -3.5% for traders over the past 30 days, it appears there is a very slight justification for being bullish. But keep in mind that there could still be more bleeding to around the -10% to -15% range on this time interval before it really becomes a confident buy range.
Rating: 6.0
NVT (Token Circulation)
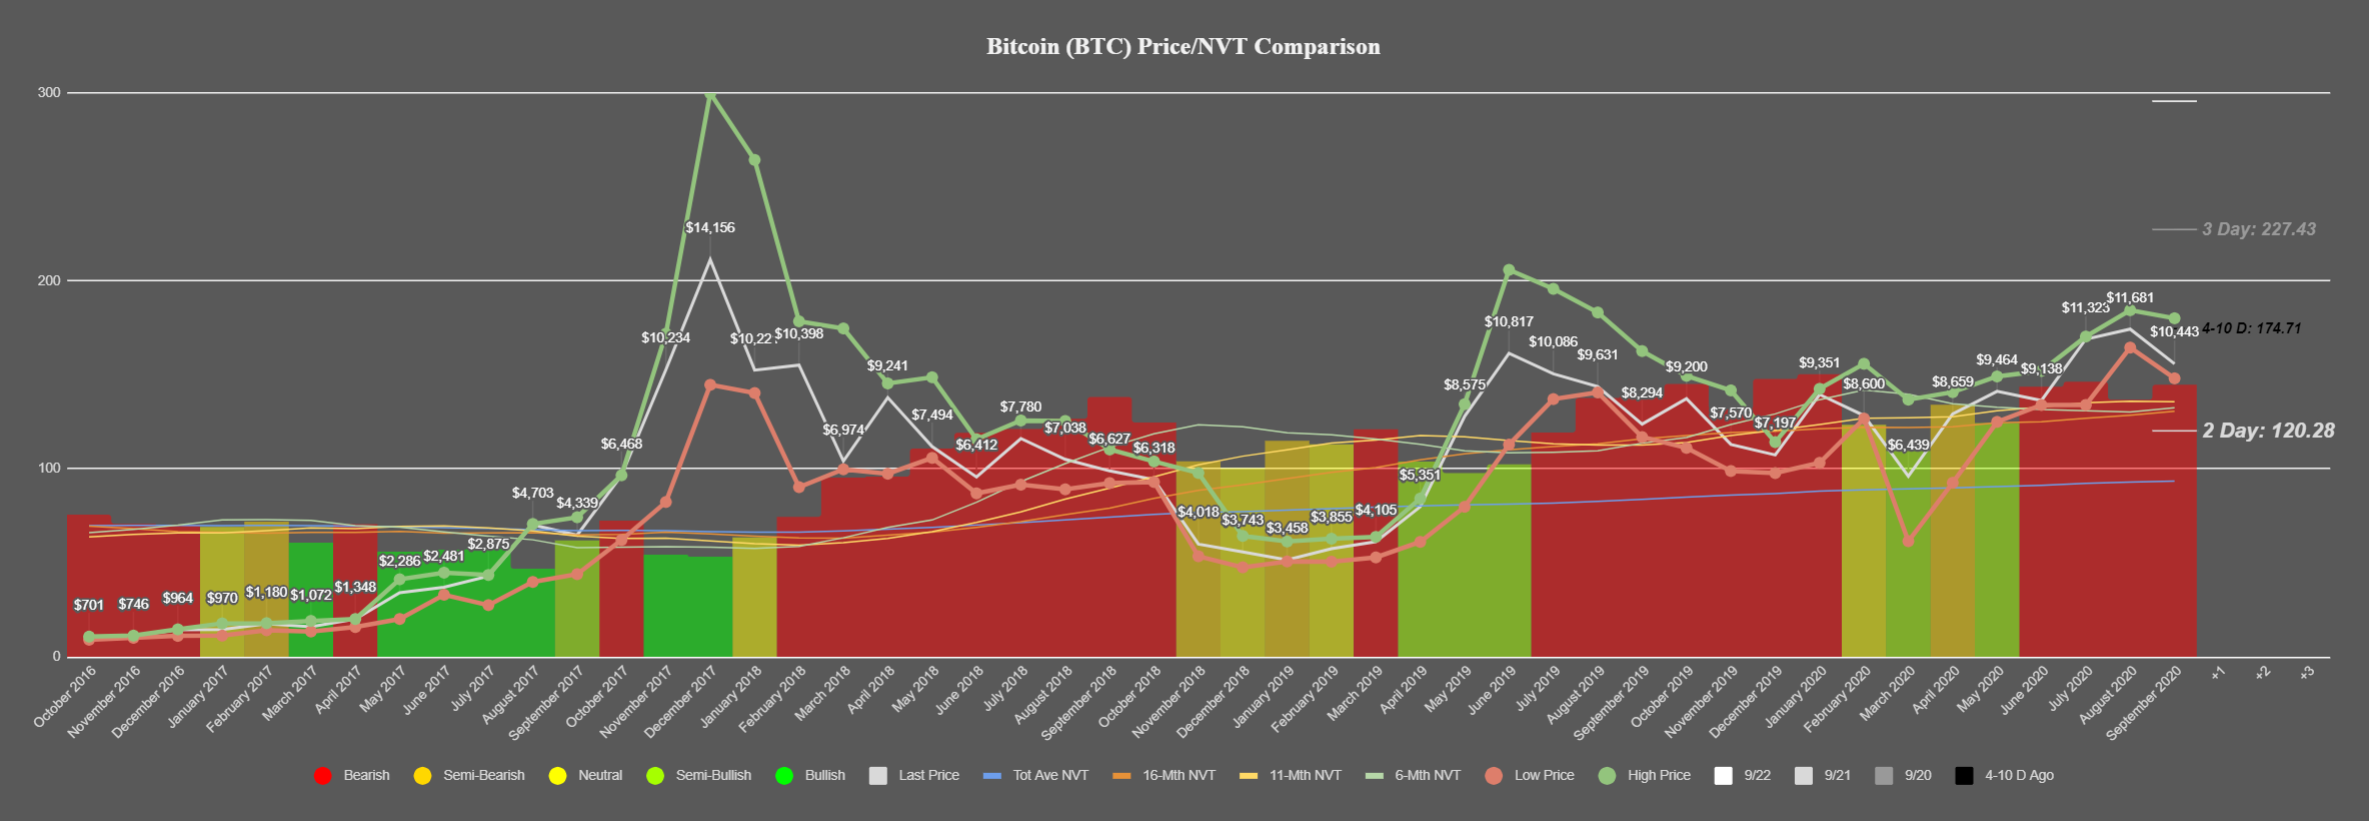
For a fourth straight month, Bitcoin's market cap divided by token circulation (commonly referred to as the most accurate measurement for NVT) is above all historic trendlines, indicating a bearish deficit in trading. Be mindful that the bearish signals in June, July, and August were contradicted by slight price ascensions in each respective month. But looking at history and just how accurate this model usually is at predicting long-term price direction movement, we wouldn't be surprised to see a shaky end to the end of September and beginning of October.
Rating: 2.0
Weighted Social Sentiment

Bitcoin's weighted social sentiment on Twitter continues to hang out at near 2-year low levels. And as those of you who have consistently read this series have learned, when the crowd is especially down (or especially up) about an asset, the opposite tends to occur much more frequently. To put this more clearly, there are a lot of doubters in Bitcoin's price level keeping support at the mid-$10k level. Therefore, whales may see this and capitalize on catching people off guard with a push upward. Just like the other social metric, MVRV, our indicators are pointing to more people than usual being down about BTC, therefore it's a potentially good sign for those willing to go against the crowd here! Just keep in mind that it could be premature to do so yet.
Rating: 8.5
BTC Average Rating: 5.1 (Neutral)
----------------------------------------------------------------------------------
Ethereum ($ETH) - #2 Ranked Market Cap
- 7-Day Movement: -5.7%
- 30-Day Movement: -12.1 %
- 90-Day Movement: +45.9 %
DAA vs. Price Divergence (Long-Term Deviation)

Ethereum's long road of bearish signals finally came to an end at the end of last week, and this was a welcome sign for many ETH traders who dropped ~33% between the $485 peak and $320 local bottom to start off September. Though things have neutralized, when this stretch of bearish signals occur for such an extended period of time, it's important to realize that this trend is much more likely to be taking a break due to the price drop to neutralize the deficit in address activity was happening when prices were edging close to $500. So we still have to view this model as slightly bearish.
Rating: 3.5
MVRV (30-Day)

Similar to Bitcoin, Ethereum traders are under water over the past 30 days. And they're actually down quite a bit, as there were quite a few more that were trapped by the price drop from $485, than those who benefitted from the rise on the way up. At -9.6% in this timespan, this actually looks to be a pretty decent justification to go against the negativity of some burned ETH traders and try and get in with a long at the $340 price level.
Rating: 7.5
NVT (Token Circulation)

Token circulation continues to boom for ETH, and the DeFi craze using Ethereum platforms continues to be the likely explanation. Therefore, this fifth straight month of increasing NVT bullishness could be a bit of an indirect (and misleading) outcome of Ethereum's usage itself. So yes, this is good news to see token circulation thriving for ETH, but for the actual token, it may be a bit more long-term than people expect for the outcome to come to fruition.
Rating: 8.0
Weighted Social Sentiment

Again, just like Bitcoin, people are down on Ethereum big time after the major drop since three weeks ago. And at close to two-year levels, the case can again be argued that going against the crowd can be a very profitable opportunity here if whales decide to catch many off guard. We aren't quite in extreme negative range here, but it's enough to note that there is some seriously negative sentiment happening revolving around the #2 market cap coin.
Rating: 8.0
ETH Average Rating: 6.8 (Slightly Bullish)
----------------------------------------------------------------------------------
Aave ($LEND) - #33 Ranked Market Cap
- 7-Day Movement: -11.2%
- 30-Day Movement: -7.4%
- 90-Day Movement: +280.8%
DAA vs. Price Divergence (Long-Term Deviation)

Aave's DAA vs. Price Divergence chart is pointing to a very likely possibility of a decent bounce, at least in the next 24-48 hours at the time of this writing. By the time this is published, it may have already happened. But considering the neon green signal (indicating a top 10% bullish signal based on the previous two years of LEND's history) is the highest level in nearly a month, this is exactly what our PRO traders typically wait for as validation to buy. Especially as yesterday's market close just started to indicate a small bounce forming.
Rating: 9.5
MVRV (30-Day)

Why yes... LEND's 30-day MVRV really is at a 6-month low currently, and at -24.8% returns over the past month for the average trader, this is the prime kind of setup we typically recommend for those who are believers in social metrics (which we at Santiment certainly are). Whether an imminent bounce is very short-term or not will likely depend on just how many people decide that this is a great dip buy opportunity. But 30-day MVRV's rarely go much lower than about -30% to -40%. And we're very close to that limit.
Rating: 9.0
NVT (Token Circulation)
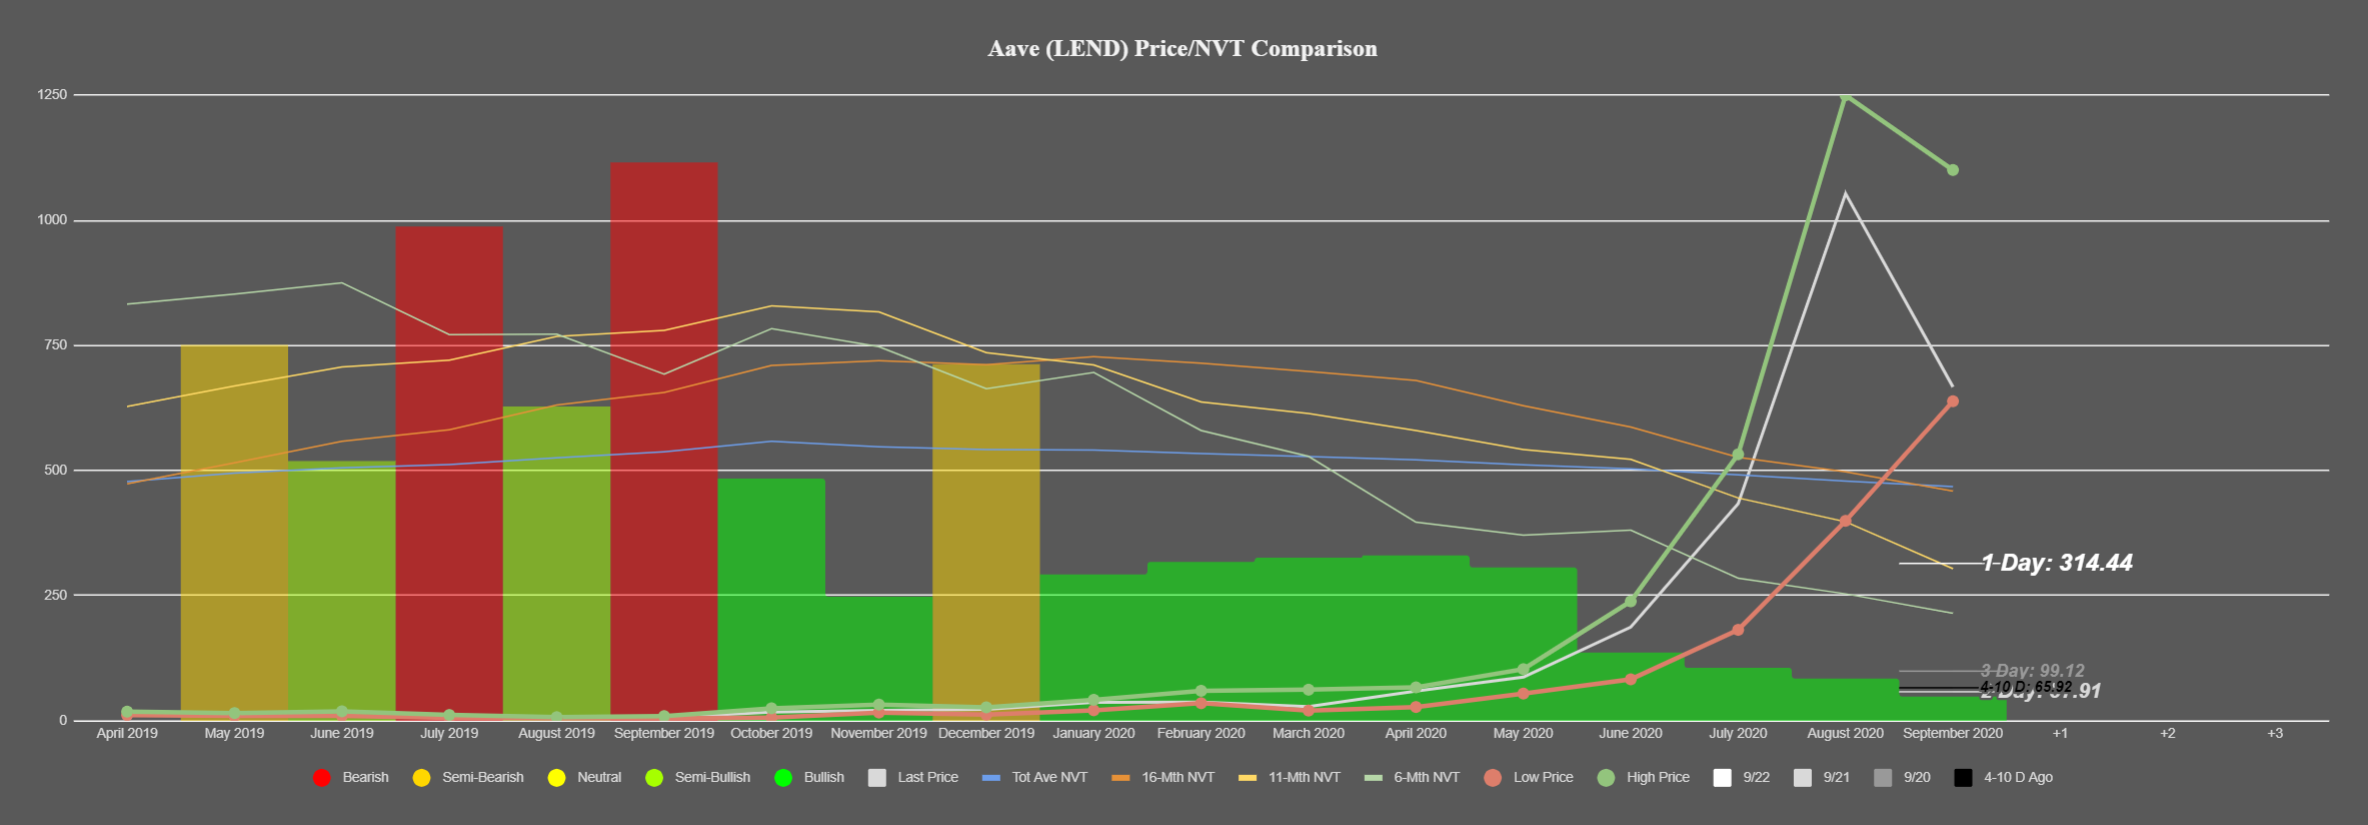
One of the prime lending tokens has benefitted greatly from increased usage during this DeFi craze. And it wasn't surprising at all to see the token really begin to take off in April and May. Those who are fearful that the bubble has burst need only to look at this NVT model and see that the token circulation for the now 33rd ranked market cap asset just continues to increase over time.
Rating: 9.5
Weighted Social Sentiment

After a pretty severe drop-off for one of the altcoins that had gained the most prior to this correction, we're not surprised at all to see that the crowd has become a bit negative with Aave after so many have dropped into negative return territory recently. In fact, we're actually surprised there isn't even more negativity. That being said, it's still a slightly encouraging sign that buying now would be going against the crowd more than the usual historical points in LEND's existence.
Rating: 6.0
LEND Average Rating: 8.5 (Bullish)
----------------------------------------------------------------------------------
OMG Network ($OMG) - #45 Ranked Market Cap
- 7-Day Movement: -12.9%
- 30-Day Movement: -50.8%
- 90-Day Movement: +107.9%
DAA vs. Price Divergence (Long-Term Deviation)

OMG's price chart has looked like a freefall ski slope over the past month. And instead of daily active addresses catching up and making an argument to buy some of the many small to large dips that have occurred since late August, the address activity for the token has fallen in tandem with the price. When altcoins eventually see a couple decent bounce weeks in the upcoming months, OMG Network will likely benefit from that and see some sort of temporary recovery. But it doesn't look like it will be due to its direct activity.
Rating: 2.5
MVRV (30-Day)

As mentioned in the above MVRV segment for LEND, it's pretty rare for a token's 30-day average trader returns to fall more than -30% in this given timespan. But at -37.8% currently, this is exactly what has happened with OMG Network. And it's sadly due to just how many people got caught buying near the top of this major correction. Regardless, from a social sentiment perspective, this is about as prime of an opportunity to go against the crowd until this MVRV at least edges back up to -20% or so again.
Rating: 9.5
NVT (Token Circulation)

It's great to see that OMG is still in bullish territory for our NVT model, but it's actually in the minority for ETH-based, DeFi-related assets that haven't improved upon their token circulation from August to September yet. Studying this chart in isolation would deem it very bullish, but knowing how many competitor tokens (such as LEND and ETH) that have charts that reveal continued improvement, there are still better options than OMG Network from a pure NVT perspective.
Rating: 7.0
Weighted Social Sentiment

Twitter users have been negative on OMG for a couple weeks ago, but interestingly their social sentiment has been neutralizing slightly as people begin to speculate whether a dip buy can finally be merited here after so much bleeding. There is still an overall negative narrative compared to OMG's regular mean of commentary, so buying now would still very much put you in the minority (which is a good thing).
Rating: 7.5
OMG Average Rating: 6.6 (Slightly Bullish)
----------------------------------------------------------------------------------
Due to more and more fundamental knowledge and metrics being used across crypto trading strategies these days. And thankfully, our models continue to accurately assess whether assets are looking overvalued and undervalued. One thing we have been learning ourselves more and more is that the metrics of Bitcoin really do need to be looked at most prominently whenever an analysis of any other asset can be made.
With Bitcoin looking completely neutral at this perspective, this is the time when the undervalued altcoins can really separate themselves from those projects that have been stagnant on their development and really don't have nearly as much significance in terms of what they offer. We encourage anyone who made it to the end of this article to try a month of Sanbase PRO to get access to the models shown in this latest Bold Predictions iteration, as it truly has been proving to help separate profitable traders from the mediocre.
Conversations (0)