Bold Predictions Week XII - Altcoins Continue Having All the Fun

SANBASE SIGNALS
July 7, 2020
DeFi and Mainnet news continue to make headlines, while traders look for any signs that Bitcoin may be finally making a decision on whether to break lower or retest the $10k level once again. For those who have been battle-tested and have learned in crypto for many years, these cycles prove that they are just that... cycles. Often times, the instant the crowd feels that "alt season" is the new reality, the instant Bitcoin "maximalism" begins to dominate once again. And vice versa. Right now, it appears from our behavioral analytics that there is a sense of disbelief and negativity with crypto staying in this 9k range. Meaning that most expect that buying lower for BTC and many other popular assets will be a likely reality again soon. But through our on-chain and behavioral data, as we always do with our Bold Predictions series, we look to explore what is really happening under the hood!
We continue to offer 25% off your first month's subscription on any Santiment service you have your eye on! Just take 15 seconds to provide feedback for us on this poll. Then just visit the Sanbase pricing page to get started with your 25% discount now, and enter SIGNALS25 at checkout!
Any help needed on redeeming this, just email us at support@santiment.net. With every weekly volume we release of our Bold Predictions series, we are taking a look at the most recent three-day averages (or percent changes) for each metric we're covering. As a reminder, these signals are for intra-day traders to assess local tops and bottoms based on historically solid leading indicators. Our rating system is simplified for this week. A 0 to 10 scale, with 0 being as bearish as possible and 10 being as bullish as possible. This would mean that a 5 would be neutral and imply sideways movement estimates over the next week. Whether we call a project bullish or bearish for the next week or two, please remember that this has no relevance to what we think of the asset's long-term viability as an investment.
----------------------------------------------------------------------------------
This Week’s Assets:
- BTC, ETH, LINK, SNX, ZRX
This Week’s Metric Breakdowns:
- NVT (Token Circulation), DAA vs. Price Divergence (Long-Term Deviation), Sentiment Volume Consumed
----------------------------------------------------------------------------------
Bitcoin ($BTC) - #1 Ranked Market Cap
- 3-Day Movement: +1.3%
- 30-Day Movement: -5.2%
- 90-Day Movement: +26.2%
NVT (Token Circulation)

Token circulation has not looked great for Bitcoin for a second straight month thus far, as July's unique tokens moved at these market cap levels implies we're simply "not getting enough steam". If things continue to rise further into the red and well above these trend lines as we progress through July, it will be an even more bearish sign. Two straight months of red on this chart almost always leads to a downward correction.
Rating: 2.0
DAA vs. Price Divergence (Long-Term Deviation)

You'll notice that DAA vs. Divergence model has a new look. Instead of using a 21-day rolling average, we're using more of a long-term "deviation from mean" approach using a two-year scale. Since Black Thursday, the DAA for Bitcoin began to see its first consistent series of red signals in mid-May, and BTC's price has failed to get back to $10k ever since. We saw a bit of noise last week, as DAA hit an all-time high. However, the signal was only able to get above the first hash mark, indicating bullishness, but not a true bottom indicator. We did get a jump up to $9,300 after this, but DAA signals are still mostly just chopping right now. We're about where we should be with DAA, and nothing more.
Rating: 5.0
Sentiment Volume Consumed

Sentiment toward BTC remains fairly negative, and as the ranging in the $9k range has become the norm, so has this level of negativity regarding current price levels. With the crowd expecting a drop more-so than usual, this is a good sign that the price could end up shooting up and faking many out. But with the level still a bit above -1, it isn't the most skewed negative sentiment we will typically see for this scenario to play out.
Rating: 6.5
BTC Average Rating: 4.5 (Neutral)
----------------------------------------------------------------------------------
Ethereum ($ETH) - #2 Ranked Market Cap
Daily Active Addresses vs. Price Divergence
- 3-Day Movement: +4.3%
- 30-Day Movement: -2.5%
- 90-Day Movement: +38.4%
NVT (Token Circulation)

Ethereum has looked a whole lot better than Bitcoin over the last couple months, with bullish signals indicating that it can't wait to explode if BTC can start to look stable itself. Unfortunately, BTC has not been able to break out of this range yet, and as we stated above, it's looking bearish. And from the looks of it, it's dragging ETH with it currently. The first week of July has seen an unimpressive amount of token circulation that leaves a lot to be desired for Ethereum bulls who believe that $500 could come any day now. Regardless, it's a bit early in the month to deem this a slightly bearish signal.
Rating: 5.0
DAA vs. Price Divergence (Long-Term Deviation)

Ethereum's DAA vs. price was showing a great 2-week stretch of a major bullish divergence. Prices had a minor liftoff on Monday, but it just didn't have the staying power that the crowd was hoping. However, since Black Thursday, we continue to see A TON of daily active addresses making moves compared to the price levels we're seeing. Until this changes, we like ETH's chances of at least another mini-breakout in the next week or two as long as BTC holds steady. If BTC begins to climb, this metric indicates that ETH could climb even more.
Rating: 8.0
Sentiment Volume Consumed

Ethereum's negative sentiment is a very recent thing, and it reached near two-year high levels of positivity just three weeks ago. So clearly the #2 market cap ranked token is a polarizing asset, and nobody quite has confidence in where its next trajectory will be. But with things currently looking negative from the crowd's perspective, this is a positive sign for the bulls.
Rating: 7.5
ETH Average Rating: 6.8 (Slightly Bullish/Bullish)
----------------------------------------------------------------------------------
Chainlink ($LINK) - #12 Ranked Market Cap
- 3-Day Movement: +18.8%
- 30-Day Movement: +31.2%
- 90-Day Movement: +81.9%
NVT (Token Circulation)

Chainlink enjoyed five straight months of a bullish divergence from February to June, and it looks like it's working on a sixth. With BTC stable, prices have been given free reign to skyrocket, and unique tokens circulating have just continued on this trajectory upward over time along with LINK's market value. After a great past week, the only thing stopping it is its MVRV long/short diff. You can read more about our predictions on its future price performance in our featured article we dropped just days before its all-time high here.
Rating: 9.0
DAA vs. Price Divergence (Long-Term Deviation)
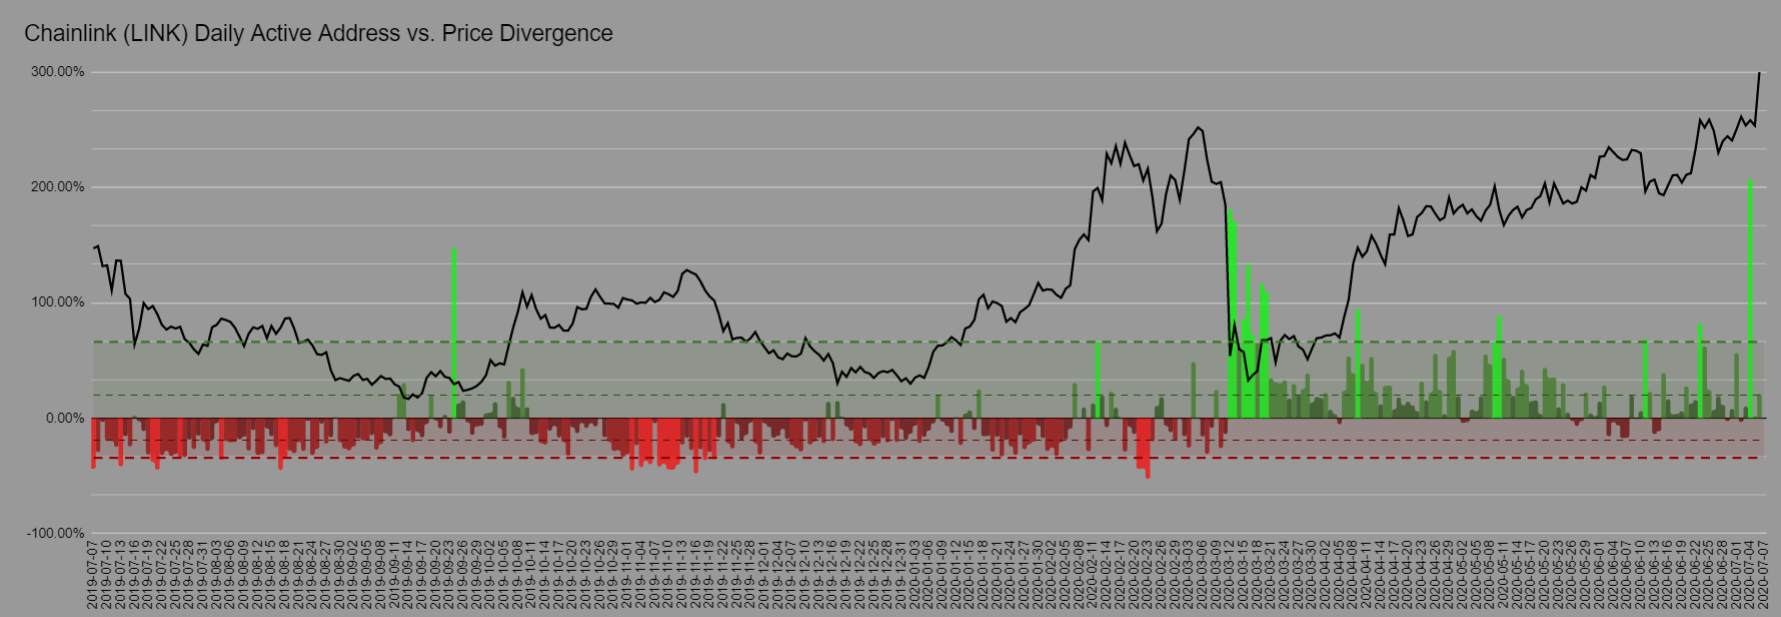
Our DAA vs. Price Divergence model outside of BTC and ETH can admittedly show signs of inconsistency. The lower an asset's market cap, the shorter of a timeframe we have to rely upon, which can lead to inconsistencies. That being said, the 12th highest market cap asset at the time of this writing shows a pretty reliable pattern. Neon greens have correctly predicted future upward movement, and vice versa for neon red signals. LINK recently saw our highest bullish divergence of all-time, and sure enough, the all-time high was breached just days later. We are still seeing low green bars since this time, but they are below the first "bullish" trendline. So we're only barely bullish short-term after such a large upswing.
Rating: 5.5
Sentiment Volume Consumed

Somehow, in spite of LINK's monstrous 82% gain over the past three months, there are an abundance of non-believers when it comes to its current price levels. Sitting below -0.5 on the deviation from mean scale means there is heavy doubt that this rally can continue. In short, this is a good sign that the rally can continue. Negative sentiment has been prevalent since early May, and this has just fueled the fire.
Rating: 7.0
LINK Average Rating: 7.2 (Bullish/Slightly Bullish)
----------------------------------------------------------------------------------
Ren ($REN) - #56 Ranked Market Cap
- 3-Day Movement: +9.3%
- 30-Day Movement: +105.5%
- 90-Day Movement: +244.9%
NVT (Token Circulation)

REN has been the darling of the DeFi assets, as well as a nominee for asset of 2020, alongside the aforementioned LINK. There continues to be no shortage of token circulation, and even after a concerning Monday, where things significantly dropped off, the NVT in July thus far is still under the trendline to match the bullish signal it has seen for 4 out of the 5 months prior.
Rating: 8.0
DAA vs. Price Divergence (Long-Term Deviation)
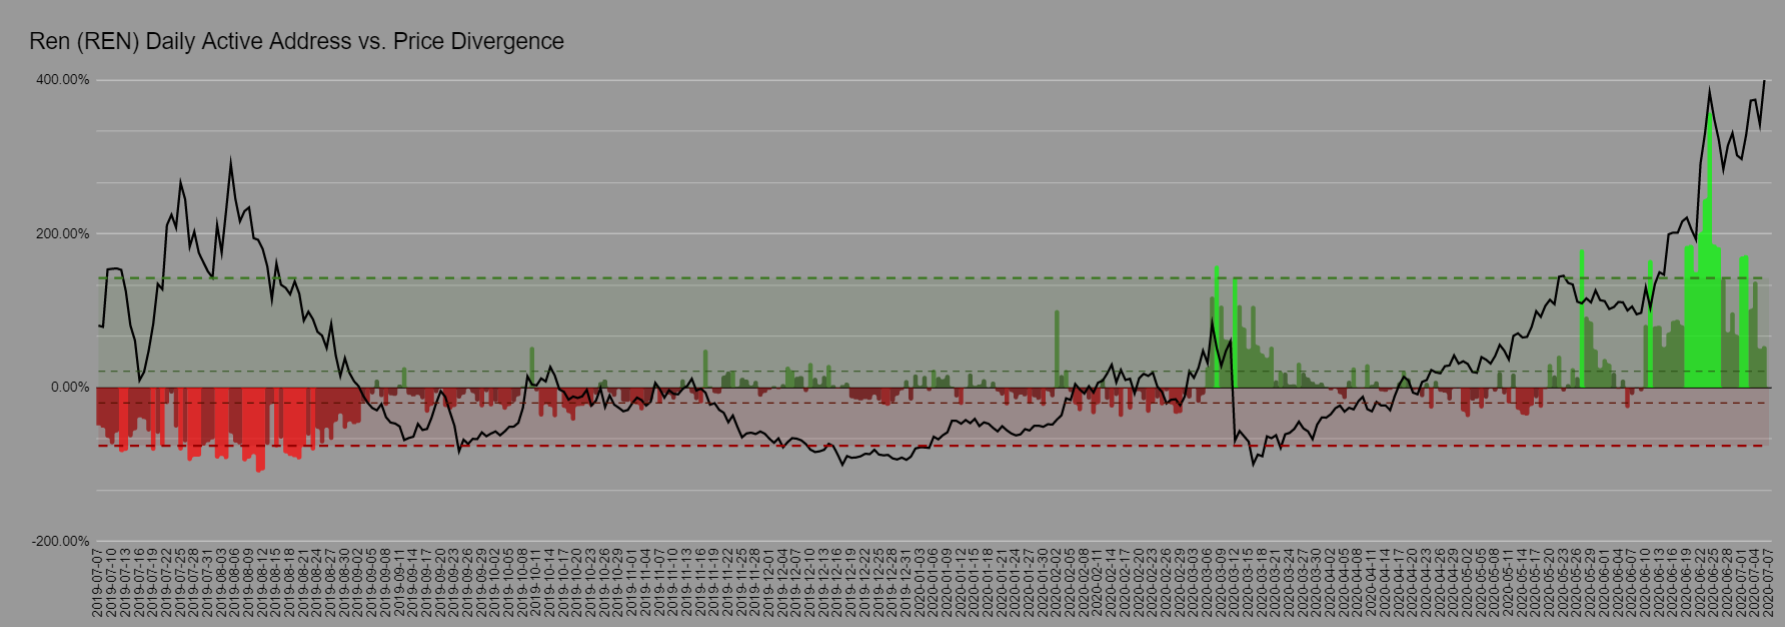
The recent neon green indicators the past couple months were excellent indicators that daily active addresses were going to soon drive up the price. With this price push up to $0.1831 as of this writing, the divergence is STILL bullish. However, we're actually at the lowest bullish levels since the major rally started in early June. Something to keep in mind while we STILL firmly say that REN is bullish on this model.
Rating: 7.5
Sentiment Volume Consumed

REN nearly got to a +2 deviation from the mean in mid-June, which was the highest positive sentiment score we tracked for the 56th ranked market cap asset since late July, 2019. Since this latest positive run-up, there appears to have been a fall-off due to some disbelief that REN could continue going at the trajectory it has been. The asset still has an overall above average sentiment, but it could be falling fast if we have even a slight semblance of the nosedive on the price that we saw a year ago.
Rating: 3.5
REN Average Rating: 6.3 (Slightly Bullish)
----------------------------------------------------------------------------------
Synthetix ($SNX) - #44 Ranked Market Cap
- 3-Day Movement: +5.8%
- 30-Day Movement: +185.4%
- 90-Day Movement: +239.2%
NVT (Token Circulation)

This sea of green for SNX is no illusion. As Synthetix just continues to see more and more token circulation over the past year, the price has finally skyrocketed. It's the 13th best performing asset in the top 100 over the past three months, and our NVT model justifies it nicely. Unique tokens are moving at all-time high levels here in July, just as the case was throughout June.
Rating: 10.0
DAA vs. Price Divergence (Long-Term Deviation)

Concerning signs are actually showing for SNX, and indicating that the local top may have come in. With a third consecutive bearish signal coming in tonight (not pictured), this is the first time we've seen three consecutive days under the average DAA divergence since late February, when Synthetix was well on the decline. No signals have been into the ultra bearish range (pictured in neon red), but we'll be watching out to see if one forms.
Rating: 3.0
Sentiment Volume Consumed

The amount of Synthetix posts isn't really as notable as one might expect for a top 50 ranked market cap asset, but it could just be because it hadn't entered the top 50 that long ago! Ren, for example, gets much more social volume on average. This being said, SNX has actually stayed below its mean in spite of this run-up. Pretty much since May, it has been barely negative, but not really significantly. This lack of movement only verifies that the 44th ranked asset has somehow been a bit under the radar despite its incredible 3-month performance.
Rating: 7.5
SNX Average Rating: 4.5 (Neutral/Slightly Bearish)
----------------------------------------------------------------------------------
It's clear that Bitcoin's ranging in this $9,000 level for over two months now has actually benefited the overall market cap of cryptocurrency. Smaller cap projects continue to break out, and for the health of the asset class, it can be hoped that it will eventually funnel back into Bitcoin so that the alt-season cycle can eventually complete without there being massive corrections and "blood in the streets". Positivity is growing for altcoins, but we'll have to keep our eye on whether things get too positive.
With the new DAA Divergence model at our disposal here in these Bold Predictions articles, we feel confident in spotting local bottoms and tops better than ever before. Keep an eye out for a big dive into how it works, coming to an Insights page near you!