Bold Predictions Volume VIII - It's an Altcoin Party... Who Could Ask For More? Well, Bitcoin Perhaps.

SANBASE SIGNALS
June 10, 2020
Bitcoin and Ethereum have had a week of silence as mid and lower cap crypto projects have really begun to come out of the woodwork. As many are reducing their positions in the top projects to jump on the FOMO trains of some of these surging projects, we will be taking a look at whether signs are emerging that the altcoin rally is coming to an end soon, or whether this is just the beginning of a summer full of altcoin roulette similar to what we saw at the end of 2017. This week, we look at BTC and ETH as always, along with three recent projects that have been making headlines this week, BAT, MKR, and RDN.
As always, we continue to offer 10% off your first month's subscription on any Santiment subscription you have your eye on! Just take 15 seconds to provide feedback for us on this poll.
Then just visit the Sanbase pricing page to get started with your discount now, and enter SIGNALS at checkout! Any help needed on redeeming this, just email us at support@santiment.net.
With every weekly volume we release of our Bold Predictions series, we are taking a look at the most recent three-day averages (or percent changes) for each metric we're covering. As a reminder, these signals are for intra-day traders to assess local tops and bottoms based on historically solid leading indicators.
Our rating system is simplified for this week. A 0 to 10 scale, with 0 being as bearish as possible and 10 being as bullish as possible. This would mean that a 5 would be neutral and imply sideways movement estimates over the next week. Whether we call a project bullish or bearish for the next week or two, please remember that this has no relevance to what we think of the asset's long-term viability as an investment.
----------------------------------------------------------------------------------
This Week’s Assets:
- BTC, ETH, BAT, MKR, RDN
This Week’s Metric Breakdowns:
- DAA vs. Price Divergence, NVT Token Circulation, Sentiment Volume Consumed, Social Volume
----------------------------------------------------------------------------------
Bitcoin ($BTC) - #1 Ranked Market Cap
Daily Active Addresses vs. Price Divergence
- 3-Day Movement: +0.1%
- 30-Day Movement: +13.6%
- 90-Day Movement: +94.9%

We're continuing to see a sea of slightly bearish signals on Bitcoin's DAA Divergence chart, as has been the trend for the past month. Although there is a deficit in daily active addresses compared to BTC's price, it isn't a major deficit, and 0.29 is about the threshold we typically look for to acknowledge a notable signal in either direction. Regardless, the constant red is still a slight concern for BTC's prospects to surge past $10,000 and beyond, according to this model.
Rating: 3.0
NVT Token Circulation
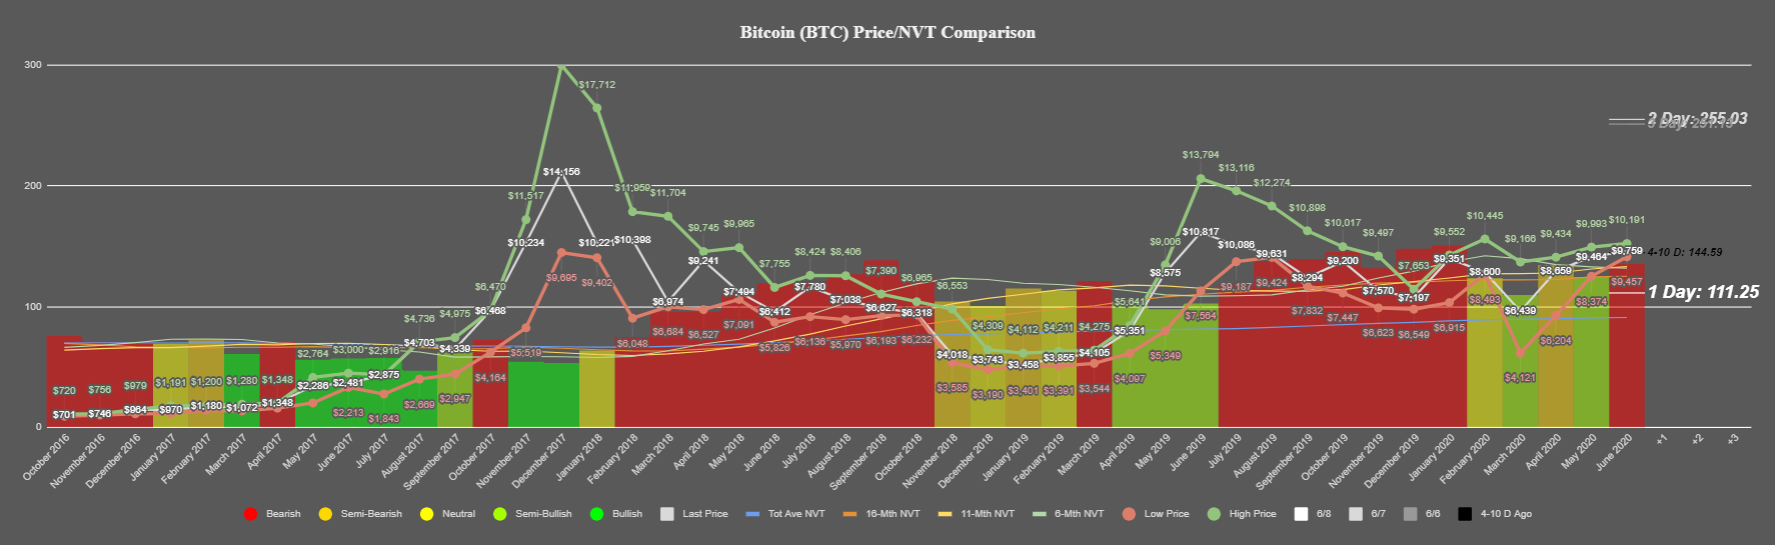
NVT has not looked great for Bitcoin after a promising month of May. The weekend generally has underwhelming NVT performances due to smaller volumes, but that doesn't explain the whoppingly low token circulation Monday that generated one of the worst NVT daily ratios in quite some time. With a red, bearish output through the first 9 days of June, there is some serious concern that BTC may drop without getting some serious support from a needed increase of unique token transactions.
Rating: 2.0
Sentiment Volume Consumed

With so much of the spotlight currently on altcoins, Twitter's sentiment volume consumed has gradually turned into negative territory. An abundance of traders appear to be expecting a drop, and what we've learned about this metric is that the exact opposite can tend to occur. There could be a bit more of a drop, but with standard deviation away from the mean at about -0.5, approaching the coveted -1.0 number for this metric would leave us salivating at a very clear buy signal.
Rating: 6.5
BTC Average Rating: 3.8 (Slightly Bearish)
----------------------------------------------------------------------------------
Ethereum ($ETH) - #2 Ranked Market Cap
Daily Active Addresses vs. Price Divergence
- 3-Day Movement: -0.7%
- 30-Day Movement: +31.0%
- 90-Day Movement: +116.1%

Ethereum's price has been hovering very closely to its daily active address output for the past month, and the previous week has been no exception. No signals have come close to the significant threshold of 0.5 for ETH, and a continued alternating pattern between barely bullish and barely divergences essentially means there are no major divergences here to report.
Rating: 5.0
NVT Token Circulation

Token circulation for ETH has been looking better, compared to BTC. Monday and Tuesday have put out average to slightly better than average NVT ratios based on the #2 coin's current market cap. We have a neutral signal showing for the month of June so far, so we'll have to see whether things continue looking predictably average in terms of token circulation as we get a key week's worth of data for a very slow previous week of almost zero price movement.
Rating: 5.5
Sentiment Volume Consumed

Similar to Bitcoin, Ethereum has slipped into negative sentiment territory with so much focus being pulled away from it as small cap coins fluctuate violently. With a sentiment volume consumed of -0.4, we could see a bit more negativity before it's ultimately looking like a clear buy. For now, things are beginning to look relatively promising, while keeping in mind that the token is going to have some serious skeptics after gaining 116% over the past three months.
Rating: 6.0
ETH Average Rating: 5.5 (Neutral)
----------------------------------------------------------------------------------
Basic Attention Token ($BAT) - #31 Ranked Market Cap
Daily Active Addresses vs. Price Divergence
- 3-Day Movement: +5.4%
- 30-Day Movement: +33.5%
- 90-Day Movement: +114.1%

BAT has been showing some temporary signs of decoupling over the past week, and definitely appears to be forming a legitimate bullish divergence in terms of its daily active addresses. Three of the past four days have been over the 0.5 divergence from mean threshold, meaning that even with its moderate gains over the past week, there definitely can be the potential for more.
Rating: 8.5
NVT Token Circulation

Through the first 9 days of June, BAT is showing its best NVT signal output since November, 2018. Current excitement related to the BRAVE browser and rising prices have just added to the already impressive token circulation of BAT that this model has picked up on as a clearly bullish divergence since February. This is close to as good as it gets on our NVT model for an asset. So unless we see a dropoff back into neutral territory as the month progresses, we will be surprised if Basic Attention Token doesn't see another decoupling from BTC very soon.
Rating: 9.5
Sentiment Volume Consumed

BAT has been mostly on the slightly negative side of sentiment since mid-May, and we'd consider this range of -0.2 a mostly non-factor right now. Prices have surged regardless of much sentiment change, and this is likely because BAT has somehow managed to stay a bit in the background compared to some larger altcoin swings, in spite of its own +114% price jump in the past 90 days.
Rating: 6.0
BAT Average Rating: 8.0 (Bullish)
-------------------------------------------------------------------
Maker ($MKR) - #23 Ranked Market Cap
Daily Active Addresses vs. Price Divergence
- 3-Day Movement: +27.0%
- 30-Day Movement: +117.4%
- 90-Day Movement: +216.9%

Maker's official addition to Coinbase Pro this past week led to a very predictable rise in price and DAA. Interestingly though, as the price has risen, the bullish divergence has actually grown in the past couple of days. This model indicates that MKR is primed to likely see another jump later this week.
Rating: 9.0
NVT Token Circulation

If BAT's NVT model looked almost as good as it gets, then Maker's chart can be notched up to literally as good as it gets. Working on its 8th straight month with a bullish divergence, MKR's June thus far is indicating the best NVT token circulation in its history. Even before the Coinbase Pro announcement, the 23rd ranked project was getting a healthy amount of tokens being circulated on its blockchain, and with the addition on to a major exchange, this should continue to be an absolute home run in this metric's regard.
Rating: 10.0
Sentiment Volume Consumed

In spite of the Coinbase Pro listing, Maker has not really been discussed on Twitter and other social platforms as much as one would expect. If anything, this has worked to the project's advantage, as its surges have come very suddenly and in large doses without much resistance from sellers. Right now, sentiment is more or less neutral, and it will apparently take even more than a +217% rise in the past 3 months to really get the attention of FOMO'ers.
Rating: 5.5
MKR Average Rating: 8.2 (Bullish)
----------------------------------------------------------------------------------
Raiden Network Token ($RDN) - #266 Ranked Market Cap
Daily Active Addresses vs. Price Divergence
- 3-Day Movement: +18.5%
- 30-Day Movement: +106.6%
- 90-Day Movement: +246.4%

Raiden kicked off the work week in a big way, and is up an impressive +18.5% after a major decoupling event from BTC happened yesterday morning. Leading up to this rise, however, we saw a major deficit in daily active addresses, and this divergence compared to price was over -1.0 from its mean (almost hitting -2.0 on Saturday). This tells us that this rise may have been manipulated, and having such a small market cap, it makes sense that some artificial rise may have taken place due to some opportunists taking advantage of low liquidity order books.
Rating: 2.5
NVT Token Circulation

Raiden understandably had a very good token circulation during its surge the past cople of days. But in spite of this, June is still showing a neutral signal on our NVT model. As things normalize, we won't be surprised to see its daily NVT output hitting well above the trendlines and get into semi-bearish territory as people profit take and look at better short-term opportunities.
Rating: 4.0
Social Volume

Raiden's social volume showed a classic spike right at the top of its 8-month price high of $0.246 that it reached yesterday. Now discussion has mostly fallen back to its mean. Although there could be another secondary bounce in the next couple of days, we haven't seen enough historical evidence of consistent social volume for Raiden Network Token to see another community push above the high we've just seen.
Rating: 3.5
RDN Average Rating: 3.3 (Slightly Bearish)
----------------------------------------------------------------------------------
Altcoins are continuing to be the story, and choosing which project to focus on is far from a crapshoot if you've been following along with them on our models and tools. Bitcoin's unimpressive metrics are a legitimate concern, but the overall market cap of crypto is jumping up with so much money pumping into alts right now. So we can't get too worried unless we see some cracks in BTC's armor. But another week of slight bearish signals forming on it could very well flush many of these huge gainers like BAT, MKR, and RDN down the tubes in a hurry. For now though, as long as the #1 market cap coin stays in this $9,500 to $10,000 range, there are some tremendous opportunities out there for many projects besides those mentioned here. Let us know what projects you'd like us to analyze in next week's Bold Predictions edition!