Bold Predictions IX - Was $10K Really Just a Flash in the Pan?

SANBASE SIGNALS
June 16, 2020
After the beginning of June was highlighted by Bitcoin's two pushes above $10k followed by quick retracements, followed by two pushes that couldn't quite make it over this same psychological level, this previous week's theme was more about bear traps and a lesson in patience. A sudden drop to the $9,200's on June 11th shook out an initial wave of panic sellers, and then another drop to the $8,900's on June 14th shook out even more. In both cases, the price of BTC and the rest of the market that subsequently followed, quickly was able to recover. And in the latest drop, the rebound back to $9,500 casually happened without much resistance at all.
Furthermore, the altcoin push that had been starting to become the dominant trend beginning in late May, appears to have resumed as if nothing has happened over the previous two days or so. For now, it appears that as long as BTC remains stable, alts are heading into the summer on a mission to, at the very least, be much more volatile than they have been. If you are going to ride the altcoin train this summer, though, it's important that you are looking at the right ones for the right reasons. We'll be covering two that have been trending up this past week, and these indicators covered can be used to apply analysis to several other projects you have been tracking to find out whether they appear ready to pop, or alternatively are showing good profit taking opportunities to buy back in lower.
As always, we continue to offer 25% off your first month's subscription on any Santiment subscription you have your eye on! Just take 15 seconds to provide feedback for us on this poll. Then just visit the Sanbase pricing page to get started with your discount now, and enter SIGNALS25 at checkout!
Any help needed on redeeming this, just email us at support@santiment.net. With every weekly volume we release of our Bold Predictions series, we are taking a look at the most recent three-day averages (or percent changes) for each metric we're covering. As a reminder, these signals are for intra-day traders to assess local tops and bottoms based on historically solid leading indicators. Our rating system is simplified for this week. A 0 to 10 scale, with 0 being as bearish as possible and 10 being as bullish as possible. This would mean that a 5 would be neutral and imply sideways movement estimates over the next week. Whether we call a project bullish or bearish for the next week or two, please remember that this has no relevance to what we think of the asset's long-term viability as an investment.
----------------------------------------------------------------------------------
This Week’s Assets:
- BTC, ETH, GNT, REN
This Week’s Metric Breakdowns:
- DAA vs. Price Divergence, NVT Token Circulation, Sentiment Volume Consumed, Social Volume
----------------------------------------------------------------------------------
Bitcoin ($BTC) - #1 Ranked Market Cap
Daily Active Addresses vs. Price Divergence
- 3-Day Movement: +0.4%
- 30-Day Movement: -1.7%
- 90-Day Movement: +81.2%

Although Bitcoin initially started off the week with a minor rising bullish divergence in DAA, its usual trend of a mild bearish divergence eventually took over. With its key threshold of being about +/-0.29 in order to be of notable significance, we are watching carefully to see if we start creeping close to this level. The closest we've gotten to this "danger zone" was May 20th when BTC's DAA vs. Price divergence reached a deviation of -27.5. Currently at -17.7, we are somewhat close to this range, but we are still in the realm of normalcy for now.
Rating: 4.0
NVT Token Circulation

June's Bitcoin token circulation NVT continues to not look great, and we are well into bearish range now. Most of the past 10 days have indicated that we have been experiencing a downswing in token circulation, and this seems to be a sign that traders are uncertain with so many fakeouts attempting to break $10,000, followed by quick retraces. The bounce off of $8,900 this past weekend was impressive to see, but it didn't come with a tremendous amount of unique volume like we would hope to see.
Rating: 2.0
Sentiment Volume Consumed

The Twitter sentiment volume consumed for Bitcoin remains rather low, and based on the past two years of history, it doesn't get much lower for the #1 market cap ranked coin. The lowest BTC's sentiment has turned negative during this timeframe was approximately at a -0.88 deviation from the mean. We are currently sitting at a -0.52, which means traditionally buy opportunities may be imminent. But of course, we need to remind our readers that social sentiment is only one of many metrics, and there could still be a bit further to fall. Regardless, we like to see when the crowd has turned negative, as this has historically been the territory when bottoms begin to emerge.
Rating: 7.5
MVRV Long/Short Diff.

With Bitcoin's MVRV Long/Short Diff. at its highest level since pre-Black Thursday back in March (+4.5%), it may have marked the end of the window to buy low after a 3-month surge for BTC (and much of crypto) that surprised many. Historically, this metric intends to show when average investors are at their most extreme returns as an indication for tops and bottoms, and this can be more or less treated as neutral. But considering how much BTC has risen, and the way the curve is starting to flatten out, we wouldn't be surprised to see the MVRV start to head back toward 0% in the coming week or two.
Rating: 4.0
BTC Average Rating: 4.4 (Neutral/Slightly Bearish)
----------------------------------------------------------------------------------
Ethereum ($ETH) - #2 Ranked Market Cap
Daily Active Addresses vs. Price Divergence
- 3-Day Movement: -2.1%
- 30-Day Movement: -1.9%
- 90-Day Movement: +104.1%

Ethereum's, like Bitcoin, is just barely in bearish divergence territory for its DAA, and ETH has actually been one of the least volatile projects out there in June thus far. It appears to be staying very attached to BTC's fluctuations right now instead of trading independently the way it was in May. Until this changes and a mild decoupling occurs, we expect this trend of heavily neutral signals to continue.
Rating: 4.5
NVT Token Circulation

ETH's token circulation has looked slightly less bad than BTC, but this isn't really saying a whole lot. In the same case, we are seeing a concerning lack of unique tokens being moved on Ethereum's blockchain, and this is a traditional top sign to watch out for. That being said, things are still in the semi-bearish range according to our NVT model, and there can still be some signs of a turnaround, with Monday's NVT having its best day in June thus far, well below the trendlines. We will need to see a few more of these in a row though to be convinced that ETH is ready to rally back toward $250 and beyond.
Rating: 3.5
Sentiment Volume Consumed

Unlike Bitcoin, Ethereum has actually seen its Sentiment Volume Consumed on Twitter turn back to positive, if just by a hair, over the past week. While most are discussing BTC's potential of topping after its failed attempts to reach $10,000 this past week, ETH traders have been fairly silent compared to these past couple of months. Opinions of the #2 ranked token appear to rest on what the rest of the markets are doing, so small fluctuations right around its regular mean in sentiment will probably continue to be the expectation.
Rating: 5.0
MVRV Long/Short Diff.

Ethereum's MVRV Long/Short Diff. has actually surpassed its 2020 high, and is at its highest level since September, 2019. This is a pretty big deal, and it's an indication that the average trader is quite content with their +16.0% returns. The last major MVRV Long/Short Diff. top was at about +40%, so historically there could still be a bit more room before whales begin to capitalize on too many ETH investors being in the green, but it is still a bit concerning to see that we are at 9-month highs right now for this important metric.
Rating: 3.0
ETH Average Rating: 4.0 (Slightly Bearish)
----------------------------------------------------------------------------------
Golem Network Token ($GNT) - #96 Ranked Market Cap
Daily Active Addresses vs. Price Divergence
- 3-Day Movement: +2.6%
- 30-Day Movement: +28.6%
- 90-Day Movement: +96.7%

GNT has been a sneaky low market cap ERC-20 project that has continued to rise even with BTC and ETH flattening out over the past couple of weeks. Up 28.6% in the past month, it appears that its daily active addresses have not quite kept up with its price. For most altcoins we look at a threshold of +/-0.5 as a divergence of significance, and Golem Network Token's chart has seen three negative spikes of at least this amount. On June 13th, this divergence reached -0.75, which is a big concern, and even though we're back at -0.26 on the latest date, this negative divergence is still something to watch out for.
Rating: 2.5
NVT Token Circulation

Token circulation for Golem Network Token has been booming under the radar, as other altcoins like KNC, REN, MKR, and STORJ have been getting much higher price spikes and social volume. But GNT is matching the all-time high NVT output it saw in February and March, and Monday was another promising sign that the health of the network is only getting better. Combine GNT's strong NVT June thus far with the fact that the 96th ranked market cap project is seeing its 6th straight month of a bullish signal, and we have to feel pretty good about Golem's upcoming prospects if BTC can stay steady.
Rating: 9.0
Sentiment Volume Consumed

Once outside of the top 75 projects or so, the Sentiment Volume Consumed has to be taken with a slight grain of salt. However, there is still some significance to Golem and its 96th ranked value being back in the negative territory in spite of almost doubling in the past three months. It's clear that many have doubts about Golem and several other small caps being able to keep up its overwhelmingly impressive momentum since Black Thursday. And if too many people believe that the steam has run out, the opposite result generally comes to fruition. This level of about -0.3 would not really constitute an overwhelming majority, and we will really start to get bullish about the negative social sentiment if things fall closer to about -0.75. For now, this metric just indicates slightly promising signs.
Rating: 6.5
MVRV Long/Short Diff.

Yes, you're reading GNT's chart right that it has been almost entirely in the negative territory for the past two years after the average investor has been in the red for it since mid-July, 2018 (outside a very brief visit into positive territory for about a week in July, 2019). After essentially doubling its price in the past three months though, Golem's average trader is within striking distance of breaking even again, relatively speaking. Only being down -14.9% is a major accomplishment based on a low of about a -83% average return just 14 months ago. Despite traders coming such a long way, there is still room to grow for GNT traders, and this is one of the few projects in the top 100 that can make this claim.
Rating: 8.0
GNT Average Rating: 6.5 ( Slightly Bullish)
-------------------------------------------------------------------
Ren ($REN) - #65 Ranked Market Cap
Daily Active Addresses vs. Price Divergence
- 3-Day Movement: +17.5%
- 30-Day Movement: +37.4%
- 90-Day Movement: +267.9%
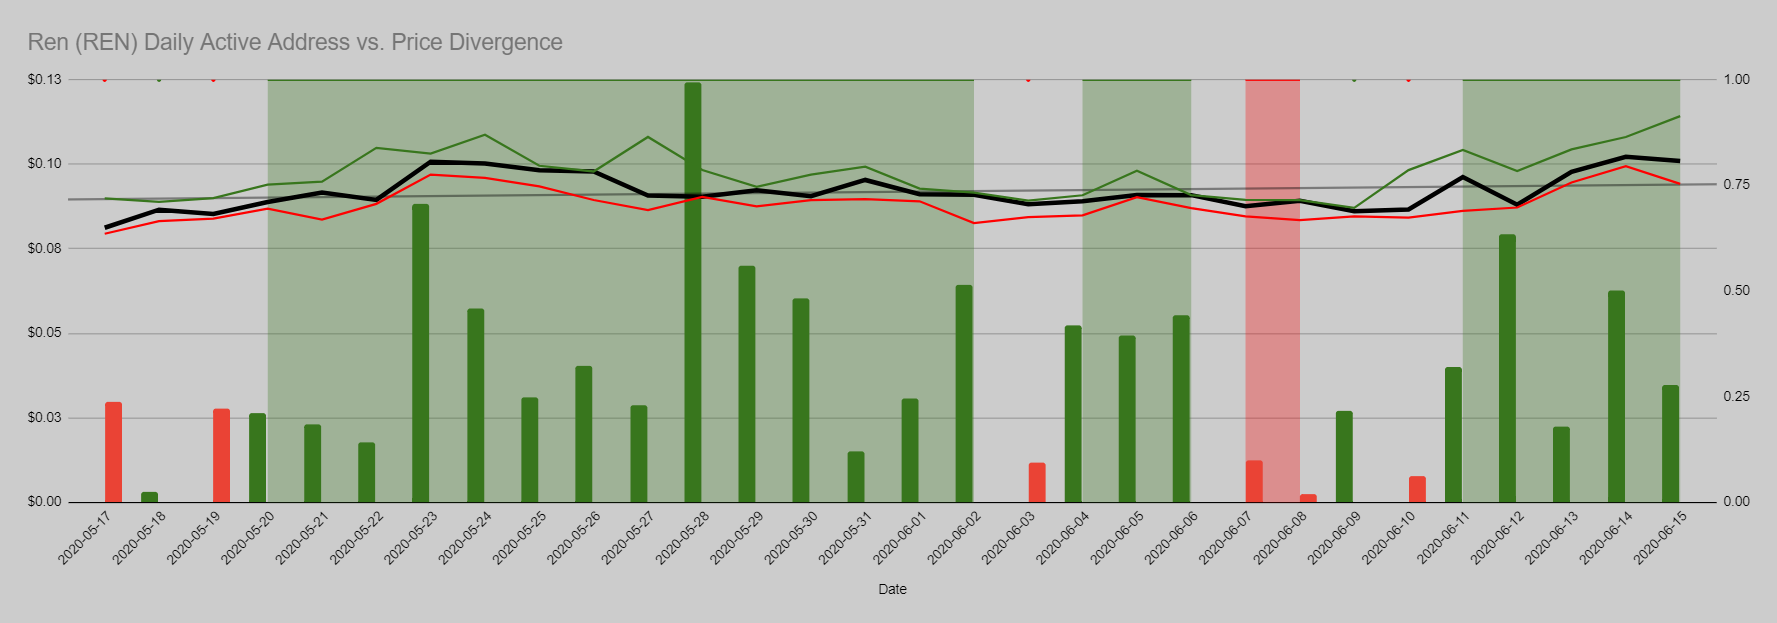
Yep, REN has been rolling for pretty much any timeframe you'd like to choose from since the Black Thursday crash. And what is most impressive about this is the fact that it is still gaining steam while having a bullish divergence in its daily active addresses. So in other words, DAA has actually beein increasing faster than its price. This is a very promising sign, and even though the current threshold is sitting at around +0.28 (below the +0.5 level of significance), there have been several cases over the previous month where it has surged well above this threshold. This is an extremely bullish looking DAA vs. Price chart we're looking at, and if things cross above +0.5, we will expect yet another REN decoupling from BTC in the near future.
Rating: 8.5
NVT Token Circulation

REN is near all-time best levels in terms of its NVT token circulation, and the now 65th ranked project is working on its 4th month of bullishness in its last 5. The recent price explosion these past three days have come understandable with very promising token circulation well below both the trendlines and the June monthly average. With several reasons to be excited about REN right now with plenty of positive news coming out, this is very close to as good as we can hope for when looking at our NVT model.
Rating: 9.5
Sentiment Volume Consumed

With so many metrics looking fantastic for REN, the fact that its Sentiment Volume Consumed has spiked over 2.0 above its mean for the first time since last July is actually a major letdown. What this tells us is that "the secret is (more or less) out" for the high rising project. Getting so many new addresses and FOMO buyers has led to Ren's sentiment on Twitter becoming overwhelmingly positive. And this is traditionally a sign that a price top is imminent. Anything over 1.0 is a prime indication that we're close to levels of concerning amounts of elation and positivity. So the fact that we are above 2.0 means that, from a social sentiment standpoint, this is a strong case to take some profit.
Rating: 1.5
MVRV Long/Short Diff.

REN's MVRV Long/Short Diff is well into positive territory, with the average investor now +29.9% in profit. We would call this a legitimate concern for a metric that universally averages right at 0% for all assets. It has been about a month now since this metric crossed above break-even for average investor returns, and there could easily be a continuation toward its one-year high of about +102%, but we wouldn't count on that. Once an asset of two or more years of public trading reaches +25%, it can be a tell-tale sign that this number will hit a reversal. But with so much positive fundamental news coming out for Ren, it's an interesting case where things may still have room to climb. But based on this chart alone, we certainly wouldn't blame people for liquidating a portion of their positions.
Rating: 3.0
REN Average Rating: 5.6 (Neutral/Slightly Bullish)
----------------------------------------------------------------------------------
When BTC and ETH are looking slightly bearish, it means that all other assets are at risk of quickly falling off of a cliff regardless of how strong their own particular FA and TA analytics look. We predicted a slight pullback in our Bold Predictions article from last week, and things look a bit better for its fundamentals now that the retracement down to $8,900 has taken place for Bitcoin. But that being said, there are still some slightly bearish signs for BTC due to a lack of daily active addresses and unique tokens circulating on the network right now.
We aren't in danger territory by any means for the markets right now, but the negative sentiment that has began to appear in June can definitely be viewed to have a legitimate case considering how much things have rebounded since Black Thursday three months ago. The consensus reasoning for the crash that saw BTC drop to roughly $3,600 was due to pandemic concerns. And though cases related to COVID-19 have lessened, it is still very much a part of global concerns still. So this is always something we need to keep in the back of our heads, considering that the crypto markets have all but disregarded it as a relevant current event at this point.
Specific altcoins can continue to thrive if BTC maintains its presence in the mid-$9,000's or above, but try not to get too emotional about it and start calling for "altcoin season" just because REN, MKR, STORJ, KNC, and some other projects have individually taken off in recent weeks. Over the past 90 days, the top 100 altcoin index (+129.3%) is indeed notably above the returns of both Bitcoin (+81.2%) and Ethereum (+102.1%) in the past three months. But this is a direct reflection of how much this same altcoin index fell far lower than BTC and ETH during the Black Thursday crash. Keep your expectations tempered in terms of seeing the rest of June being a continuation of what we saw in April and May, and watch the indicators covered in this article closely!
Conversations (0)