Bold Predictions, Week XIV - DeFi Reaches 2017 Ethereum Levels of Hype

SANBASE SIGNALS
July 21, 2020
For those of you who were involved in crypto back in 2017, think back to the summer of this year when Ethereum was beginning to emerge as a challenger to inevitably displace Bitcoin as the #1 crypto asset in the industry. People referred to it as "The Flippening", and ETH's price quickly shot from $10 to $360 from January to July. Notice how when the craze for it (illustrated by these blue social volume bars) peaked at its highest level in July, the price perfectly retraced just as interest around "Flippening" mentions soared?

Now, compare this above chart to the current mentions happening with DeFi. As a bonus, you can see just how much social volume mentions of DeFi grew following the public trading launch of Compound in mid-June.

Long story short, DeFi interest is on the rise, with seemingly no end in sight. And this has an awful lot of similarities to the craze around ETH three summers ago. Though the attention was not on BTC much during that time, and altcoins ended up arguably being the bigger story over BTC during the largest bull run in crypto's decade-long history, eventually Bitcoin prevailed over Ethereum, where it has essentially doubled its value in three years, while Ethereum and the vast majority of other alts are still being traded at far smaller market values than they were in the summer of 2017... and even the end of the massive 2017 run.
The moral of the story is that no matter how much craze there is over DeFi and the amazing projects associated with it, things over time tend to normalize. And there are beginning to show a lot of signs of a DeFi bubble. We will be doing our best to analyze just what metrics are looking like right now for a couple of widely discussed DeFi projects, and will be making some bold predictions along the way as we always do!
We continue to offer 25% off your first month's subscription on any Santiment service you have your eye on! Just take 15 seconds to provide feedback for us on this poll. Then just visit the Sanbase pricing page to get started with your 25% discount now, and enter SIGNALS25 at checkout!
Any help needed on redeeming this, just email us at support@santiment.net. With every weekly volume we release of our Bold Predictions series, we are taking a look at the most recent three-day averages (or percent changes) for each metric we're covering. As a reminder, these signals are for intra-day traders to assess local tops and bottoms based on historically solid leading indicators. Our rating system is simplified for this week. A 0 to 10 scale, with 0 being as bearish as possible and 10 being as bullish as possible. This would mean that a 5 would be neutral and imply sideways movement estimates over the next week. Whether we call a project bullish or bearish for the next week or two, please remember that this has no relevance to what we think of the asset's long-term viability as an investment.
----------------------------------------------------------------------------------
This Week’s Assets:
- BTC, ETH, LEND, MFT
This Week’s Metric Breakdowns:
- DAA vs. Price Divergence (2-Year Deviation From Mean), MVRV (30-Day), Sentiment Volume Consumed
----------------------------------------------------------------------------------
Bitcoin ($BTC) - #1 Ranked Market Cap
- 3-Day Movement: +2.2%
- 30-Day Movement: +0.6%
- 90-Day Movement: +31.5%
DAA vs. Price Divergence (Long-Term Deviation)

Bitcoin's journey in the low $9,000's range has become somewhat of a meme at this point. There is clearly going to be another breakthrough above $10,000 or below $9,000 at some point, but for now its daily active addresses have been fluctuating right in the range where they should be expected. There has been a bit more push to the downside lately, indicating a very slight deficit in DAA, particularly on weekends, which are historically slower transaction days in crypto.
Rating: 4.0
MVRV (30-Day)

Looking at the average returns of BTC investors who purchased their assets in the last 30 days, it's pretty apparent that the trend has been to hold and not make too many drastic buys or sells with the price of Bitcoin trading in such a narrow range for such an extended period of time. An MVRV of 0.99 indicates (where 1.00 is break-even) indicates that traders are virtually break-even, and there is very little sentimental edge in either direction in terms of the average investors' profits or losses.
Rating: 5.0
Sentiment Volume Consumed

Meanwhile, on the weighted social sentiment side for Bitcoin, the amount of mentions are down, and so is the level of positivity. This is a good thing for the prospects of a bull case for Bitcoin's near future, as prices tend to hit their most local bottoms when BTC is below -1.0 on the deviation from its mean. -1.07 is a 2-year low in positivity, and this has certainly become an interesting development with so many traders now focused on maximizing their gains through DeFi and related assets.
Rating: 8.5
BTC Average Rating: 5.8 (Neutral)
----------------------------------------------------------------------------------
Ethereum ($ETH) - #2 Ranked Market Cap
- 3-Day Movement: +3.6%
- 30-Day Movement: +6.6%
- 90-Day Movement: +33.7%
DAA vs. Price Divergence (Long-Term Deviation)

Ethereum has been silently and patiently creating itself a very solid bullish divergence, with daily active addresses and network growth very high compared to its current $245 price level. When it does begin to move the needle in the crypto community again, it should be in a big way. The qualifier to this of course, is that BTC maintains its price range and doesn't collapse into FUD territory, which will shake ETH and the entire crypto industry in a big way with prices propped up so high in such a short period of time.
Rating: 7.0
MVRV (30-Day)

Average Ethereum traders are pretty much under the same wait-and-hold pattern as Bitcoin traders right now. With so much attention on DeFi and smaller cap assets, this development will likely continue until we see a breakthrough one way or another for BTC during this low volatility stretch for the top two market cap projects. With average traders who bought in the last 30 days up approximately 1% during this time, this metric is about as neutral as it will ever look for ETH.
Rating: 5.0
Sentiment Volume Consumed

For a while over these past couple months of flatness, the perspective on ETH for the crypto community was quite a bit more positive than BTC. Ethereum, unlike Bitcoin, didn't just come off of a disappointing halvening event in May after all. Regardless, it appears that enthusiasm over the number 2 market cap asset has taken a nosedive, and it's now approaching similar levels of negativity (-1.0 dev. from mean) with so much disinterest in top market cap projects. This is a nice development, with Ethereum able to thrive at its best historically when traders have their heads turned.
Rating: 7.5
ETH Average Rating: 6.5 (Semi-Bullish)
----------------------------------------------------------------------------------
Aave ($LEND) - #32 Ranked Market Cap
- 3-Day Movement: -1.1%
- 30-Day Movement: +92.4%
- 90-Day Movement: +942.3%
DAA vs. Price Divergence (Long-Term Deviation)

With LEND nearly 10x'ing over the past three months, the amount of FOMO has reached some pretty monumental heights for the 32nd ranked crypto asset. And our DAA Divergence Model has all but confirmed that the temporary top is likely in with an increasingly large amount of bearish signals, capped off by one final high spike of DAA that occurred on Sunday. With a pattern like this, it is definitely best to stay away and wait for signals to neutralize and trend back on to the green side slowly but surely.
Rating: 1.5
MVRV (30-Day)
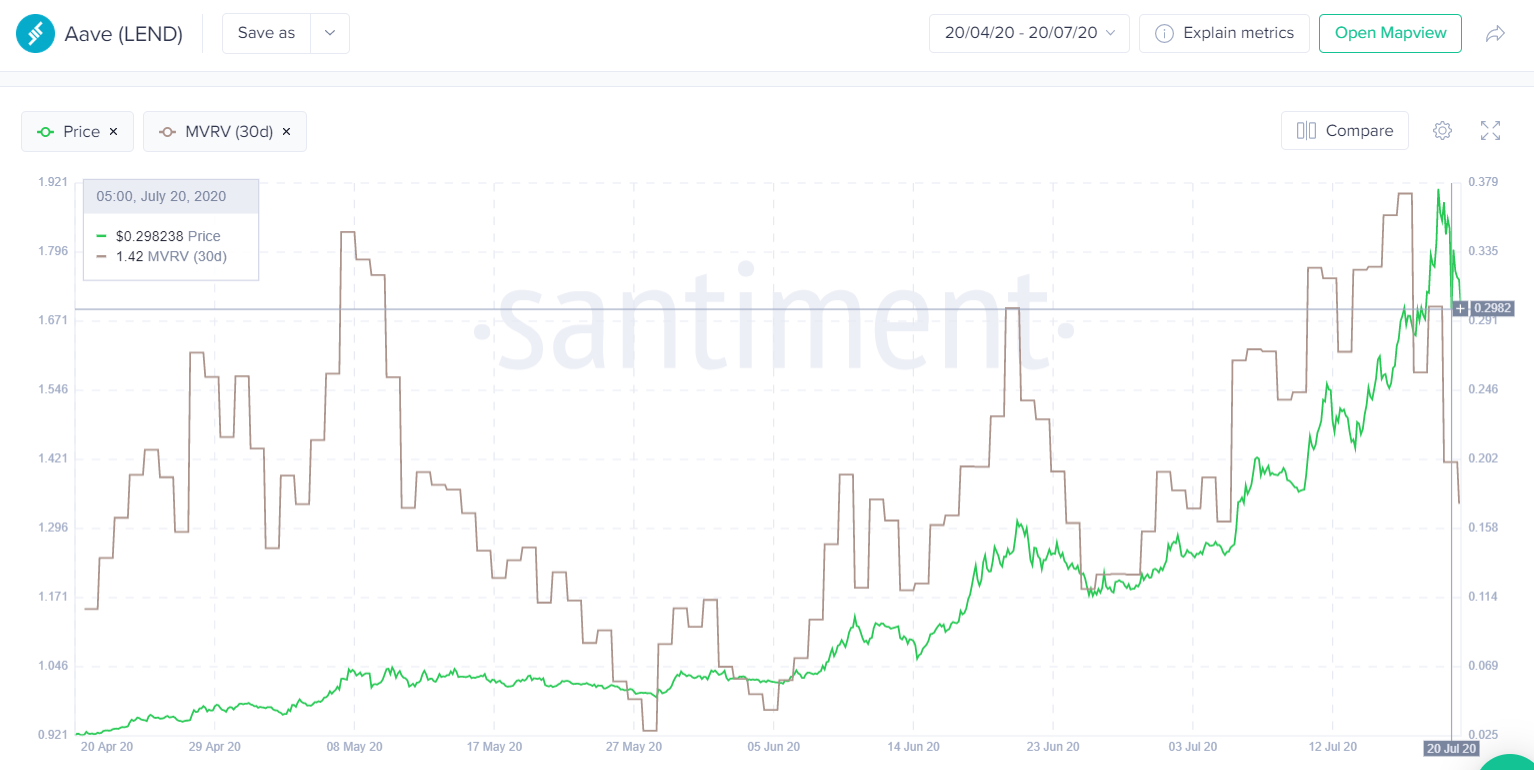
As such a highly volatile asset since April, Aave is seeing a heavy amount of jumping back and forth as both FOMO'ers and profit takers are battling to find a local top for an asset that has seemingly not taken its foot off the brakes in a very long time. Regardless, buyers of LEND over the past 30 days are still up an average return of +42%, which is egregiously high for such a short timeframe. At such high levels for this MVRV 30-day indicator, jumping in when investors are already well into the profit is something you should consider very risky.
Rating: 2.0
Sentiment Volume Consumed

Positivity for Aave (LEND) is still well above its average rate, and until this comes down a bit, traders should be cautious of such a positive perception of a coin that has surged as much as it has. Until sentiment turns negative, we don't like the chances of a continued rally for that much longer.
Rating: 2.5
LEND Average Rating: 2.0 (Bearish)
----------------------------------------------------------------------------------
Mainframe ($MFT) - #174 Ranked Market Cap
- 3-Day Movement: +32.7%
- 30-Day Movement: +92.1%
- 90-Day Movement: +336.3%
DAA vs. Price Divergence (Long-Term Deviation)

Mainframe should be considered a fairly young asset after their pivot to DeFi recently. They obviously saw a huge price surge following their decision to do so, but the hype from the first two weeks of July has mostly died down, and DAA has mostly normalized. There is still a huge trend of above average DAA output right now going back even before they made this change to their project, so things are still looking better than average according to our model.
Rating: 6.5
MVRV (30-Day)

Similar to LEND, MFT holders who bought in the past 30 days have been enjoying some very comfortable returns. Up 43% on average, this is pretty much nosebleed territory, and something to be very cautious about if you're expecting a continued rally. There could be a very minor bounce after the pullback going on these past couple of days, but we see some retracement happening over these final 10 days of July and heading into August due to such a rapid run-up.
Rating: 2.0
Sentiment Volume Consumed

With our weighted social sentiment balance chart not yet available for Mainframe, we are simply looking at total Sentiment balance to maintain consistency with the other three assets we've looked at here. Spikes above the horizontal 0 line indicate waves of positivity toward the asset, while spikes below alternatively signify negativity. As of now, the positive crowd statements have far outweighted the negatives. MFT did see its largest negative spike yesterday that happened in tandem to the sell-off, but this seemed to have been more reactionary than anything. We tend to go with what the majority of spikes are telling us here, and it's a clear sign that the crowd is still very much bullish. And if you've been following sentiment metrics on our site long enough, you'll know that you don't want to be in an asset where there is so much positive elation at an extreme level.
Rating: 2.5
MFT Average Rating: 3.7 (Semi-Bearish)
----------------------------------------------------------------------------------
If an admittedly small sample of our on-chain and social leading indicators are a sign of things to come (which they more often than not are), then it looks like the DeFi project craze may have already peaked, and the mostly ignored large caps are the next piece we should all be focusing on. This isn't to say that LEND, MFT, and other assets heavily involved with DeFi can't continue to make positive returns. But more often than not, when traders are seeing such high returns and daily active addresses are beginning to neutralize, it's best to at least consider some profit taking and not get greedy.