Bitcoin Within Inches of New All-Time High | Santiment Weekly Pro Report

Bitcoin is on the cusp of breaking history for the first time in 6 months. On April 14th, BTC's price hit an unprecedented $64,863 before prices retraced swiftly four weeks later. After plenty of volatility, a dip down to $29,394, and multiple "reshufflings of the deck" in terms of supply distribution and trader portfolio allocations, BTC's price is now back on the doorstep of history. Peaking at $64,498, just 0.57% from April's All-Time High, there is a ton to look over to identify whether Bitcoin's price record is about to be smashed. Again.
If you caught our weekly report from last week, you likely saw an increase in social interest on Bitcoin as it was crossing the $57k threshold. And since that time, on-chain metrics have held their momentum, the crowd began to expect a correction, and whales kept on steadily accumulating. With BTC garnering most of the attention, we have subsequently given the people what they want - enjoy our full breakdown of Bitcoin, where it stands, and what the encouraging (and discouraging) signs are for the #1 crypto asset by market cap to break through.
Circulation Not Slowing Down
Bitcoin went through quite a turbulent path between March and April, in terms of the amount of unique coins moving on its network. Our NVT token circulation model (pictured below) measures how healthy the token movement is on the BTC network compared to market cap. Using trendlines, we can identify how healthy the utility of Bitcoin is from a coin movement perspective. And for the first time since February, we are in a month that the NVT model indicates is green again (bullish):

Note that with October seeing an uptick in circulation, the price of Bitcoin has lifted off from the ranging pattern that had been occurring for the past 5 months. As of now, transactions and overall movement on the network indicates a very healthy level.
We can also see this circulation illustrated in a more simplified manner. Note the very clear uptrend in token circulation that began two months ago (in mid-August):
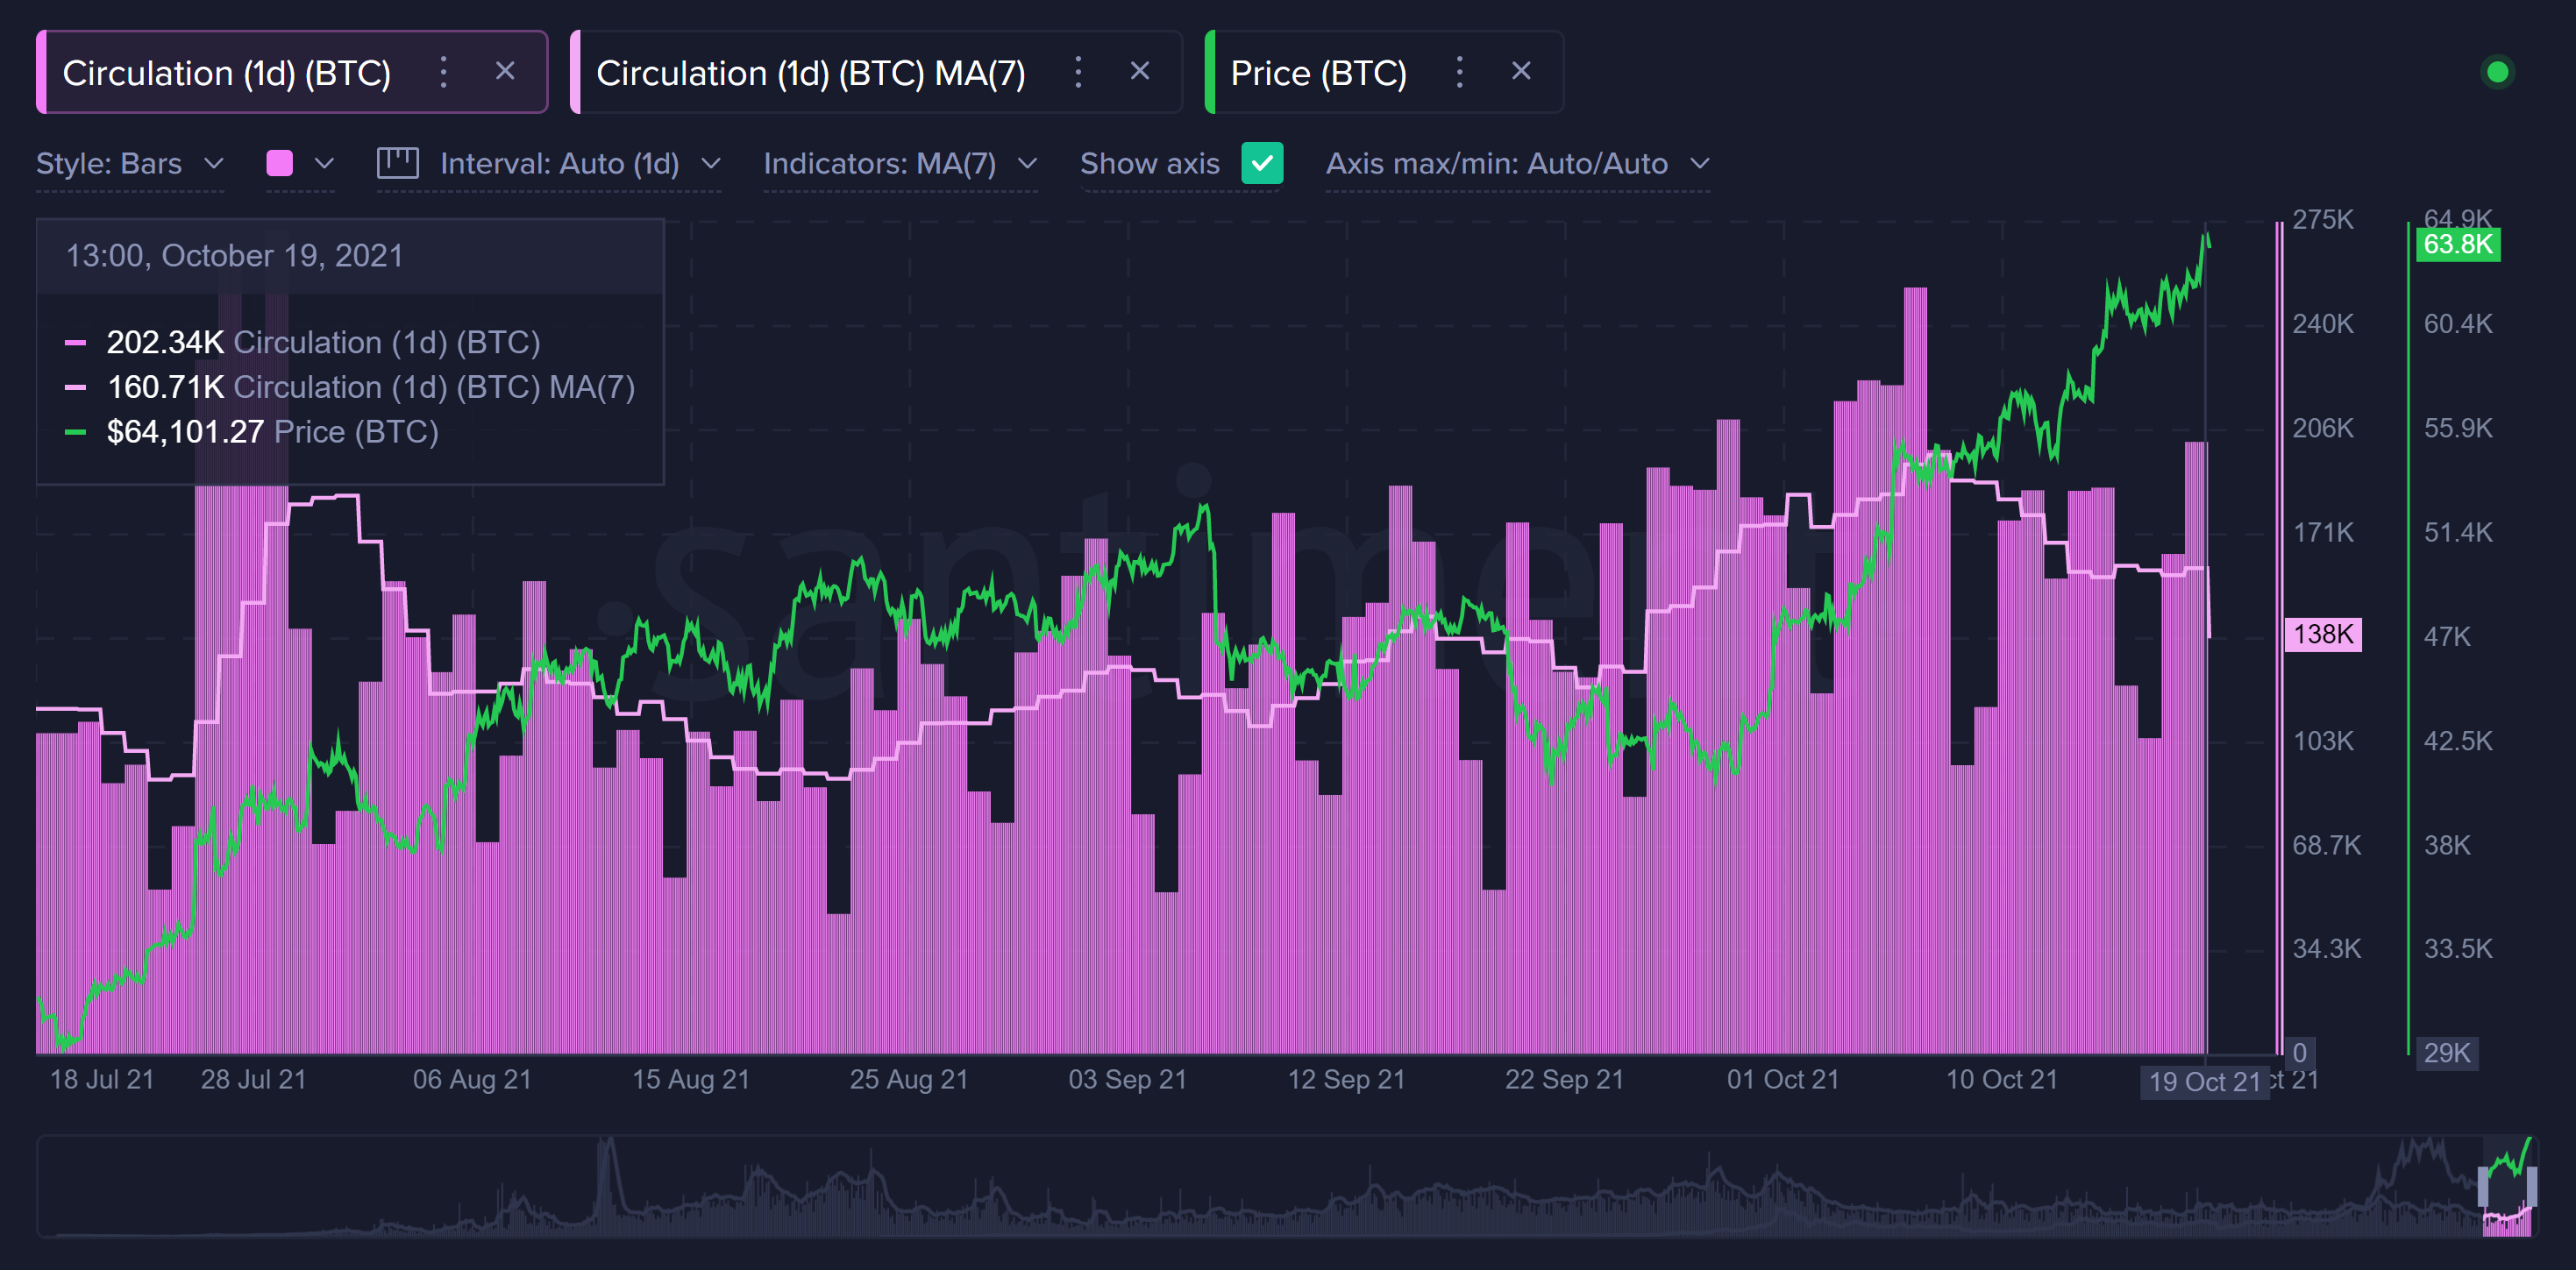
The spike beginning during the first week of October was really key in propelling prices upwards, and there was no looking back since.
In a similar vein, we also like to look at Bitcoin's address activity for indications that unique addresses are interacting at an increased pace the same way that unique tokens are. And we can confirm that the same rise in tokens beginning in mid-August, occurred in terms of rising addresses in early August:

In mid to late September, we discussed how addresses peaking at over 1 million in a given day was a key number should be staying consistently above in order to justify a price rise. And beginning right at the beginning of October, this is exactly what we have been consistently seeing. As prices rose, many dormant addresses began to get involved, and this rise helped propel prices to familiar all-time high levels once again.
So Where is the Hype?
Just as Bitcoin crossed $57k around the time of our last weekly update, euphoric commentary on Twitter mysteriously died down. It appears that once that threshold was crossed, skeptics began to emerge.
And understandably so, considering the $58k level was where the rebound rally stopped back in mid-May. Technical traders often become weary at the points of previous rejections, so blasting through this resistance level this time around likely caught many off guard.
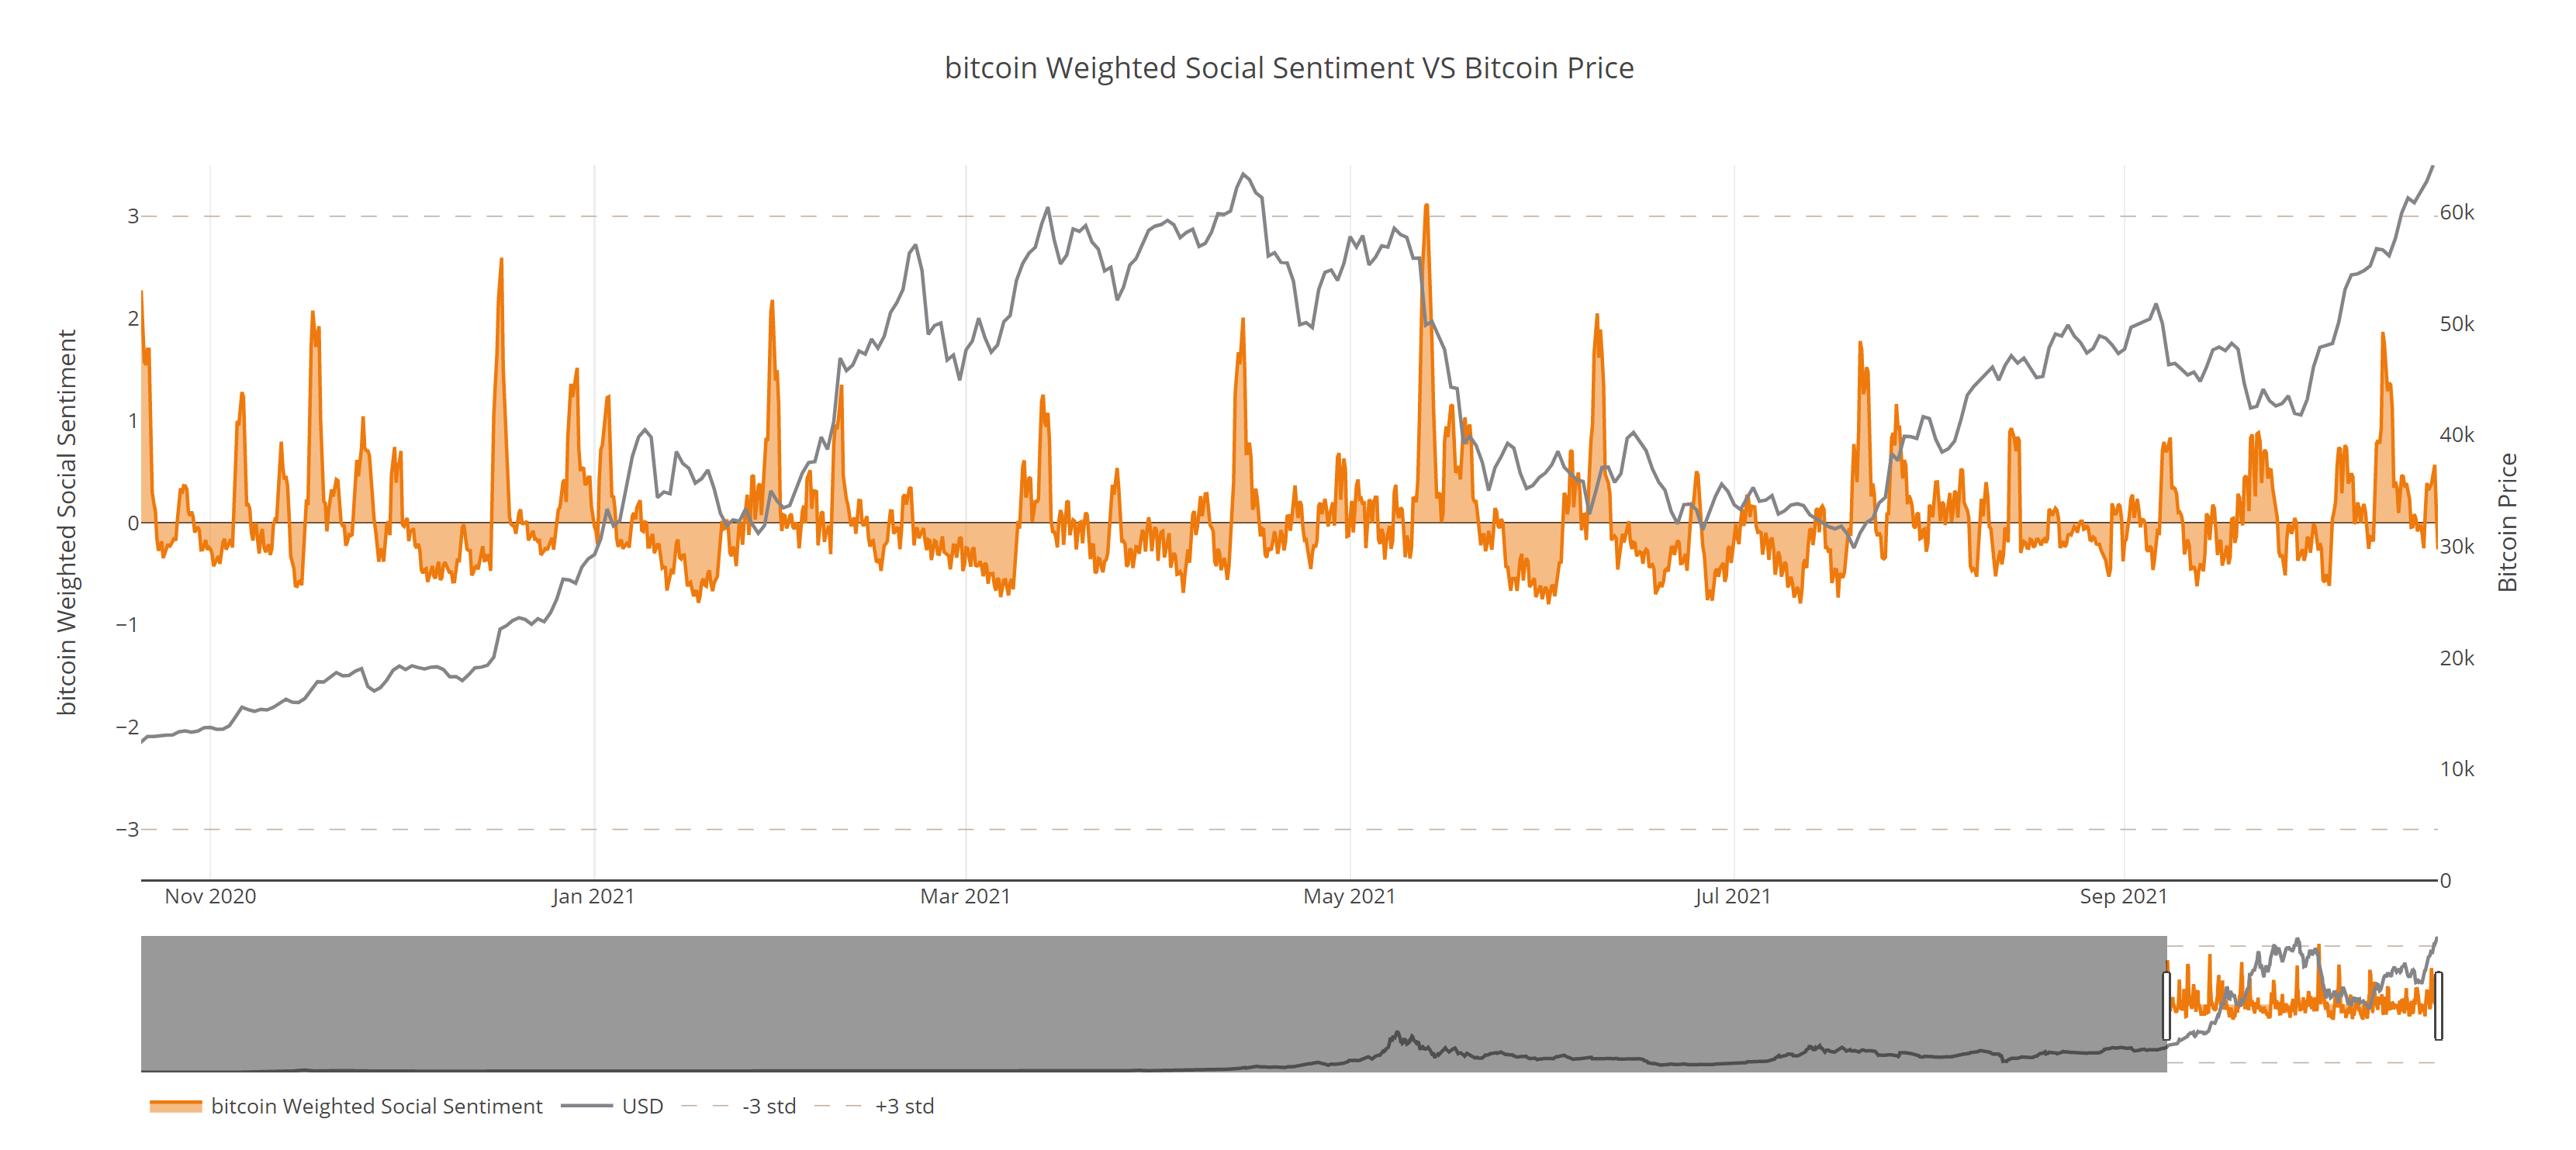
In terms of raw social volume (without factoring in social sentiment), we're seeing a mildly concerning spike that could indicate some increased crowd recognition:

As we've spoken about frequently on our Friday, 2pm UTC This Week in Crypto calls over on our YouTube channel, major social spikes are often predecessors to turning points in the market.
We can see this same spike on our social dominance chart as well. For those unfamiliar, this metric is similar to measuring overall mentions of BTC as social volume does. However, social dominance measures the percentage of BTC mentions vs. the other top 100 market cap crypto assets:

As we see above, this is the third largest spike in around the last three months or so. These dominance spikes can often be 'momentum halters', but are also generally temporary. So this latest spike is something to be cautious of, but it's far from a signal that traders need to run for the hills with the assumption this all-time high can't be achieved.
Evidence of FOMO
The funding rate for BTC, which measures the ratio of longs paying shorts or shorts paying longs, has been showing mild signs of FOMO on Binance this past week. Leveraged longs were popping up in a big way as Bitcoin rapidly crossed the $57k to $62k range:

However, in just the past 48 hours, it appears that these major longs came back to its normal resting funding rate of 0.0001, as traders seem to be content with the mini rally, and want to avoid falling into a greed trap.
But do you recall from our previous chats and articles about what happens when greed subsides and traders begin to await a pullback to get back in? Markets traditionally punish them by surging up further until these same traders feel forced to come back in.
Along these same lines, we always like to see how 30-day average trading returns are shaping up. Typically, the higher these average returns (known as our MVRV metric) go, the higher risk there is of a correction. In our MVRV chart below, note how the current 30-day MVRV sits at 17.27%.

Typically, when the 30-day MVRV sits above 15%, there has been historical evidence that at least a mild pullback will take place in the near future. This 15% line is marked by a gray line in the above chart, so it can be easily visualized. Watch closely now that there is increased risk while BTC sits above this line, reaching its highest level since mid-August.
Whales Aren't Profit Taking
We have often noted the importance of keeping tabs on how some of the largest addresses in BTC are behaving. After all, those with the most capital at stake can easily create waves large enough to create some euphoric rocket emojis or panicked market exodus at a moment's notice from one single trade.
And based on the key tier that we try to hone in on, the 100 to 10,000 BTC whale addresses, there appears to be signs of mild accumulation from these large bag holders. Since October 12th, these addresses have added 18,709 more BTC to their combined wallets:

As these whale addresses ebb and flow, it's worth keeping a close eye on whether markets shifted as a result of their major swings in how much they choose to hang on to at any given time. The last time there was a notable whale coin dump was in early August, and it took a full month of continued decline before the markets inevitably dropped in early September. Currently, we see no signs of repeated patterns as Bitcoin sits neck and neck with April's all-time high.
Disclaimer: The opinions expressed in the post are for general informational purposes only and are not intended to provide specific advice or recommendations for any individual or on any specific security or investment product.