Bitcoin's Daily Active Address Divergence Shifting Back to Bullish

You may be familiar with our DAA-Price divergence model by now, which measures the relation between Bitcoin's daily active addresses (number of distinct addresses that participated in a transfer for the given asset in any given day) and its price. Historically, we have noted a healthy range that price follows the amount of active addresses on a given network. Particularly with BTC and ETH, this relationship is quite tight, and when there is a notable separation, this shows up on our chart as either an extreme abundance of DAA (shown in green) or extreme deficit (shown in red). For more on this model, check out our article we've written about this model and our backtest on its viability as a leading indicator.
In terms of what this model has been showing, it's clear that there has been some obvious volatility since Black Thursday happened a bit over a month ago. When prices retraced roughly 50% to just below $3,700, there was an obvious state of polarization on how much the world pandemic would and should continue to affect cryptocurrency markets. And as it turned out, those who thought the asset was oversold were correct. This model was a great resource to refer to during this time, as our Sanbase Pro users were able to identify multiple bullish divergence signals that were the highest we have seen in years:

Here is a close-up of the past six months of BTC's DAA-Price divergence. There were very few signal thresholds being crossed to end 2019 and to kick off 2020, meaning that price was following along with the daily active addresses on the network at a healthy and balanced rate. However, when Bitcoin crashed, active addresses did not. This is exactly what caused the nearly two-week straight bullish divergence circled below, as the price of the #1 market cap asset rapidly rose to catch up with the strong maintained level of token circulation.
Interestingly, when the price reached around $7,100 on April 7th, nearly a month after Black Thursday, our model switched gears and noted that prices have caught up to DAA so much so, that it was now indicating we had a slight bearish divergence. It's notable, however, that these signals were not firing off as frequently (or as high) as the consistent bunch of daily bullish signals that occured in March. Therefore, it was a weaker signal, albeit still predicted the local top correctly. Now, as of yesterday, it has again flipped back to bullish on this model:

To validate why things have switched back, we can take a look at BTC's Daily Active Addresses in detail on Sandata. When the local top hit on April 7th, so did the DAA. It dipped noticeably lower over the next few days before just recently spiking back up to good consistent levels the past four days. With prices nearing close to where we were back on the 7th, the DAA is again showing to be gaining faster than price, which is exactly why we're seeing this bullish divergence on our model again:

Switching over to Ethereum, you'll notice there is more neutral territory on the 2-year chart for our DAA-Price model. This is because after extensive backtesting, more strict thresholds had to be implemented to see consistent results. Likely due to its still ever-present significant peg to Bitcoin's price, there can be a lot of noise that have little to do with ETH's DAA because of BTC's individual fluctuations. Nevertheless, we still see consistency with it based on the thresholds we have programmed in order to have a signal fire off for the #2 market cap project.
Notice how just like with BTC, we began seeing 2-year high levels of bullish divergence signals firing off immediately after Black Thursday. And sure enough, Ethereum, just like Bitcoin, rebounded swiftly in order to compensate for its maintained network and token circulation in spite of the crash:

Unlike BTC, ETH hasn't seen a bullish divergence switch-over in the past day or two. However the few bearish divergence signals we've seen over the past 10 days have been relatively minor in height compared to the massive swarm of bullish divergence signals in mid-March:

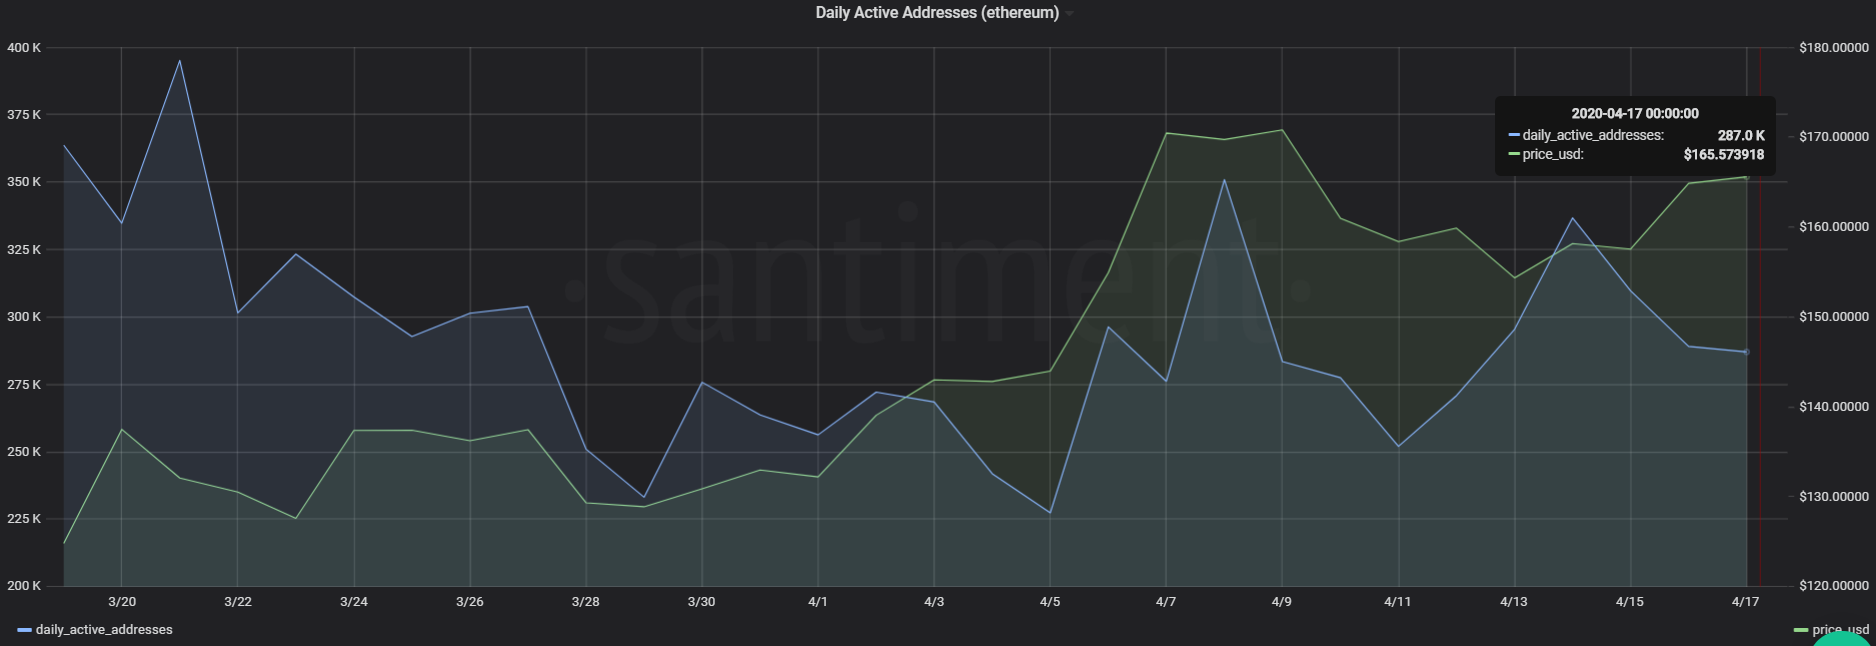
When looking at the Daily Active Addresses chart for ETH over the past month on Sandata, we can see that things haven't been moving on quite the consistent uptrend that we took a look at for Bitcoin. However, we wouldn't be surprised if it followed suit if BTC's price crosses the $7,145 month-high close that it saw back on April 7th:
Stay tuned as we update BTC's and ETH's DAA over the next couple weeks to see if this bullish divergence we're just starting to see for Bitcoin has lasting power and if it allows ETH and many altcoins to follow suit and see their own respective daily active addresses rise as the markets look to increase confidence in a long-term bullish market forming. Make sure to give us a follow on Twitter if you haven't yet done so, and get Sanbase Pro today to follow along on assets' DAA, network growth, NVT, social trends, and other leading indicators we frequently discuss here on our Insights page. Cheers!
Conversations (0)