A peek into Ethereum token activity

Try not to be misled by the title of this article, the information I've provided here is regarding Ethereum token movements, not development activity. So rather than renaming this piece, I figured I would start with a senselessly long introduction. The sole purpose, to outline what the title actually implies. Now that we've accomplished this feat, let's go over some historic token activity.
Presently, this subject is one of the things I find truly insightful when it comes to on-chain analysis. While it is certainly not without its flaws and or obfuscated data, the ability to look at token activity/inactivity in so many ways is something traditional financial instruments don't allow for. At least not in the same regard. For instance, the chart below plots the percent of active Ethereum over the course of the past year, for each day moving forward. The viewable range, December 1, 2018 to September 29, 2019.

Now, this decrease might appear insignificant to some, but in fact it surely isn't. As of todays date, September 30, 2019, the total circulating supply of Ethereum is 107,953,095 tokens. Which means that currently a decrease, or increase, of active tokens by just 0.50% represents roughly 539,765 ETH.

This significance that I am pointing out is simple, it's the law of supply and demand, or in this case activity and demand. It's clear to see that from 9 months prior to today, tokens active during the past year have been decreasing steadily. The rough figure, since December, 2018 is around 7,124,900 less active ETH. At current value, this is equivalent to ~$1.23B worth of ETH standing still. But equally as clear too is the rise in price during the past 9 months.
So, this begs the question, does token activity really impact price action? To gather more evidence, we'll zoom in closer and look at tokens active over the past 90 days, perhaps then we can see if the rise and fall of activity really has any effect on the market.
To start, look at the chart directly below and take notice of the large drop on March 1, 2019. This plunge represents the outlier from 90 days earlier aging out. That outlier can also be seen across many other metrics and for those watching on-chain activity, such as myself, this represented a dramatic shift in momentum. With it came the opportunity to accumulate optimal entries, which I was fortunate enough to be able to do. But enough of my humble, not so humble brag. That event also displayed a rapid increase in active tokens.

It is easy to observe how as the price continued to climb, less active ETH was being demanded by market participants. This in part may have been due to opportunity cost rising at an accelerated rate vs. tokens active. Or due to disbelief and some overall negative sentiment towards Ether. Regardless, it seems to me that the pattern of activity and demand remains.

I feel the need to add a few caveats here. When looking at these charts there is much to keep in mind. For instance, look how the price of Ethereum appreciated 105% in just 72 days and during the same time frame, only 1.41% more Ether became active. Yet as the ground fell out from under the markets footing, 90 day active ETH continued to rise and move above 20%. Following that, in a matter of 51 days, 90d active ETH had retreated to an all time low of 16.29%. This in part is due to tokens aging out. Whether this happens drastically or slowly helps the analysts to determine, to some degree, the magnitude of importance.
Additionally, these tools are best used in conjunction with other on-chain metrics. By doing so, one can grasp a deeper understand of the movement being observed. For example:

How about that, another look at our friendly outlier, only this time via 'Total holders balance.' The specific holders I've isolated here is the mega whale crowd, addresses with a balance between 1M and 10M ETH. Who or what they are is really irrelevant to me, though I gather they are likely exchanges. Nonetheless, the movement is telling. At the peak of this time frame, the number of holders who fit into the above criteria was a total of 9, big number, much wow. As of today only 5 addresses are so elite.
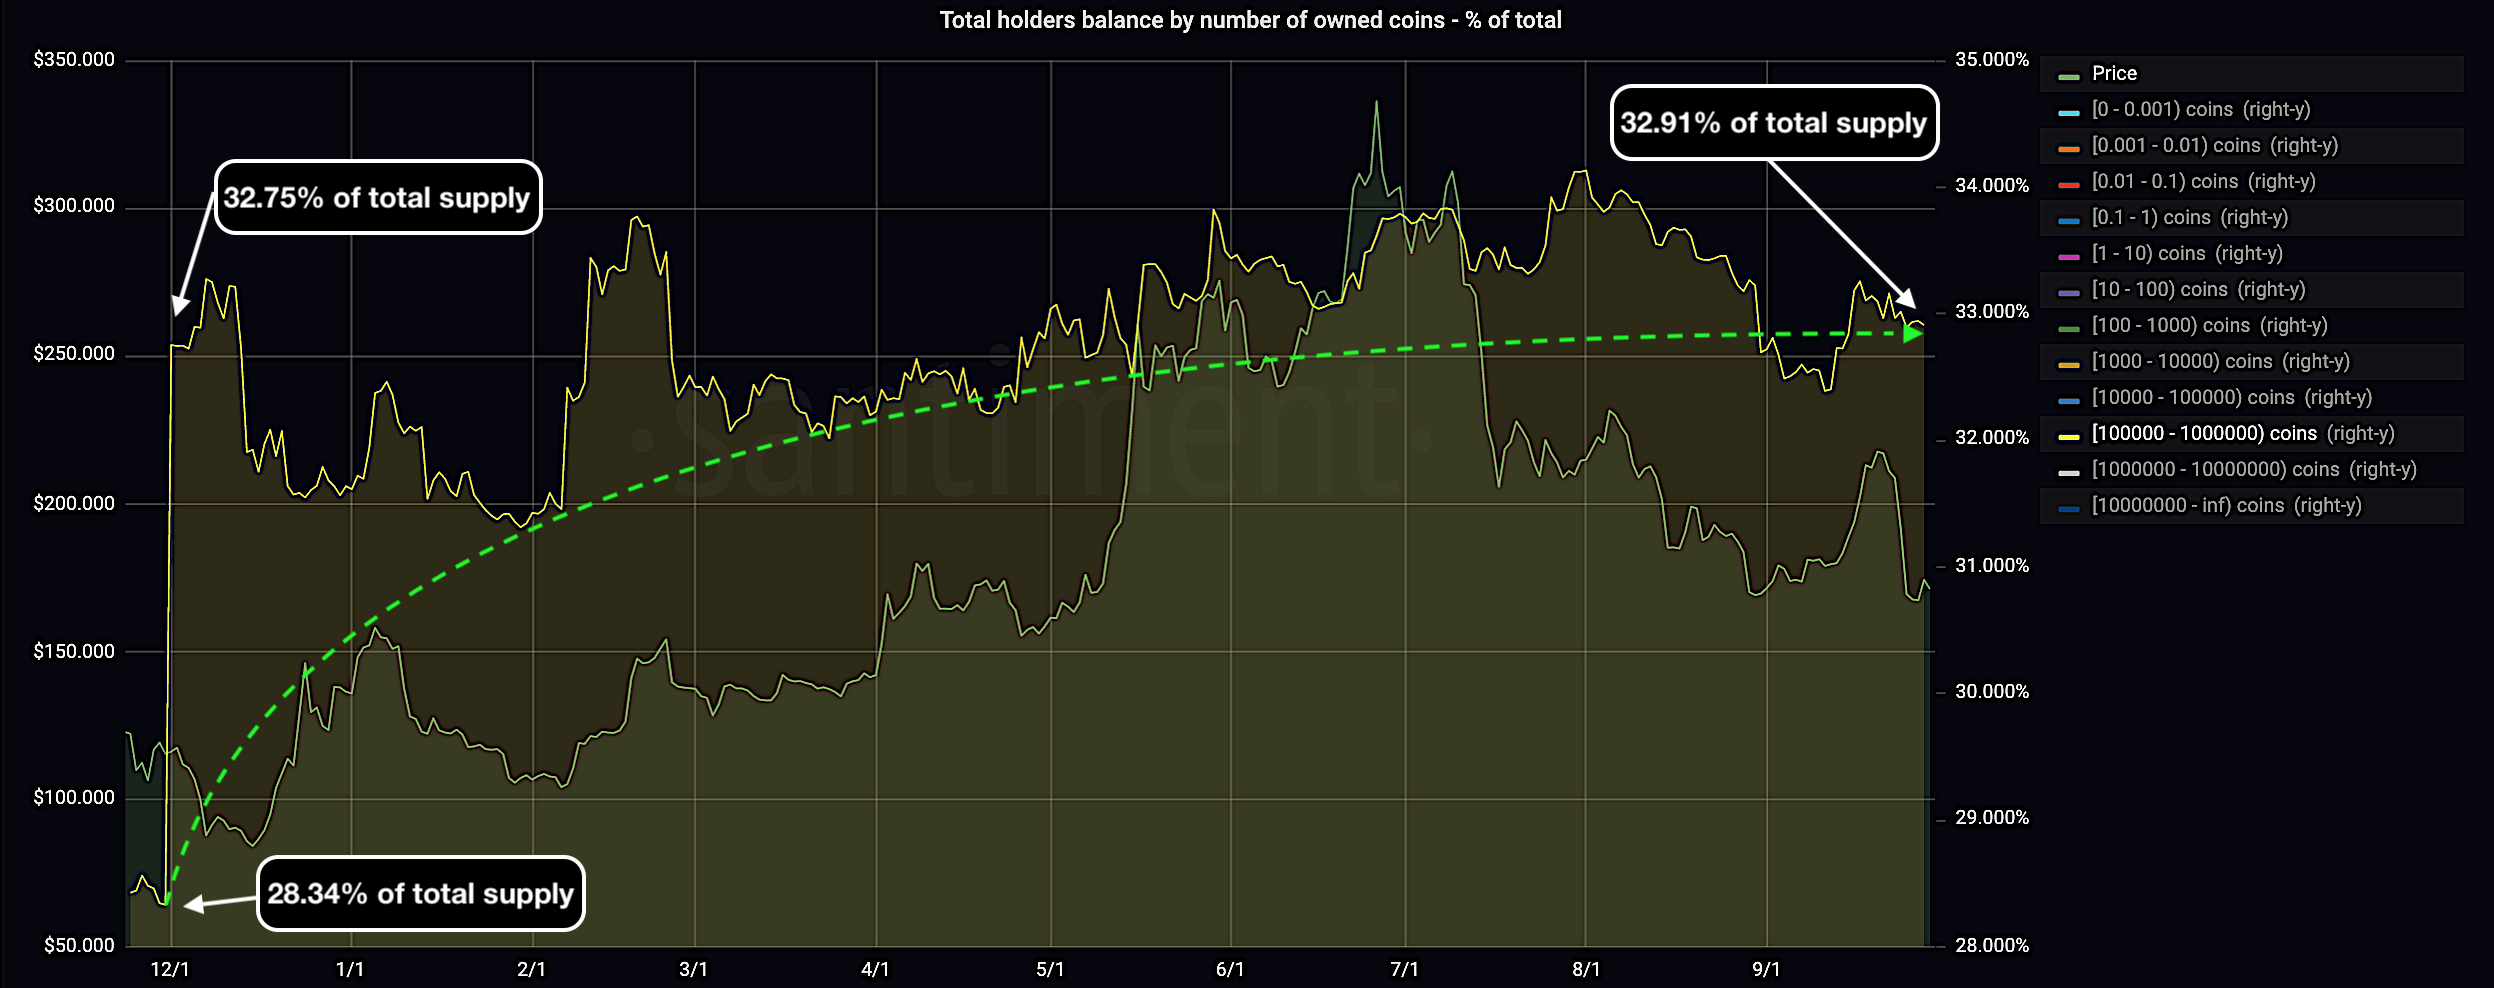
To further add to my point about using additional metrics to understand another; Above is 'Token holders balance' showing those with a balance of 100k ETH to 1M. Surprisingly enough, also another view of the outlier I have mentioned far too many times already. Using yet another metric (not pictured here because really, how much more free alpha can I possibly offer) to see how many holders met this threshold before and after that event, it shows that mega whales appear to have distributed those ETH in 51 addresses. Anyways, clearly there is no question that on-chain analysis is a never never ending rabbit hole.
So let me wrap this up and try to pretend to make sense of all the information I have been rambling on about. Really, the purpose for writing this was to try and show the value of monitoring token activity, along with a few different ways one can do so. At this point, I have been analyzing on-chain activity for two years now and I can assure you, all that I divulge publicly is truly only scratching the surface. Maybe soon I'll write something up about using time bound 'Realized Value' to calculate a period based 'realized return.' With the results then used to assign risk to an improvised sector-neutral strategy between different crypto assets. Afterwards I could explain how and why many iterations of that idea failed miserably before actually producing promising results. But we'll see, for now please just remember, there is no way of knowing if anything I've written is accurate. So as always, hire someone to do your own research for you. That said, I'm always for sale, but I'm also not a cheap date.