A closer look at KNC's +11% week

Kyber Network’s native token (KNC) has been one of the top-performing ERC-20 coins in the past week, gaining over 11% and clocking at a 10-month high $0.294 a few hours ago.
In fact, KNC’s been on a tear for months now. Ever since its November 25th bottom, the coin has grown by a mouth-watering 109.14%, shadowing most of BTC’s uptrend and conveniently decoupling at a few market-wide dips:

So today, I wanted to take a closer look at KNC’s fundamentals, and what we can learn from its recent on-chain activity and social media chatter.
1. Top-heavy network activity

Over the past few days, KNC has experienced another solid bump in on-chain activity - namely the amount of daily active addresses (DAA) on the network. We’ve seen a similar pattern occur during a number of KNC’s recent tops - a rise in price marked by a corresponding surge in network activity.
These pump-related DAA spikes are often caused by a growing speculative interest in an up-and-coming coin, and tend to be relatively short-lived as a result. Once the on-chain activity starts to revert back to its pre-pump levels, the price is usually unable sustain an upward push and begins to correct shortly thereafter.
We’ve seen this pattern so many times we even have a name for it: Price - DAA divergence, and have even created a strategy built arond this phenomenon.
In that sense, the latest spike in KNC’s on-chain activity is certainly something to keep an eye on. Should the amount of active addresses begin to significantly decline in the coming days, it could act as resistance to the coin’s short-term action, as it has in the past.
2. Social chatter cranks up

The last few days have seen the highest amount of mentions of ‘KNC’ and ‘Kyber’ on crypto social media since the end of December. Based on data from over a 1000 crypto-specific social channels, Sanbase has recorded over 110 new mentions of the KNC in the past 24 hours alone.
Much like its active addresses, previous spikes in KNC-related chatter correlated squarely with its local tops - a common occurrence in many mid and low-cap coins. The crowd’s interest in a token rises with its market cap - as the hype starts to dissipate or, again, diverge from the price, it often signals a waning interest and precedes a correction.
The recent spike in KNC’s social activity does feel noteworthy, although it’s yet to reach its mid-December levels. The best way to keep an eye on this indicator is with this quick signal that will alert you when KNC ends up on our list of top 10 trending words on crypto social media - a frequent top indicator when it happens during a coin’s rally.
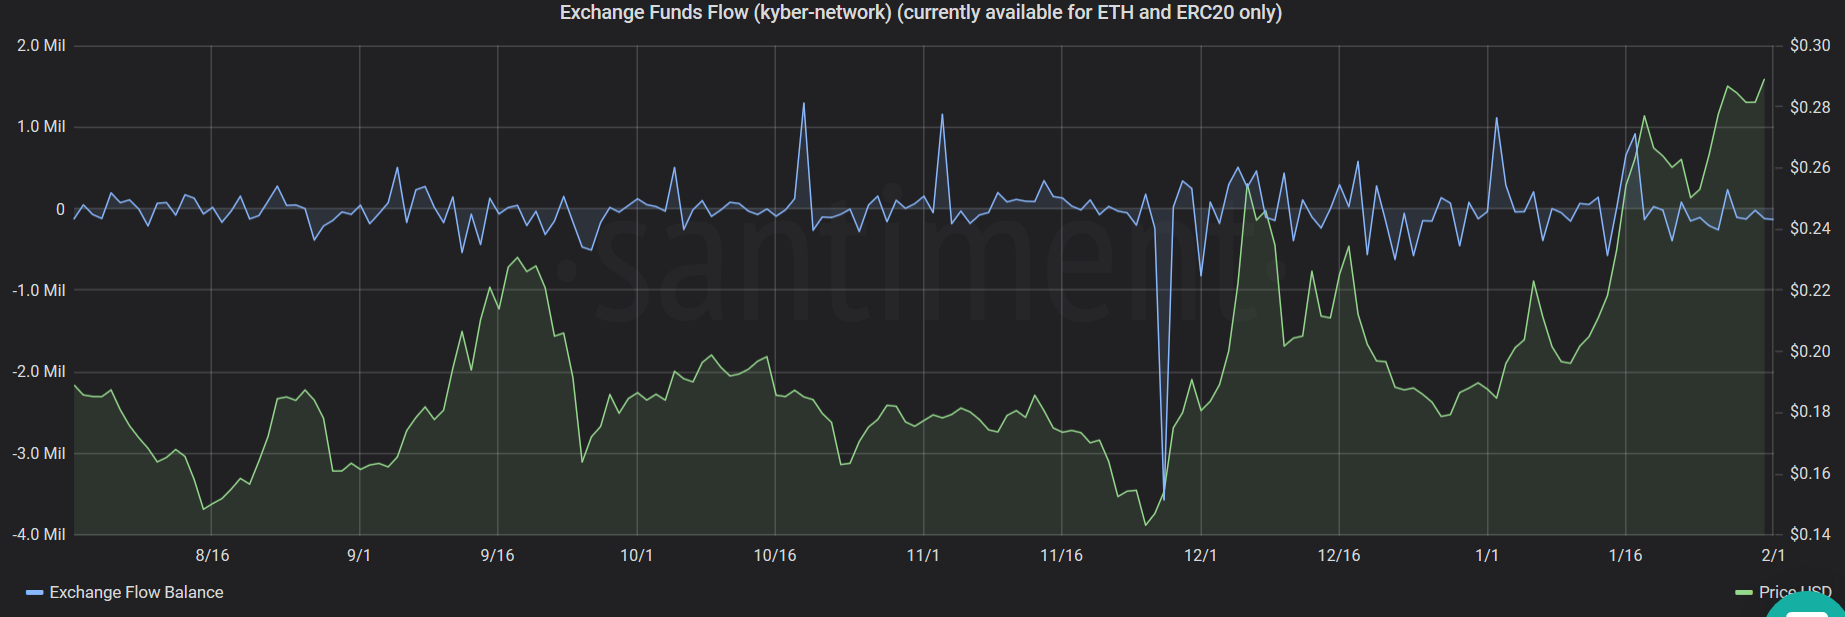
3. Lethargic exchange flows

It’s not all bad news for KNC’s price action, however. One common top indicator that we’ve seen materialize on Kyber charts several times in the recent past is an elevated inflow of KNC to known exchange wallets.
If it happens during an uptrend, such on-chain movement often indicates a rising sell pressure as holders start cashing out. When this sort of token influx to exchanges proves too difficult for the bulls to absorb, a price correction could be on the horizon.
The above image shows the cumulative KNC balances held by top exchange wallets. As you can see, virtually every top in Kyber’s recent history had a correlating spike in the amount of KNC sent to exchanges. Despite the 12% gains, this has not yet happened in the last 7 days.
If the above chart adds another orange spike come tomorrow, it will be another cause for concern for KNC holders. For the time being, however, we’re still not seeing abnormal levels of KNC moving to exchanges.
Here’s our 6-month Exchange Flow chart for KNC as further proof:
4. Recent Whale Behavior
One of my favorite tools in Sandata is a dashboard that lists all the top transactions for a selected coin over a specific time frame, letting you see exactly what its biggest holders have been up to.
This is what we get when we ask it for KNC’s biggest transfers over the past 7 days:
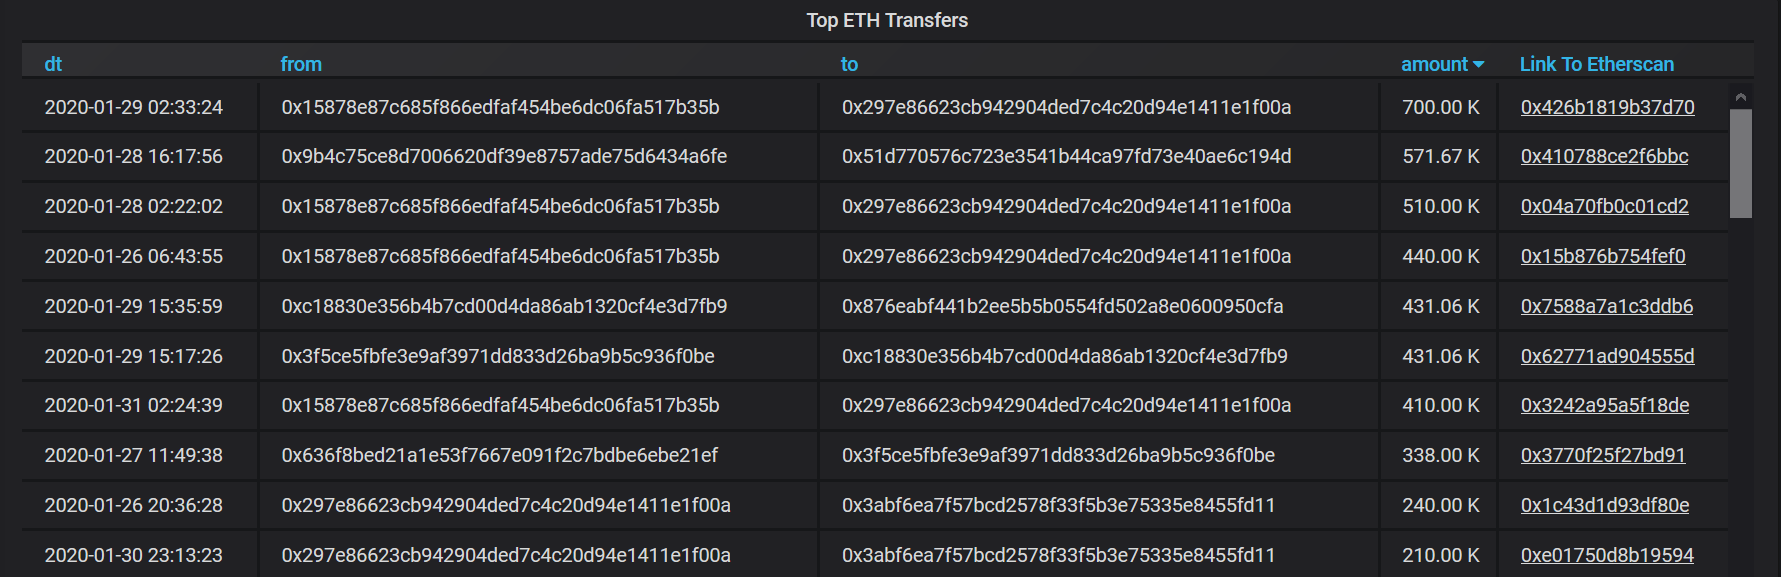
The top transaction on this list is also the most fascinating. Two days ago, 700,000 KNC (~$205,000) was transferred from Mr. 0x158[...] (remember him, he’ll be back) to Mr. 0x297[...].
From that point on, things get a bit...complicated.
24 hours after the above transaction, the recipient address starts moving its KNC bags - at least parts of it. It sends tokens via two smaller transfers - of 200k and 210k KNC, respectively, to a same recipient address - 0x3ab[...], as pictured below:

This new recipient address doesn’t hold on to KNC for long either; it repeats the process, this time chopping the coins into even smaller transactions - unlikely to show up on most ‘whale alert’ signals - and sends it to several addresses:

In fact, it sends most of the coins to 3 particular addresses:
- Address #1 and Address #2, both of which almost immediately proceed to dump those coins to a known Binance wallet, and
- Address #3, which shuffles the coins through several interim addresses before finally sending them back to Mr. 0x158[...]. The original sender.

So in conclusion, the biggest KNC transaction over the last 2 days concluded with the lion’s share of the coins ending up on Binance, and a smaller portion swiftly returned to sender.
Why would someone do this? It’s hard to give a definitive answer, of course, but it could be that this particular whale was moving in to sell some of its KNC bags, while using some of it to inflate the coin’s transaction volumes in hopes of pumping the price even higher before selling.
As I said, it’s just speculation at this point. That said, running this address through our Historical Balance tool shows that his previous KNC dumps were timed just right:

If history is to judge, this address has quite the eye for spotting (and perhaps influencing) Kyber’s interim tops.
That’s why their latest KNC dumps could be noteworthy - other than the 700k transaction covered above, Mr. 0x158[...] has also moved an additional 410k KNC (~$120,000) 24 hours ago - to the same recipient address.
If you’d like to keep a close eye on Mr. 0x158[...] and the rest of its bags, here’s a signal to let you know the moment it starts moving KNC again.
5. A bird’s eye view of the Kyber Network

Finally, we can’t talk about the KNC token’s prospects without also taking a look at the performance of its underlying project - Kyber Network. According to a Binance report - which was, coincidentally, published at the very bottom of KNC’s latest rally:
“Kyber was the most used project in DeFi, with a total of 35,570 unique users in 2019.”
The above Sandata chart shows the overall volume of trades on the Kyber Network since its launch. The growth in Kyber’s trading activity has certainly been impressive, as DEXes are seen more and more as viable alternatives to centralized solutions and continue to alleviate their liquidity issues.
On that note, it’s also worth highlighting Kyber's development activity over the project's entire life span. The team has continued to push code regardless of short-term market conditions, and has proven its dedication to delivering a viable product and polishing its platform.

Regardless of where the price of KNC goes in the next few days or weeks, it’s worth keeping this in mind.
Thanks for reading!
If you enjoyed this insight please leave a like, join discussion in the comments and share it with your friends!
Never miss a post from Ibis!
Get 'early bird' alerts for new insights from this author

Conversations (0)