6 ways you could have caught REN’s summer tops

REN coin has had quite the summer, gaining over 520% since the rally began and eventually hitting its all-time-high $0.143 on August 4th, before heading south:

Sadly for their bag holders, the Republic Protocol’s native token has been on a determined decline since; REN is currently down 67% from its August ATH, and quickly approaching its pre-rally range.
And while the downtrend seems to have caught some off-guard, there have been various indicators throughout the rally which hinted the top(s) for REN were approaching, and the correction was nigh.
Here we’ll take a look at some of these indicators, and investigate two curious sell-offs coming from the Republic Protocol team wallet - both during the rally’s absolute peaks.
1. Elevated Token Age Consumed

Token Age Consumed (also known as Coin Days Destroyed), shows the amount of tokens changing addresses multiplied by the number of days since they last moved.
Put simply, a spike in Token Age Consumed means that previously dormant coins have moved. This can - especially during an uptrend - indicate a long-term investor or HODLer that decided to take advantage of the rally and exit his position, or an incoming market making action, often adversely affecting the price in the process.
This fact makes Token Age Consumed one of the most effective on-chain signals of a looming top. The above graph shows multiple TAC spikes throughout the REN rally, correlating with each interim top and, eventually, the coin’s all-time-high. As is usually the case, a rising sell pressure caused by long-term HODLers looking to dump their coins proved too much for the bulls to absorb time and time again.
Tip: You can keep track of Token Age Consumed for all ERC-20 coins on Sanbase - click the ‘+’ icon in the chart’s upper left corner, select ‘On-chain’, and scroll down to ‘Token Flows’ to find the 'Token Age Consumed' metric.
2. Inflation of REN supply on exchanges

Another effective ‘dump’ indicator in our experience has been the growth in the amount of coin’s total supply stored on exchanges. We’ve seen it many times that a rising % of a coin’s supply in exchange wallets indicates a mounting sell pressure, and vice versa.
This has proved to be the case for REN several times over the summer, where an increase in the share of REN on exchanges meant an incoming top and price correction (highlighted by the 3 blue rectangles above).
The most dramatic example has been the most recent one - REN’s total supply on exchanges spiked from 30.23% on August 11th to 31.70% on August 14th. Relative to its previous supply, that means an almost 5% increase of REN moved into exchange addresses over those 3 days.
Adding REN’s exchange flow balance to the chart gives additional context - more than 9M REN (around $1M at the time) was moved to exchanges on August 12th.

Given the coin was starting to drop off, this was likely a panic sell by those hoping to catch the last leg of a dying rally. That latest pump of REN to exchanges marked the end of its uptrend; the sell pressure proved to be too great to allow for another bounce back.
Tip: You can keep track of any ERC-20 coin’s supply on exchanges on Sanbase: click the ‘+’ icon in the chart’s upper left corner, select ‘On-chain’, and scroll down to ‘Exchange Flow’ to find the 'Percent of Token Supply on Exchanges' metric.
3. Divergence in Price vs Network Activity

Spikes in network activity during an uptrend usually means the coin has started to attract interest beyond its community, as traders and speculators look to take advantage of the rally. The two metrics that are great at highlighting on-chain activity are:
1. Daily Active Addresses - the total number of unique network addresses involved in transactions
2. Network Growth - the number of new addresses being created on the network each day
If a sudden spike in these indicators proves to be short-lived and starts to decline in a matter of days or even hours, it can often signal a pending correction. We’ve seen this developing divergence between on-chain network activity and price action signal a forming top numerous times.
This has also been the case with REN on several occasions, where a rise in on-chain momentum has basically been a rise in speculative interest. As soon as the network activity reverted back to its pre-pump levels, the coin was unable to sustain the uptrend and began correcting downwards.
Tip: You can keep track of Daily Active Addresses and Network Growth for Ethereum and ERC-20 coins on Sanbase: click the ‘+’ icon in the chart’s upper left corner, select ‘On-chain’, and scroll down to ‘Network Activity’ to find these two metrics.
4. Peak social hype
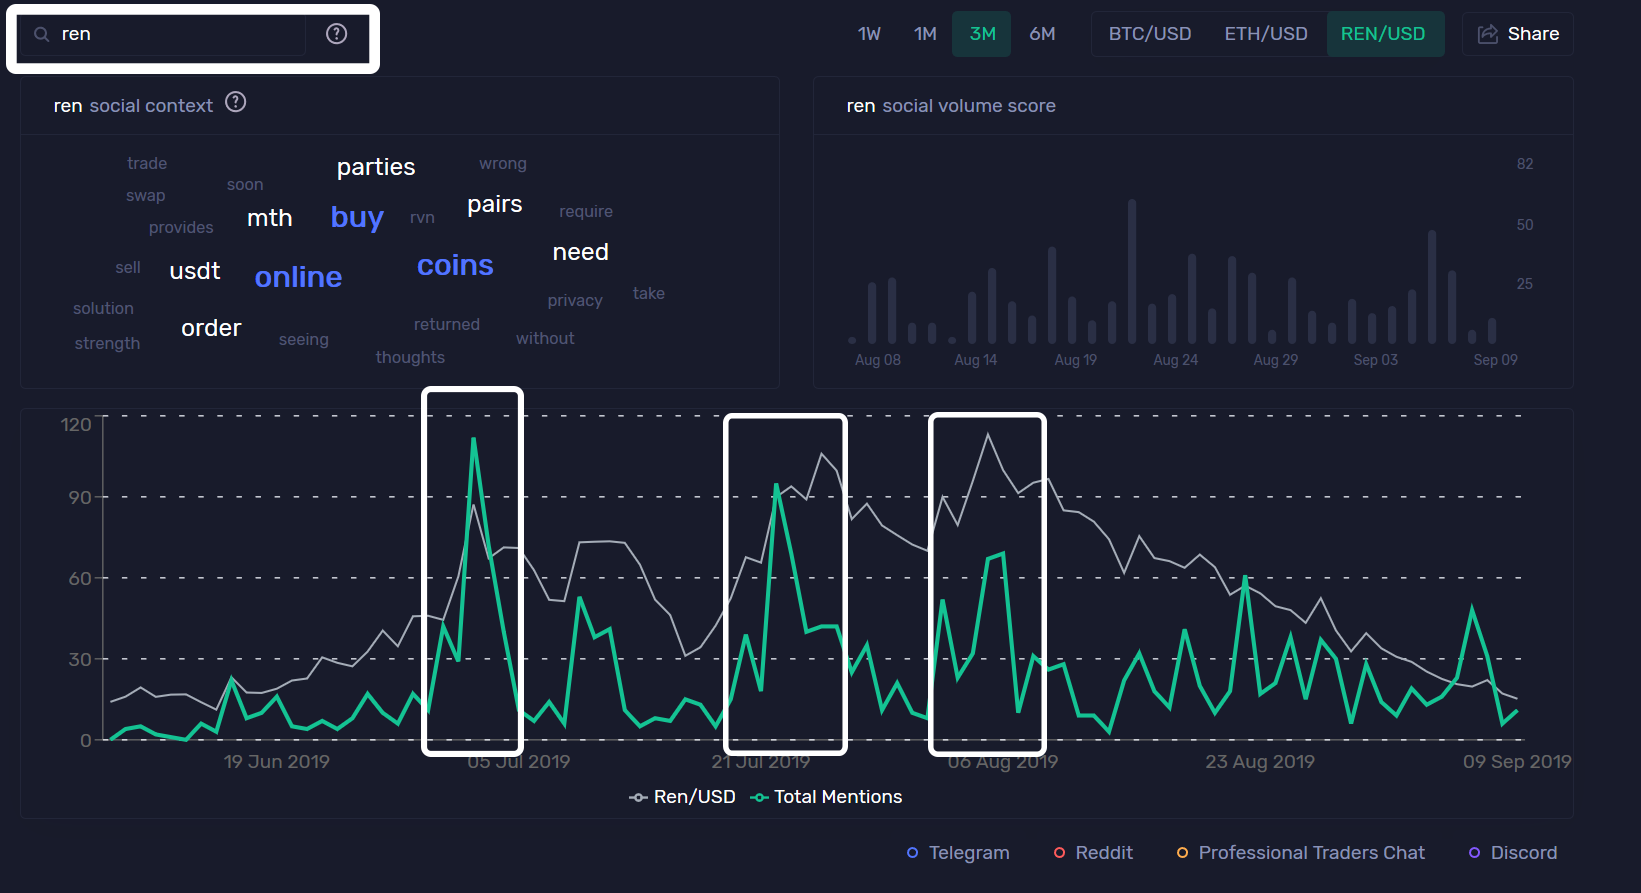
When a coin begins to gain traction on social media during a pump, it’s another tell-tale sign of an incoming top.
This has been the case hundreds of times with our Emerging Social Trends, which calculates the top 10 words gaining most new mentions on crypto social media over the last 9 hours. Whenever a coin shows up on our Emerging Trends list during an uptrend, it’s a strong indicator that the rally has reached peak hype, and we’re due for a retraction.
Same has held true for REN at each of its summer tops, which featured anywhere between 100%-250% spikes in social mentions of the coin. This includes messages from over 1000 crypto-specific social media channels, including Telegram groups, crypto subreddits, private trader chats and more.
Tip: You can keep track of any coin’s mentions on crypto social media on SANbase: click the ‘+’ icon in the chart’s upper left corner, select ‘Social’, and choose ‘Social Volume’ to find the 'Social Volume' metric.
5. REN team wallet activity

While investigating transactional activity near its tops, we found an unexpected market participant during REN’s rally: the Republic Protocol team.
In the past 8 months, REN’s team wallet was active a total of 2 times: once, during the first summer top on July 3rd, and then again right as REN hit its ATH on August 4th.
On July 3rd, around 14.2M REN (~$1.66M at that time) left REN’s wallet, and was distributed across 5 different addresses:

On August 4th, around 16.3M REN (~$2.33M at that time) left REN’s wallet, 10M of which went to one address. That address owner has since moved 2.5M of the REN he received to Binance.

We weren’t able to find any information about the REN team announcing sell-offs to fund further development or for any other reason.
All of which begs the question: did the REN team contribute to the dump(s)? While we can’t be sure how much of an impact these sell-offs had on the price action, it seems prudent to keep an eye on the REN team wallet, as they’ve been proving a reliable top indicator over the past few months
Tip: You can set up activity alerts for REN’s team wallet on Sanbase: use this signal we made (you’ll need to log into Sanbase first), to get notified whenever the Republic Protocol’s team wallet moves REN again in the future, so you can react accordingly:

6. Tracking REN’s biggest transactions
Another nifty Sanbase feature is a dynamic list of the biggest token transactions over the last 30 days, which sits on each coin’s overview page.
According to the list, by far the largest of recent REN transactions happened on August 12th, where someone transferred 6.78M REN (around $751K at the time) to a known Huobi wallet:

Clicking on the sender address opens its historical balance and wallet activity, which reveals the owner’s month-long accumulation period, before dumping it all on Huobi as the PA started to slide downwards:

A closer analysis of the sender address’ activity around that time gives additional context into their behavior. It seems the wallet owner has been withdrawing relatively small amounts of REN from multiple Binance wallets for about a month straight before dumping it all on Huobi - suggesting organized, potentially market making activity:

This is why taking the time to investigate the biggest coin transactions on Sanbase can be so important. Being among the first to realize that almost ¾ of a million dollars worth of REN had just been dumped on Huobi in a methodical, businesslike fashion lets you make a better-informed decision about its potential price trend, or its ability to bounce back.
You’ll notice that the same address seems to be heading into REN once again, currently holding around 272K, or about $10.8k at the time of writing. The same person has also been accumulating a LOT of DOCK and a few other coins as of late, so it’s definitely worth keeping an eye on what they do next:

Tip: You can set up activity alerts for this (or any other) wallet on Sanbase: go to their wallet activity page and click on ‘Generate Signal’ below the address (you’ll need to log into Sanbase first). Choose the asset (in this case, REN), you want to track and select the ‘Above’ or ‘Below’ threshold that will trigger the alert as they add or remove REN from their wallet.
So there you have it - 6 different ways you could’ve spotted when REN was about to dump with Sanbase tools and metrics.
Check out all the indicators mentioned here on our site - and if you want full historical and present-day data for BTC, ETH and 600+ ERC-20 coins, upgrade to one of our paid plans to get the full picture, every time.
Thanks for reading!
If you enjoyed this insight please leave a like, join discussion in the comments and share it with your friends!
Never miss a post from Ibis!
Get 'early bird' alerts for new insights from this author

Conversations (0)