Bold Predictions XVI: Has Euphoria Taken Over?

SANBASE SIGNALS
August 11, 2020
To comprehend just how much investors and traders in cryptocurrency have been thriving both short-term and long-term, take a look at this below chart, which reflects the average returns of traders per asset on both the 30-day and 1-year time frames:

As we can see, it's almost universally been in the black for traders. And these aren't just overall price changes. These are returns for average traders, which our MVRV metric accounts for buys and sells along the way. Typically, the average trader does far worse than the actual market price fluctuations of an asset, due to mistakes like FOMOing in too late or FUDing too early. With crypto being a zero sum game, this causes a small percentage of traders to profit over time from a much larger percentage of traders that lose money to them.
But with the state of these markets, assets have been almost exclusively in profit for traders, in spite of the mistakes that they make. In other words, we are well over-inflated from an average trader return perspective. This certainly doesn't mean this long bullish rally since mid-March's bottom, is over. But it does mean that when things do finally retrace, particularly for altcoins, they will likely crash rather hard.
These euphoric states of the market are often the times that savvy traders and investors opt to take profit, rather than continue to have faith that things will just "continue to rocket to the moon" forever. In this week's Bold Predictions edition, we have taken a look at just how euphoric the markets have become. And whether it's time for us to brace ourselves for a potential upcoming pullback by analyzing some of our best leading indicators available to Sanbase PRO members any time.
We continue to offer 25% off your first month's subscription on any Santiment service you have your eye on! Just take 15 seconds to provide feedback for us on this poll. Then just visit the Sanbase pricing page to get started with your 25% discount now, and enter SIGNALS25 at checkout! Any help needed on redeeming this, just email us at support@santiment.net.
With every weekly volume we release of our Bold Predictions series, we are taking a look at the most recent three-day averages (or percent changes) for each metric we're covering. As a reminder, these signals are for intra-day traders to assess local tops and bottoms based on historically solid leading indicators. Our rating system is simplified for this week. A 0 to 10 scale, with 0 being as bearish as possible and 10 being as bullish as possible. This would mean that a 5 would be neutral and imply sideways movement estimates over the next week. Whether we call a project bullish or bearish for the next week or two, please remember that this has no relevance to what we think of the asset's long-term viability as an investment.
----------------------------------------------------------------------------------
This Week’s Assets:
- BTC, ETH, BAT, REN
This Week’s Metric Breakdowns:
- DAA vs. Price Divergence (2-Year Deviation From Mean), MVRV (30-Day), NVT, Weighted Social Sentiment (Twitter)
----------------------------------------------------------------------------------
Bitcoin ($BTC) - #1 Ranked Market Cap
- 3-Day Movement: -4.4%
- 30-Day Movement: +20.8%
- 90-Day Movement: +20.9%
DAA vs. Price Divergence (Long-Term Deviation)

Bitcoin just scraped above $12,000 for a second time a couple evenings ago, but it didn't stay for long. It appears that the lack of addresses interacting on BTC's network has a lot to do with that, according to our DAA vs. Price Divergence model. Two consecutive neon red bars have popped up the past couple of days, making this the first time since February to have two bottom 10% ranked daily active address ratings vs. respective price levels. This is a pretty big cautionary indicator that if DAA doesn't improve soon, a medium to large pullback can take place by the end of August.
Rating: 1.5
MVRV (30-Day)

The average BTC trader that bought 30 days ago is estimated to be +8% on their investment, in spite of the fact that the #1 market cap ranked coin has doubled this return by market value. It appears that traders took a major hit when FUD took over from $12k back to $11k, and these same traders did not buy back in as it rose back up to $12k. Nevertheless, the average trader is still above water, which means that eventually we will see this retrace back to 0%, where every asset has its neutral resting state. This isn't a serious level above the norm, but it's a slightly bearish sign.
Rating: 4.0
NVT

Unique tokens being moved on Bitcoin's network have been shuffling back and forth in a neutral state for much of August. This is actually a welcome sign, as both June and July showed that there was a notable deficit in its NVT that foreshadowed that this recent $12k level was looking a bit too high. With tokens beginning to shuffle around more at a higher rate, this will be a key model to keep an eye on as August's remaining three weeks of data come in.
Rating: 5.0
Weighted Social Sentiment

Bitcoin's social sentiment has been coming down since its first explosion to $12k at the beginning of the month, but the positivity levels on Twitter are still hovering around a +1.0 level above its normal standard deviation. This means that there is still a bit too much elation, which is a sign that prices could retrace based on what history has taught us about this coveted social metric.
Rating: 3.0
BTC Average Rating: 3.4 (Slightly Bearish/Bearish)
----------------------------------------------------------------------------------
Ethereum ($ETH) - #2 Ranked Market Cap
- 3-Day Movement: -5.2%
- 30-Day Movement: +53.9%
- 90-Day Movement: +87.0%
DAA vs. Price Divergence (Long-Term Deviation)

Well this doesn't look so good for Ethereum holders. There is a clear warning sign flashing that tells us that this $400 level came a bit too fast based on the amount of address activity taking place on ETH's network. The two recent neon red signals are actually the largest bearish signals we have seen in 2020 on this model, signifying that there is a major deficit in daily active addresses transacting at these price levels. Profit taking opportunities haven't come often since Black Thursday, but our DAA vs. Price Divergence is pointing at this as one of them.
Rating: 0.5
MVRV (30-Day)

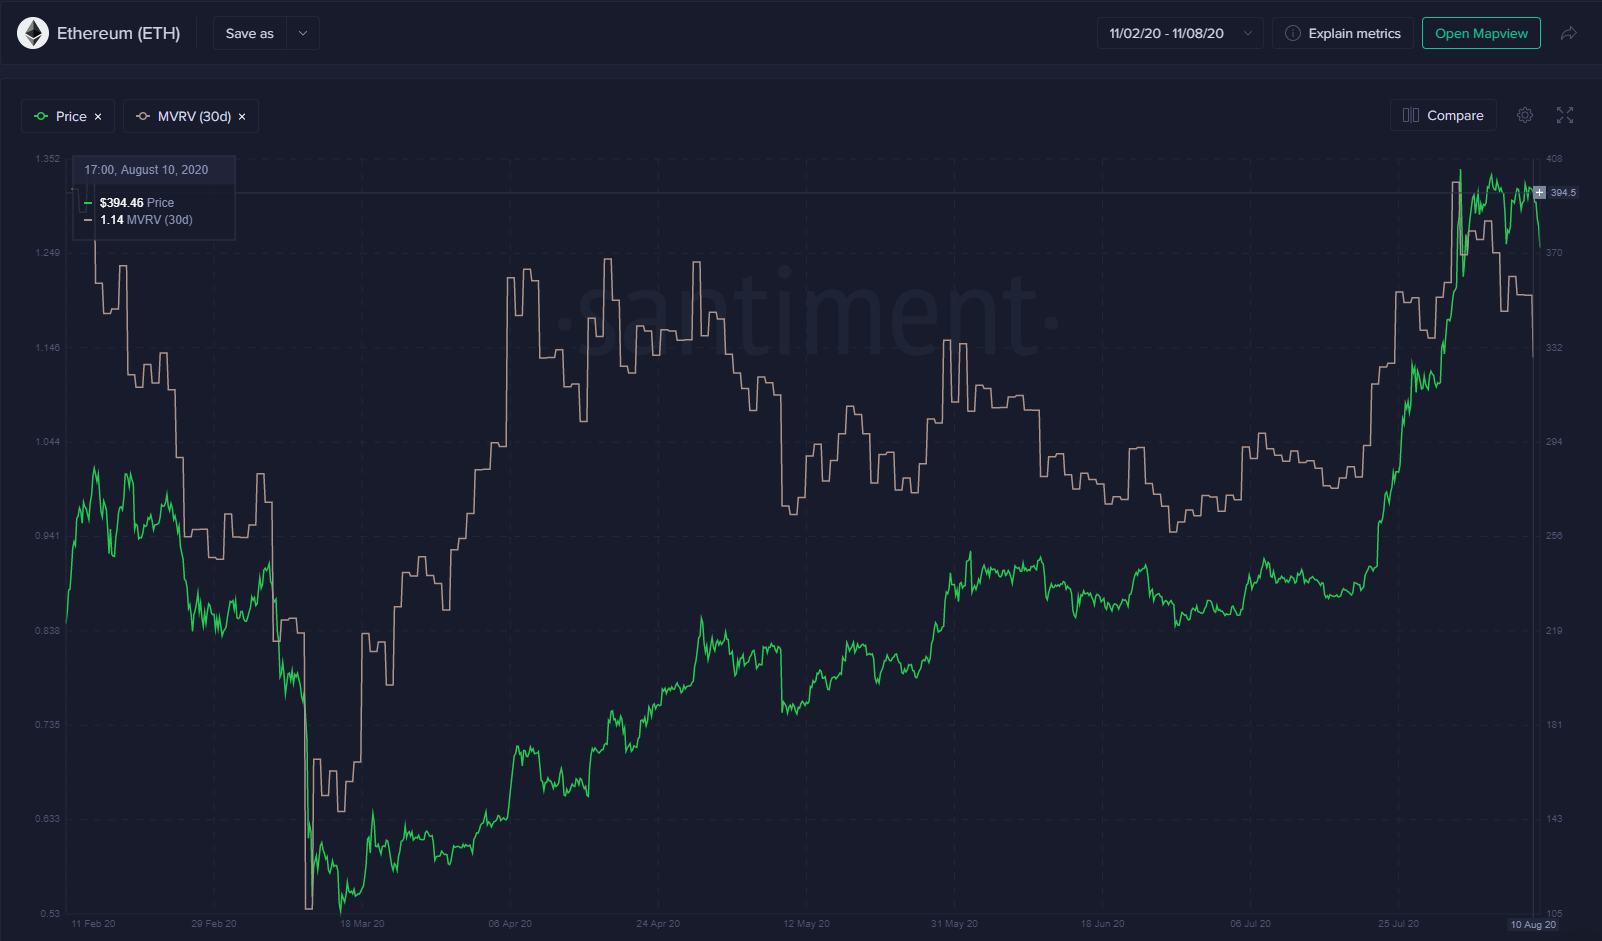
Ethereum holders are still up an average of 14% on the 30-day time frame after getting a bit faked out on this triple top that formed around the $400 range this past week. This metric still indicates that there could be some further downside, and +14% in one month is still quite high for the #2 market cap ranked coin historically.
Rating: 2.5
NVT

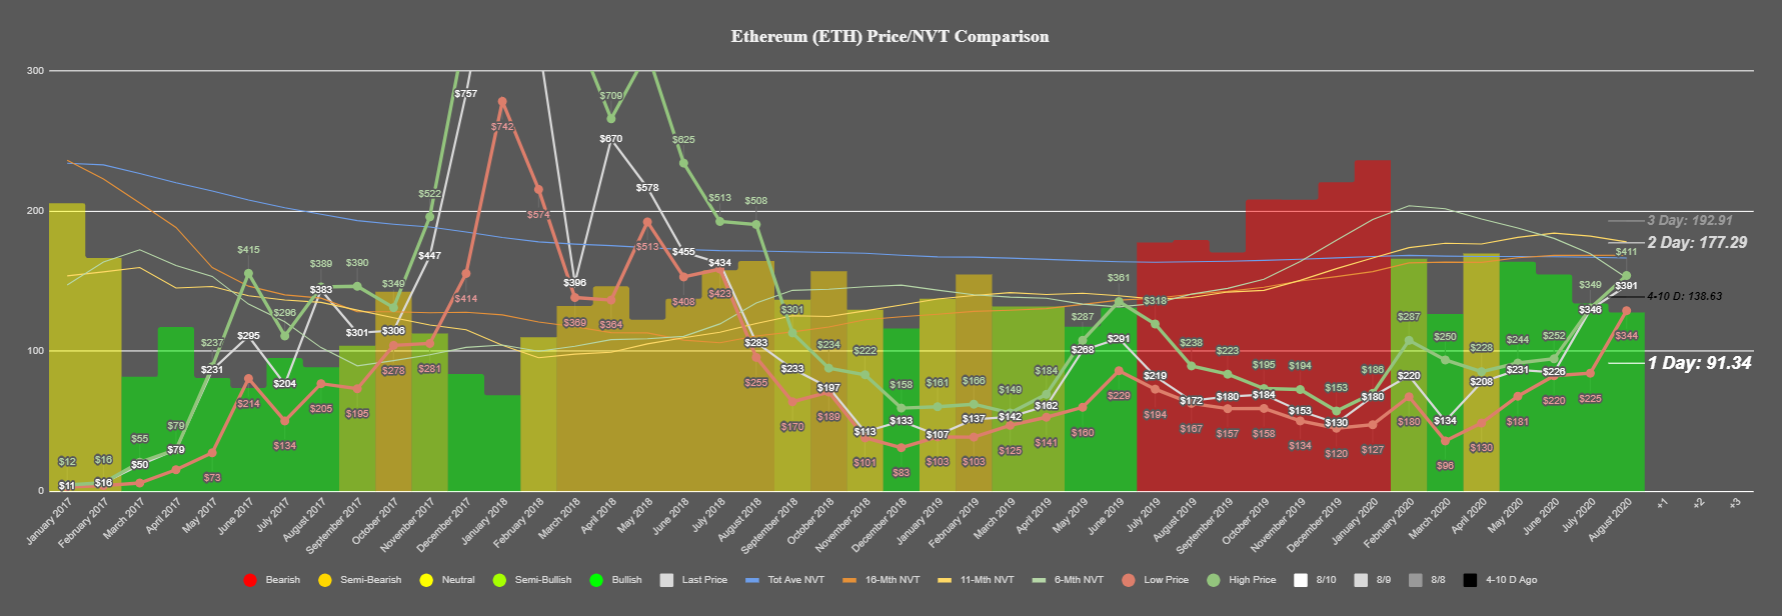
Unlike daily active addresses, Ethereum's NVT is telling a much different story. Unique tokens are being moved at the highest rate on ETH's network since March, which is mildly surprising. We put a bit more credence in the DAA vs. Price model right now, but the healthy amount of activity on the NVT side of things is indicative that Ethereum probably won't be hit quite as hard as some other altcoins if there is indeed an imminent alt correction upcoming.
Rating: 8.0
Weighted Social Sentiment

Ethereum's social sentiment is sky-high, and is so high in fact, that this is the largest positive deviation from normal social sentiment levels in ETH's history. This is a classic case of the crypto community being simultaneously euphoric about a coin's prospects with very few people willing to be bearish on the highly reputable project. But if history has taught us anything, buying into a euphorically viewed asset is the worst time to do so.
Rating: 0.0
ETH Average Rating: 2.8 (Bearish)
----------------------------------------------------------------------------------
Basic Attention Token ($BAT) - #32 Ranked Market Cap
- 3-Day Movement: -2.4%
- 30-Day Movement: -1.8%
- 90-Day Movement: +26.1%
DAA vs. Price Divergence (Long-Term Deviation)

Basic Attention Token has actually been one of the few coins to have a minor bullish divergence on our model as of late. And price has reacted accordingly, as it decoupled from BTC somewhat over the past couple of days to make approximate 6-month price highs. Things are pretty close to neutral now as of the time of this writing, so we advise keeping your trades on the sidelines until the developments of this BTC pullback fully play out.
Rating: 5.0
MVRV (30-Day)

30-day returns for the average trader of BAT are pretty close to neutral, if just a tad highly above 0. A +5% return is still something, and we'll be just slightly bearish on it according to this model until it returns back to its norm.
Rating: 4.0
NVT

There has been excellent token circulation for BAT since February, but there is a bit less so than there was in June and July. The signal is still as green as ever, making our stance bullish based on this model. But we take a slight amount away from it since token circulation has taken a very small step back.
Rating: 7.0
Weighted Social Sentiment

BAT social sentiment on Twitter has been on the rise, and currently sits at just below +1.0 compared to its mean. It takes some high levels for altcoins outside of the top 20 to be really impacted by this metric too much, so we only give it a minor hit for the crowd being a bit overly positive right now.
Rating: 3.5
BAT Average Rating: 4.9 (Neutral)
----------------------------------------------------------------------------------
Ren ($REN) - #54 Ranked Market Cap
- 3-Day Movement: +10.1%
- 30-Day Movement: +24.5%
- 90-Day Movement: +203.7%
DAA vs. Price Divergence (Long-Term Deviation)

REN has been arguable the standout project gaining the most increase in recognition in 2020, outside of perhaps LINK. But there is some legitimate caution that needs to be taken here after we have seen five days of neon red (indicating bottom 10% DAA levels vs. price) this week. The long-term fundamentals for Ren can still have a legitimate argument for making it one of the most intriguing ERC-20's moving forward, but short-term could be pretty dicey according to its daily active address activity.
Rating: 5.0
MVRV (30-Day)

As you may expect, the average trader is up A TON on Ren right now. +36% in 30 days, in fact. This is one of the largest 30-day MVRV's we will typically see, as anything over than +1% per day is hard for an extended period. Regardless, this looks like a short to mid-term bearish sign that we advise traders to take pretty seriously.
Rating: 1.0
NVT

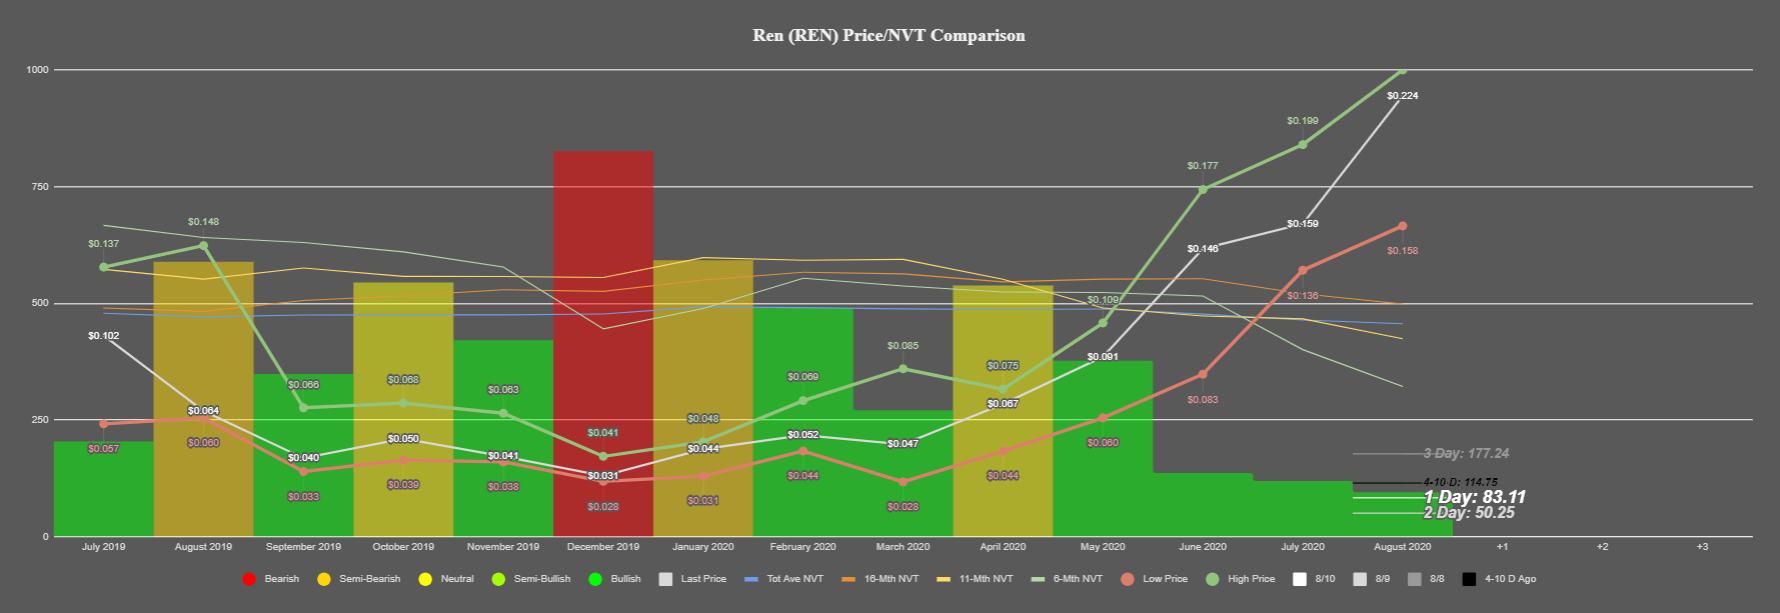
Token circulation for REN continues to look excellent, and has been a clear metric that has supported a propel into this all-time high levels. With each month improving upon the last since April, this is one of the few metrics we're seeing that can make the argument for a continue rally.
Rating: 9.0
Weighted Social Sentiment

Ren's weighted social sentiment has more or less stayed pretty neutral, in spite of its unfathomable price launch these past few months. It has just recently taken a very small dip into negative territory, as people are doubting this latest rally. So we're giving it a very small bullish boost for this reason.
Rating: 6.0
REN Average Rating: 5.3 (Neutral)
----------------------------------------------------------------------------------
Our indicators are pointing to more and more arguments that the altcoin market has become overheated. With even BTC's metrics looking a bit shaky right now, there could be some pain coming for traders in the near future unless address activity in particular starts to display a major uptick in the second half of August.