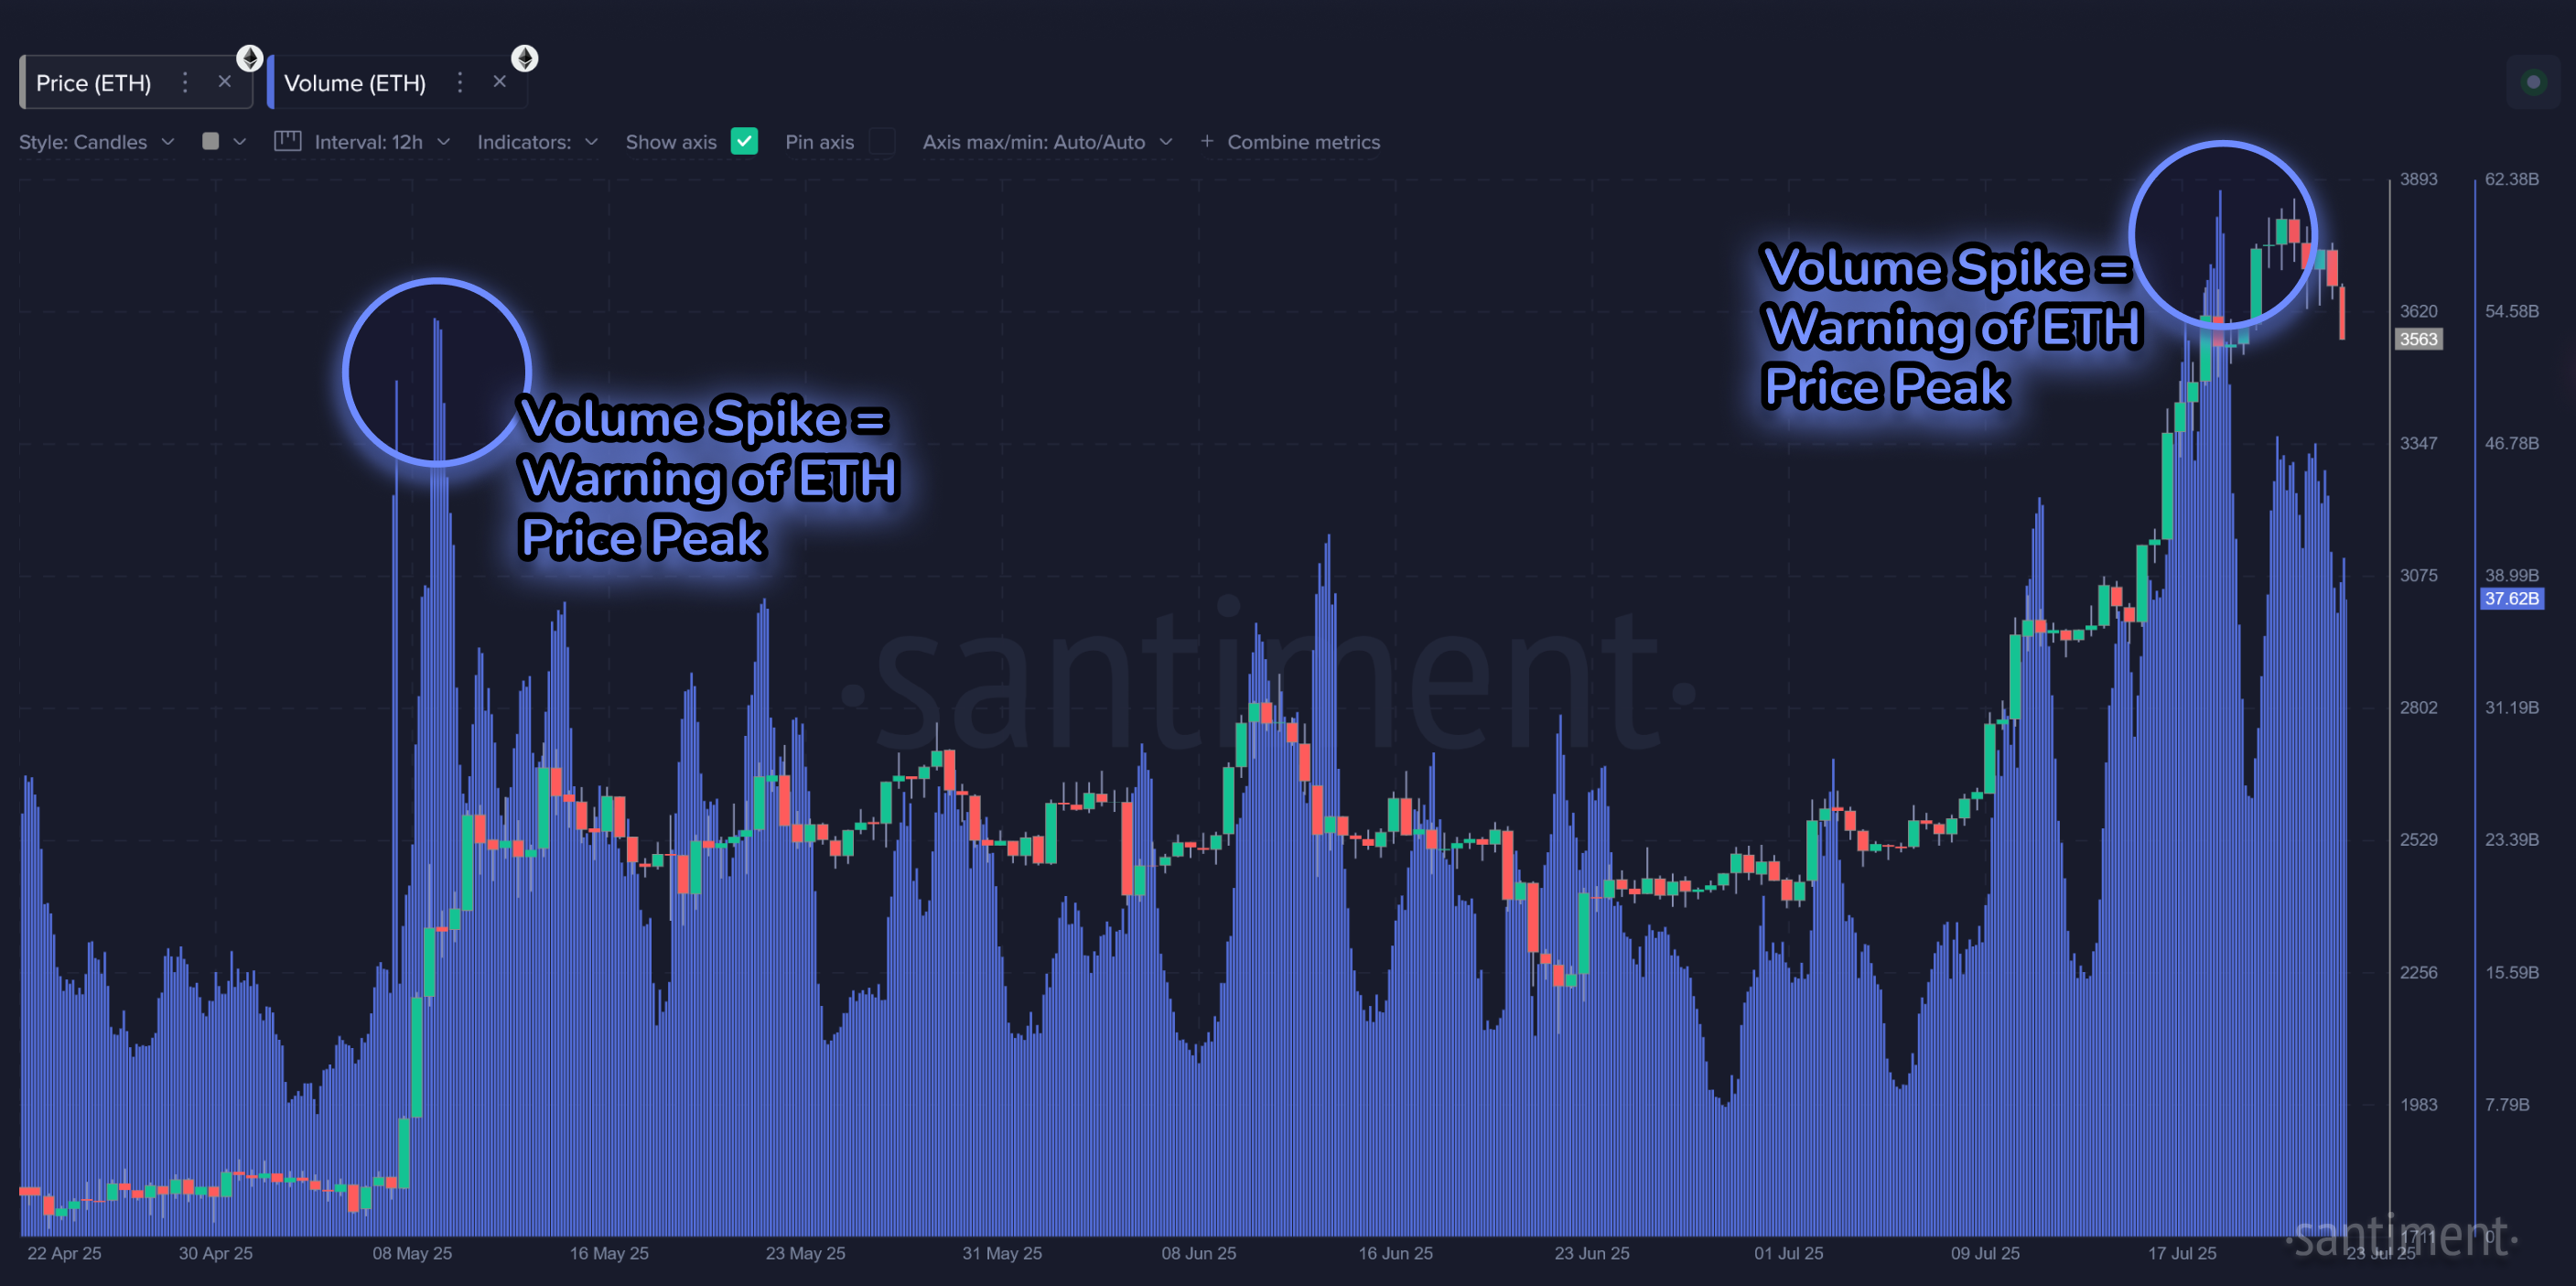

📊 Ethereum's price ratio vs. Bitcoin has fallen -5.8% in the past 60 hours. A major FOMO-driven $ETH trading volume spike, just like we sa...
ETH
📊 Ethereum's price ratio vs. Bitcoin has fallen -5.8% in the past 60 hours. A major FOMO-driven $ETH trading volume spike, just like we sa...
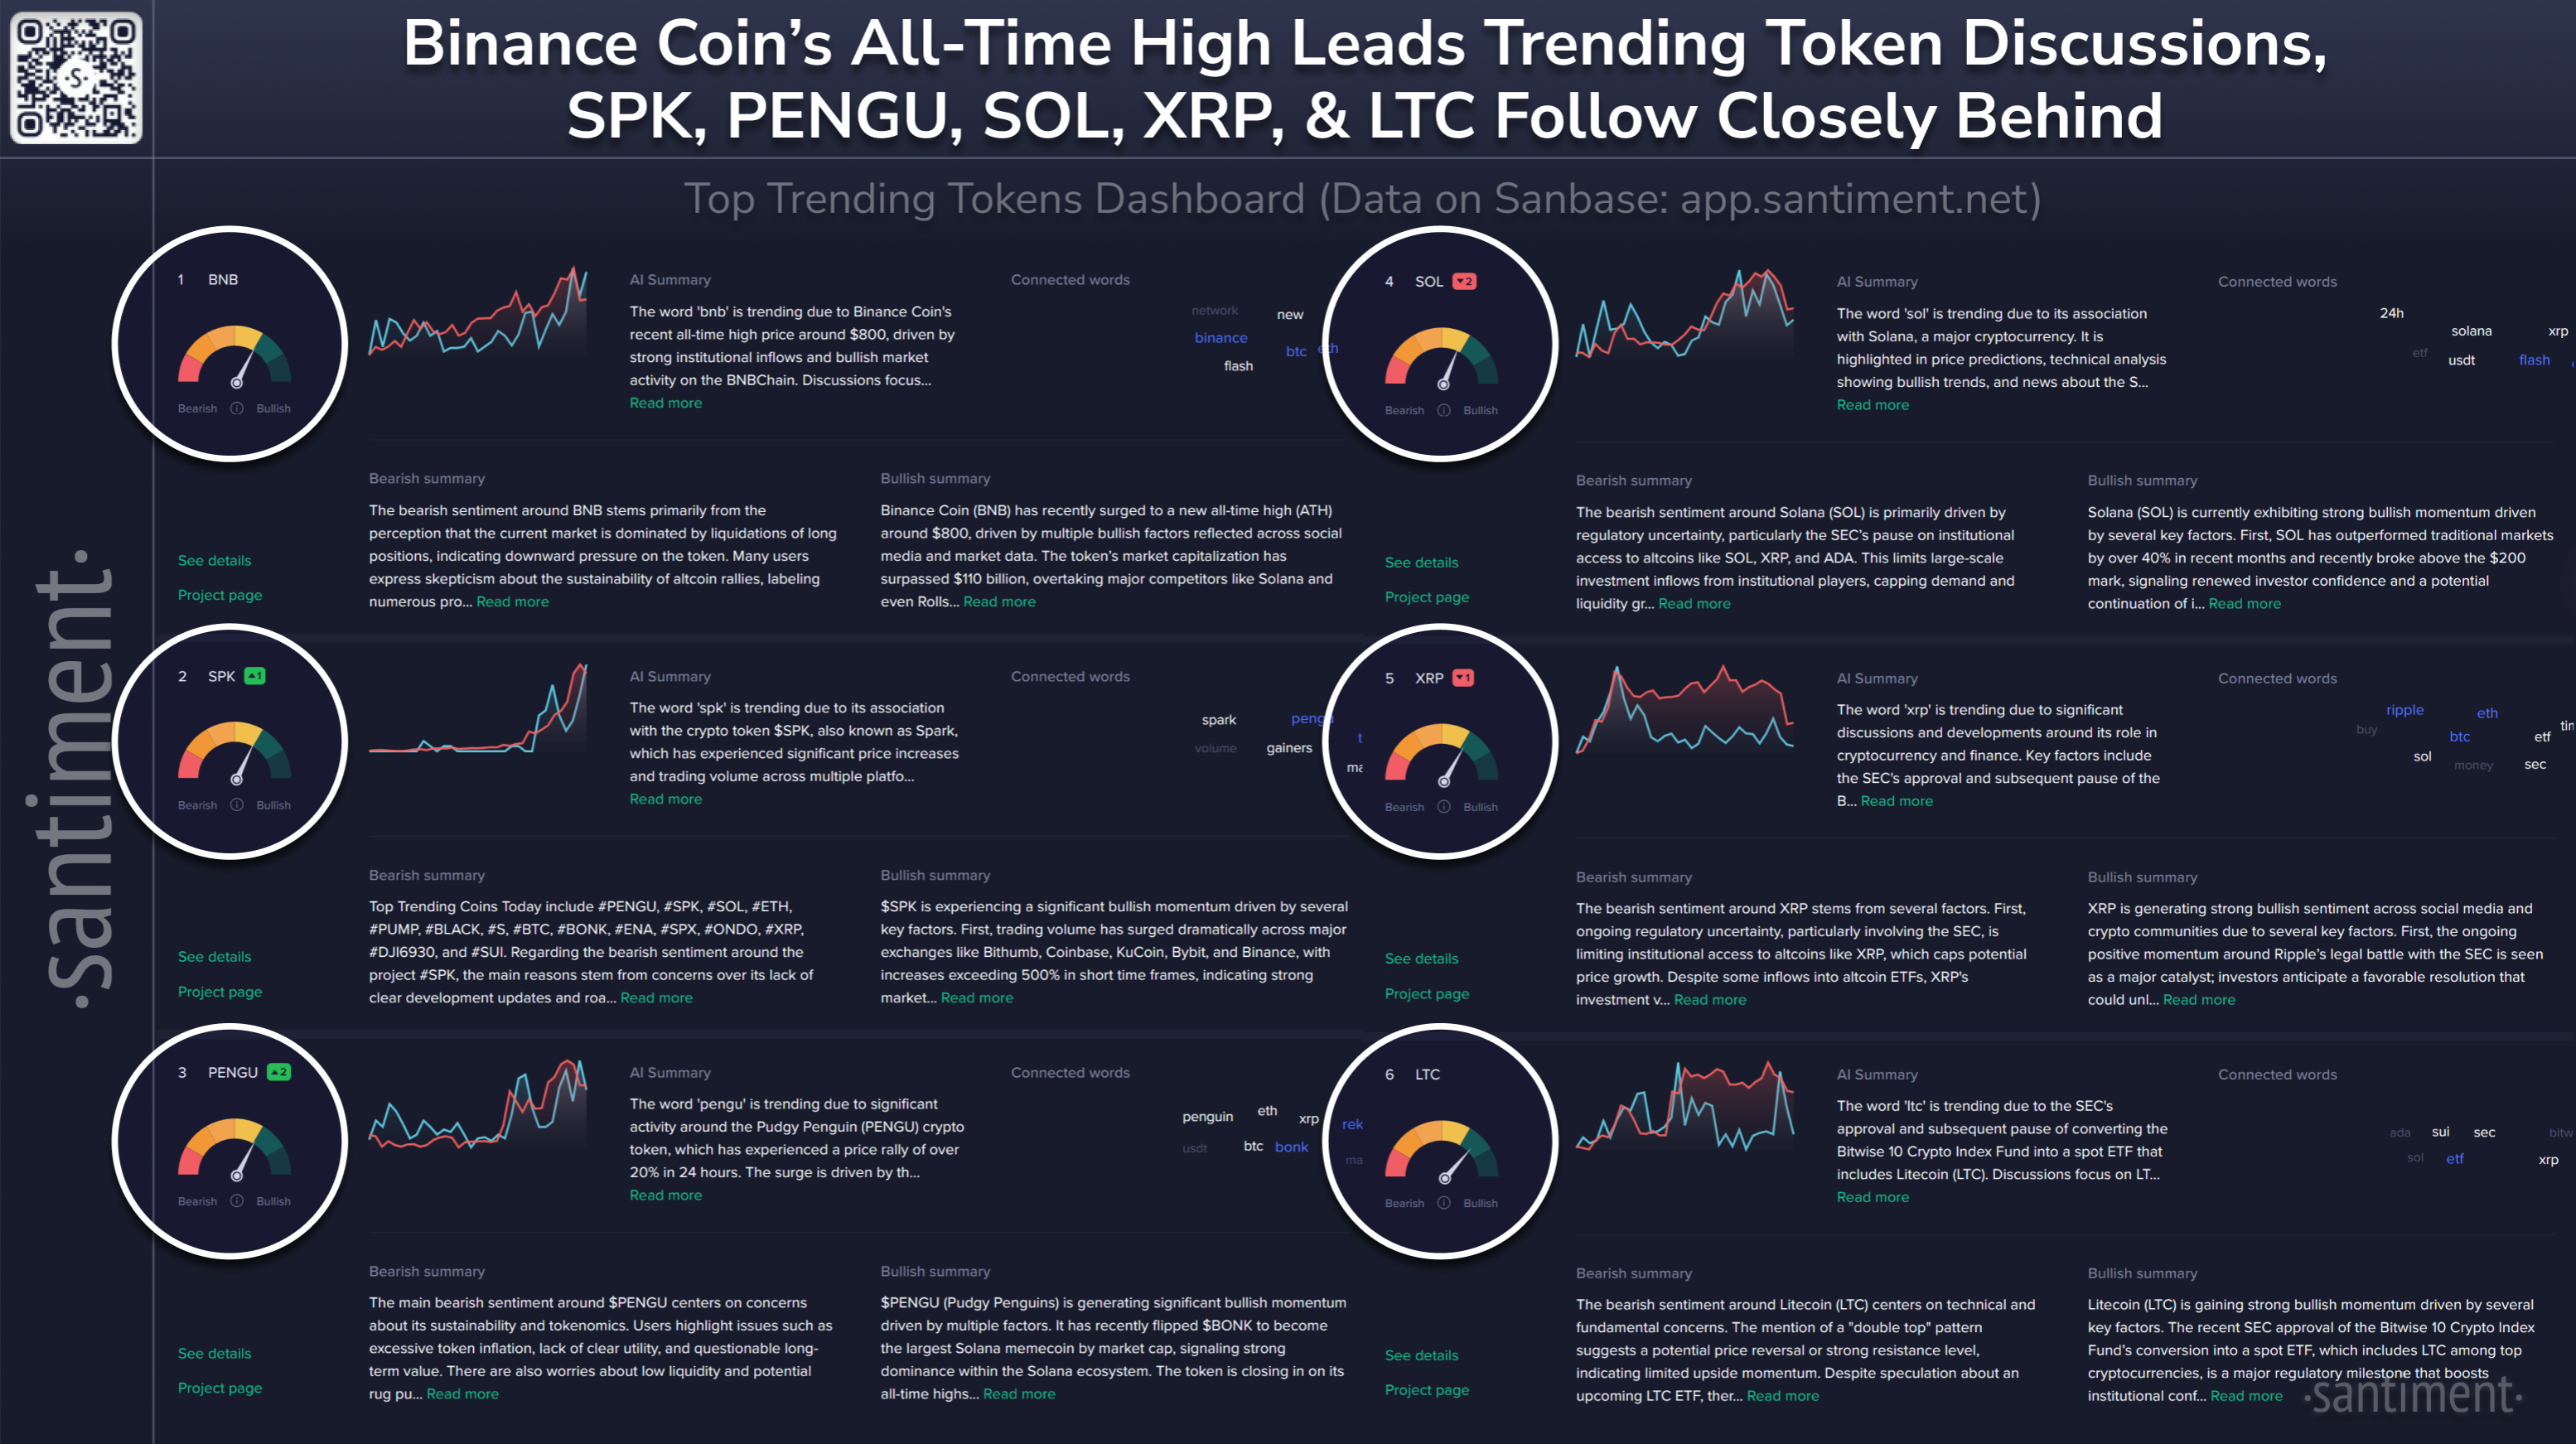
🗣️ The cryptocurrencies seeing the highest rise in traction across social media today are: 🪙 Binance Coin $BNB is trending due to Binanc...
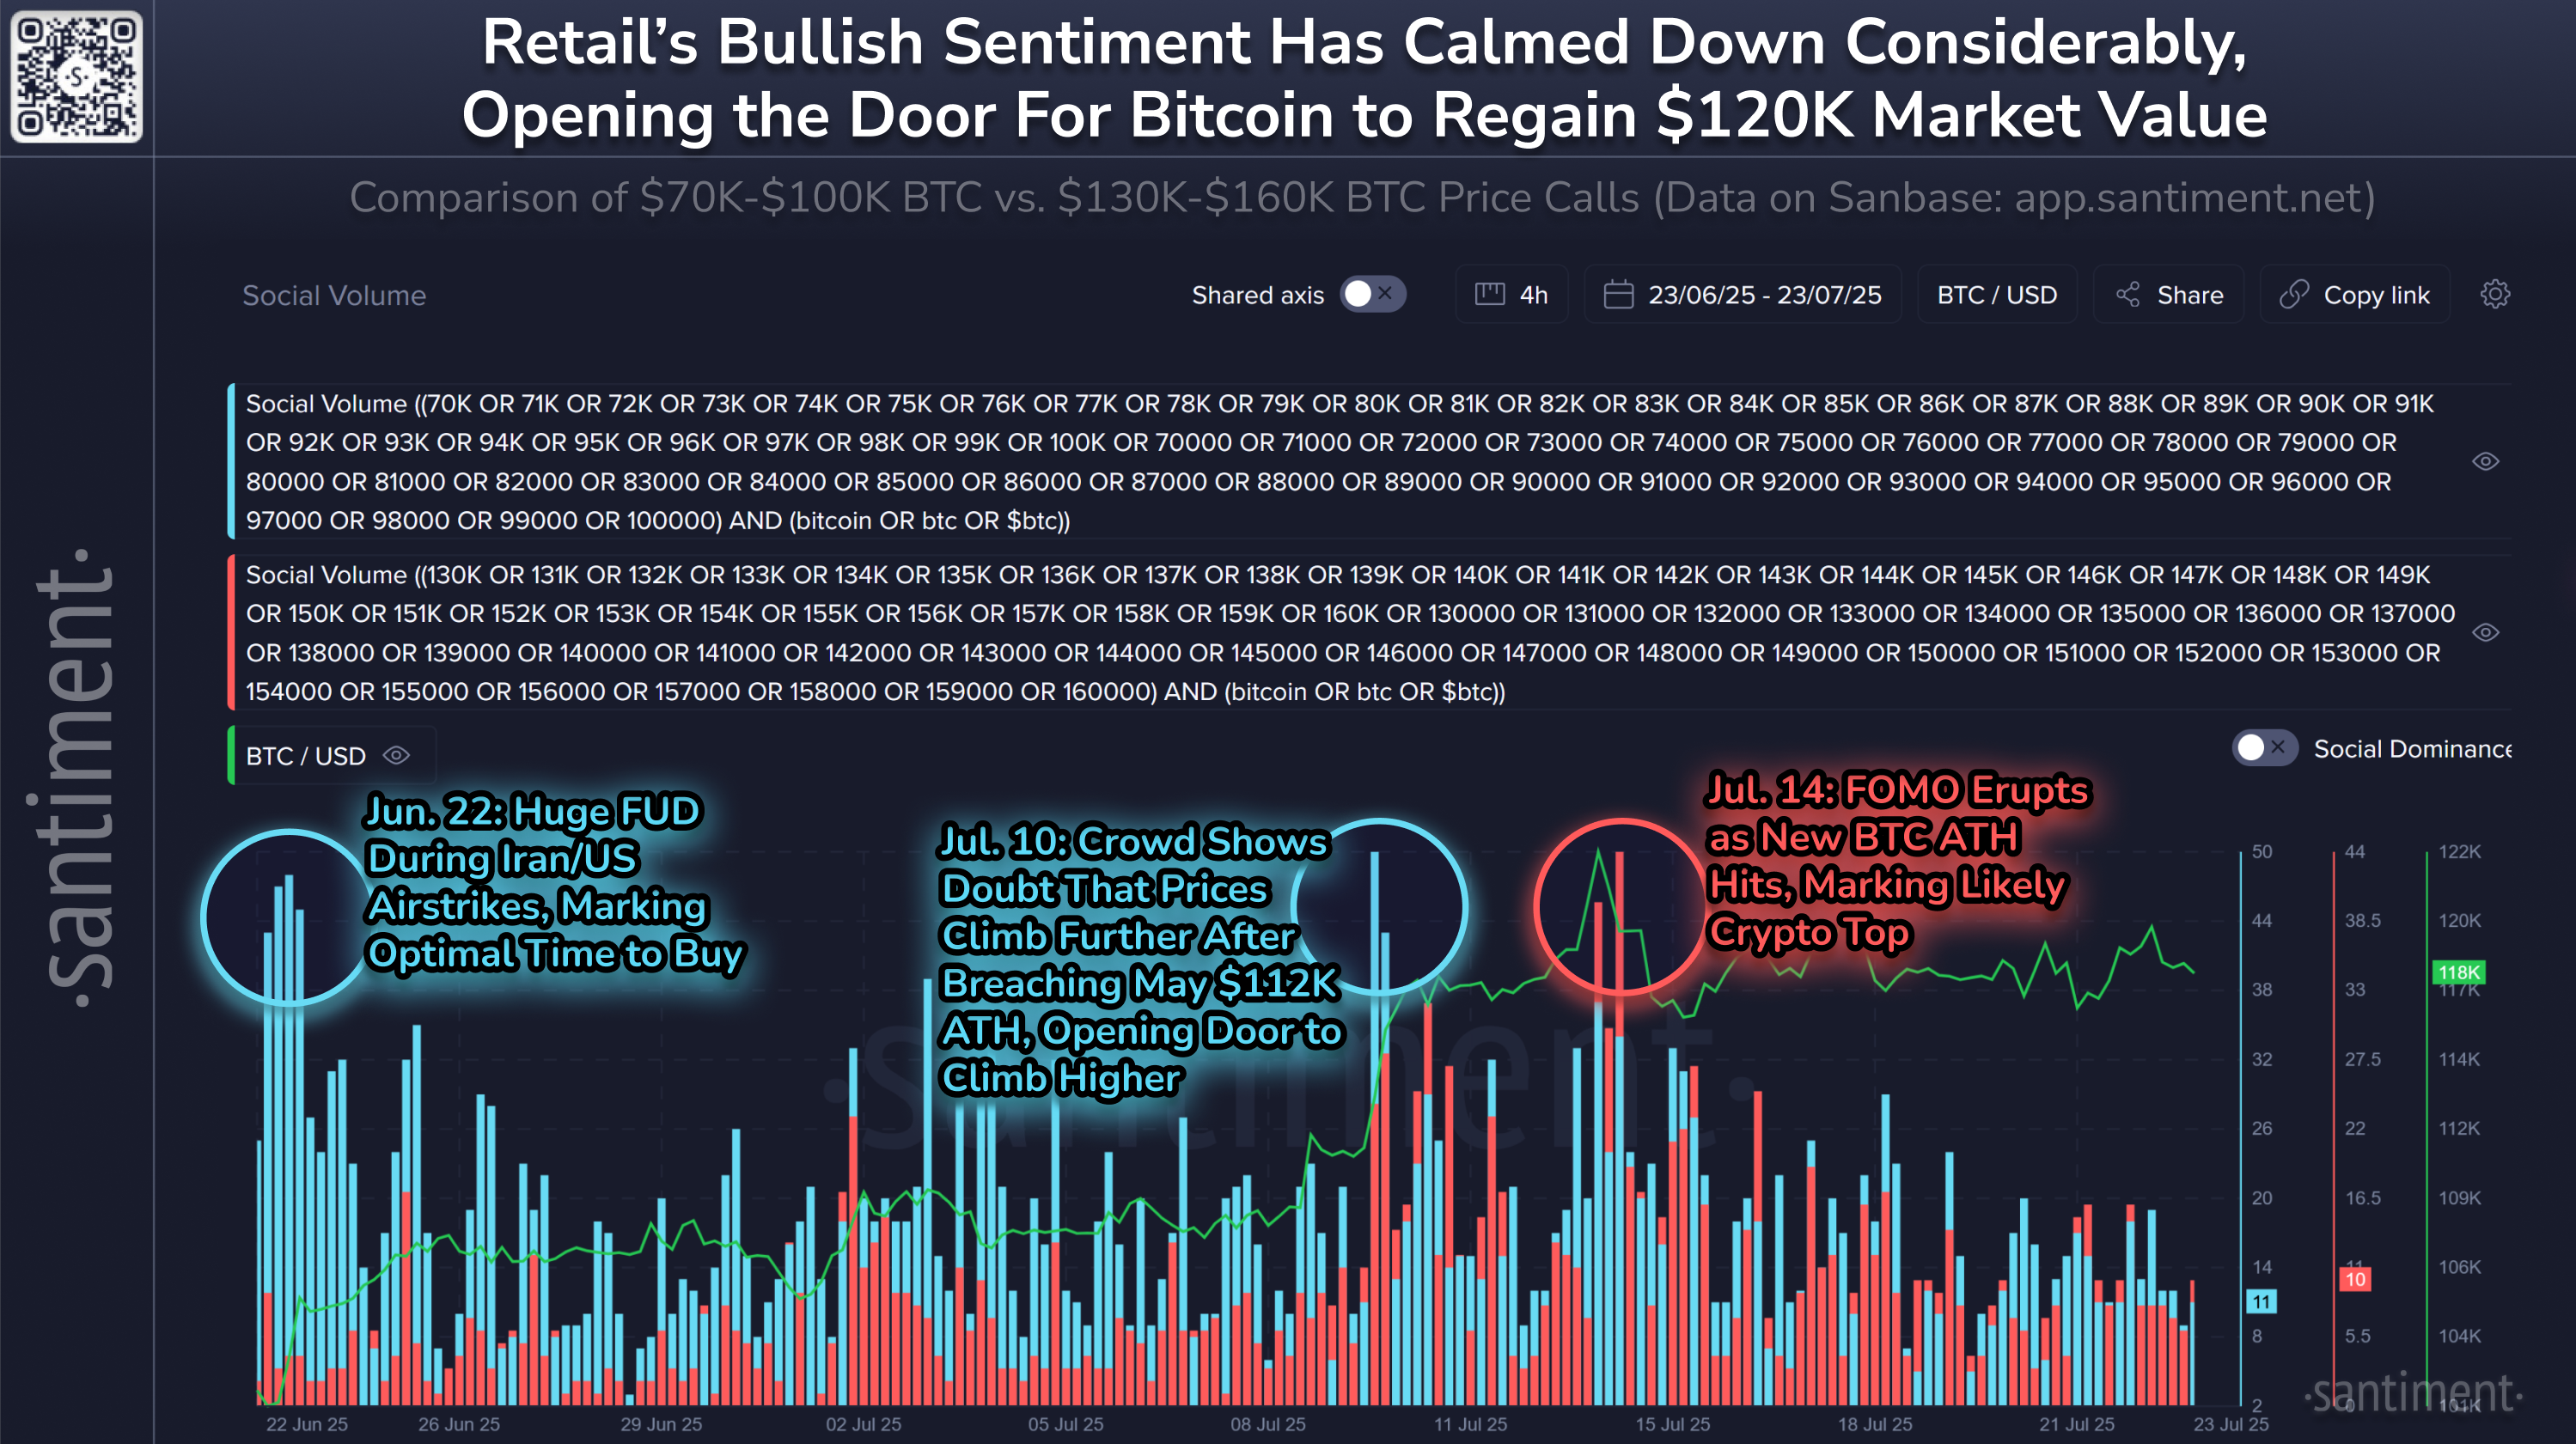
🤫 Bitcoin retail has been quiet, with few calls for higher price levels. The dust has settled from the July 14th $123,077 all-time high, ...

🧑💻 Here are crypto's top overall coins by notable development activity the past 30 days. Directional indicators represent each project'...
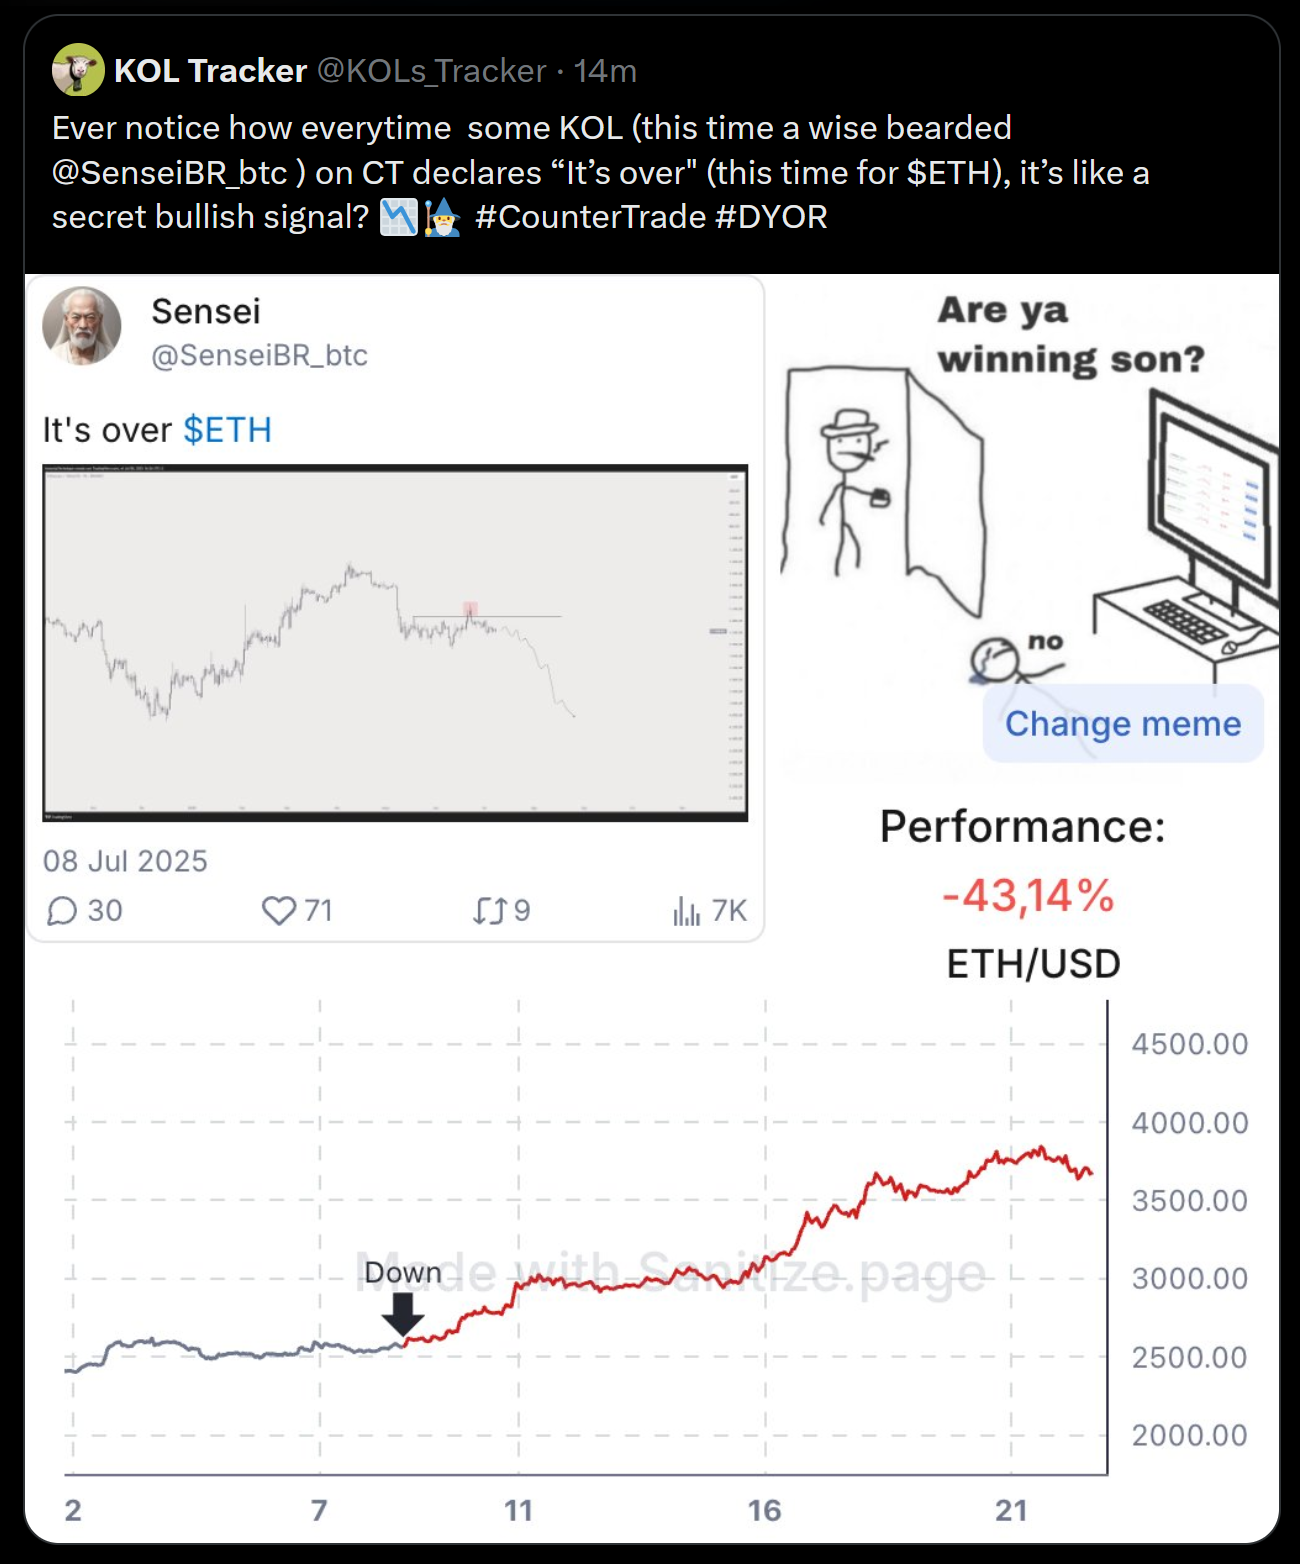
🧐 Ethereum's market value is +46% since this crypto KOL claimed "it's over". As is usually the case, markets move the opposite direction of...
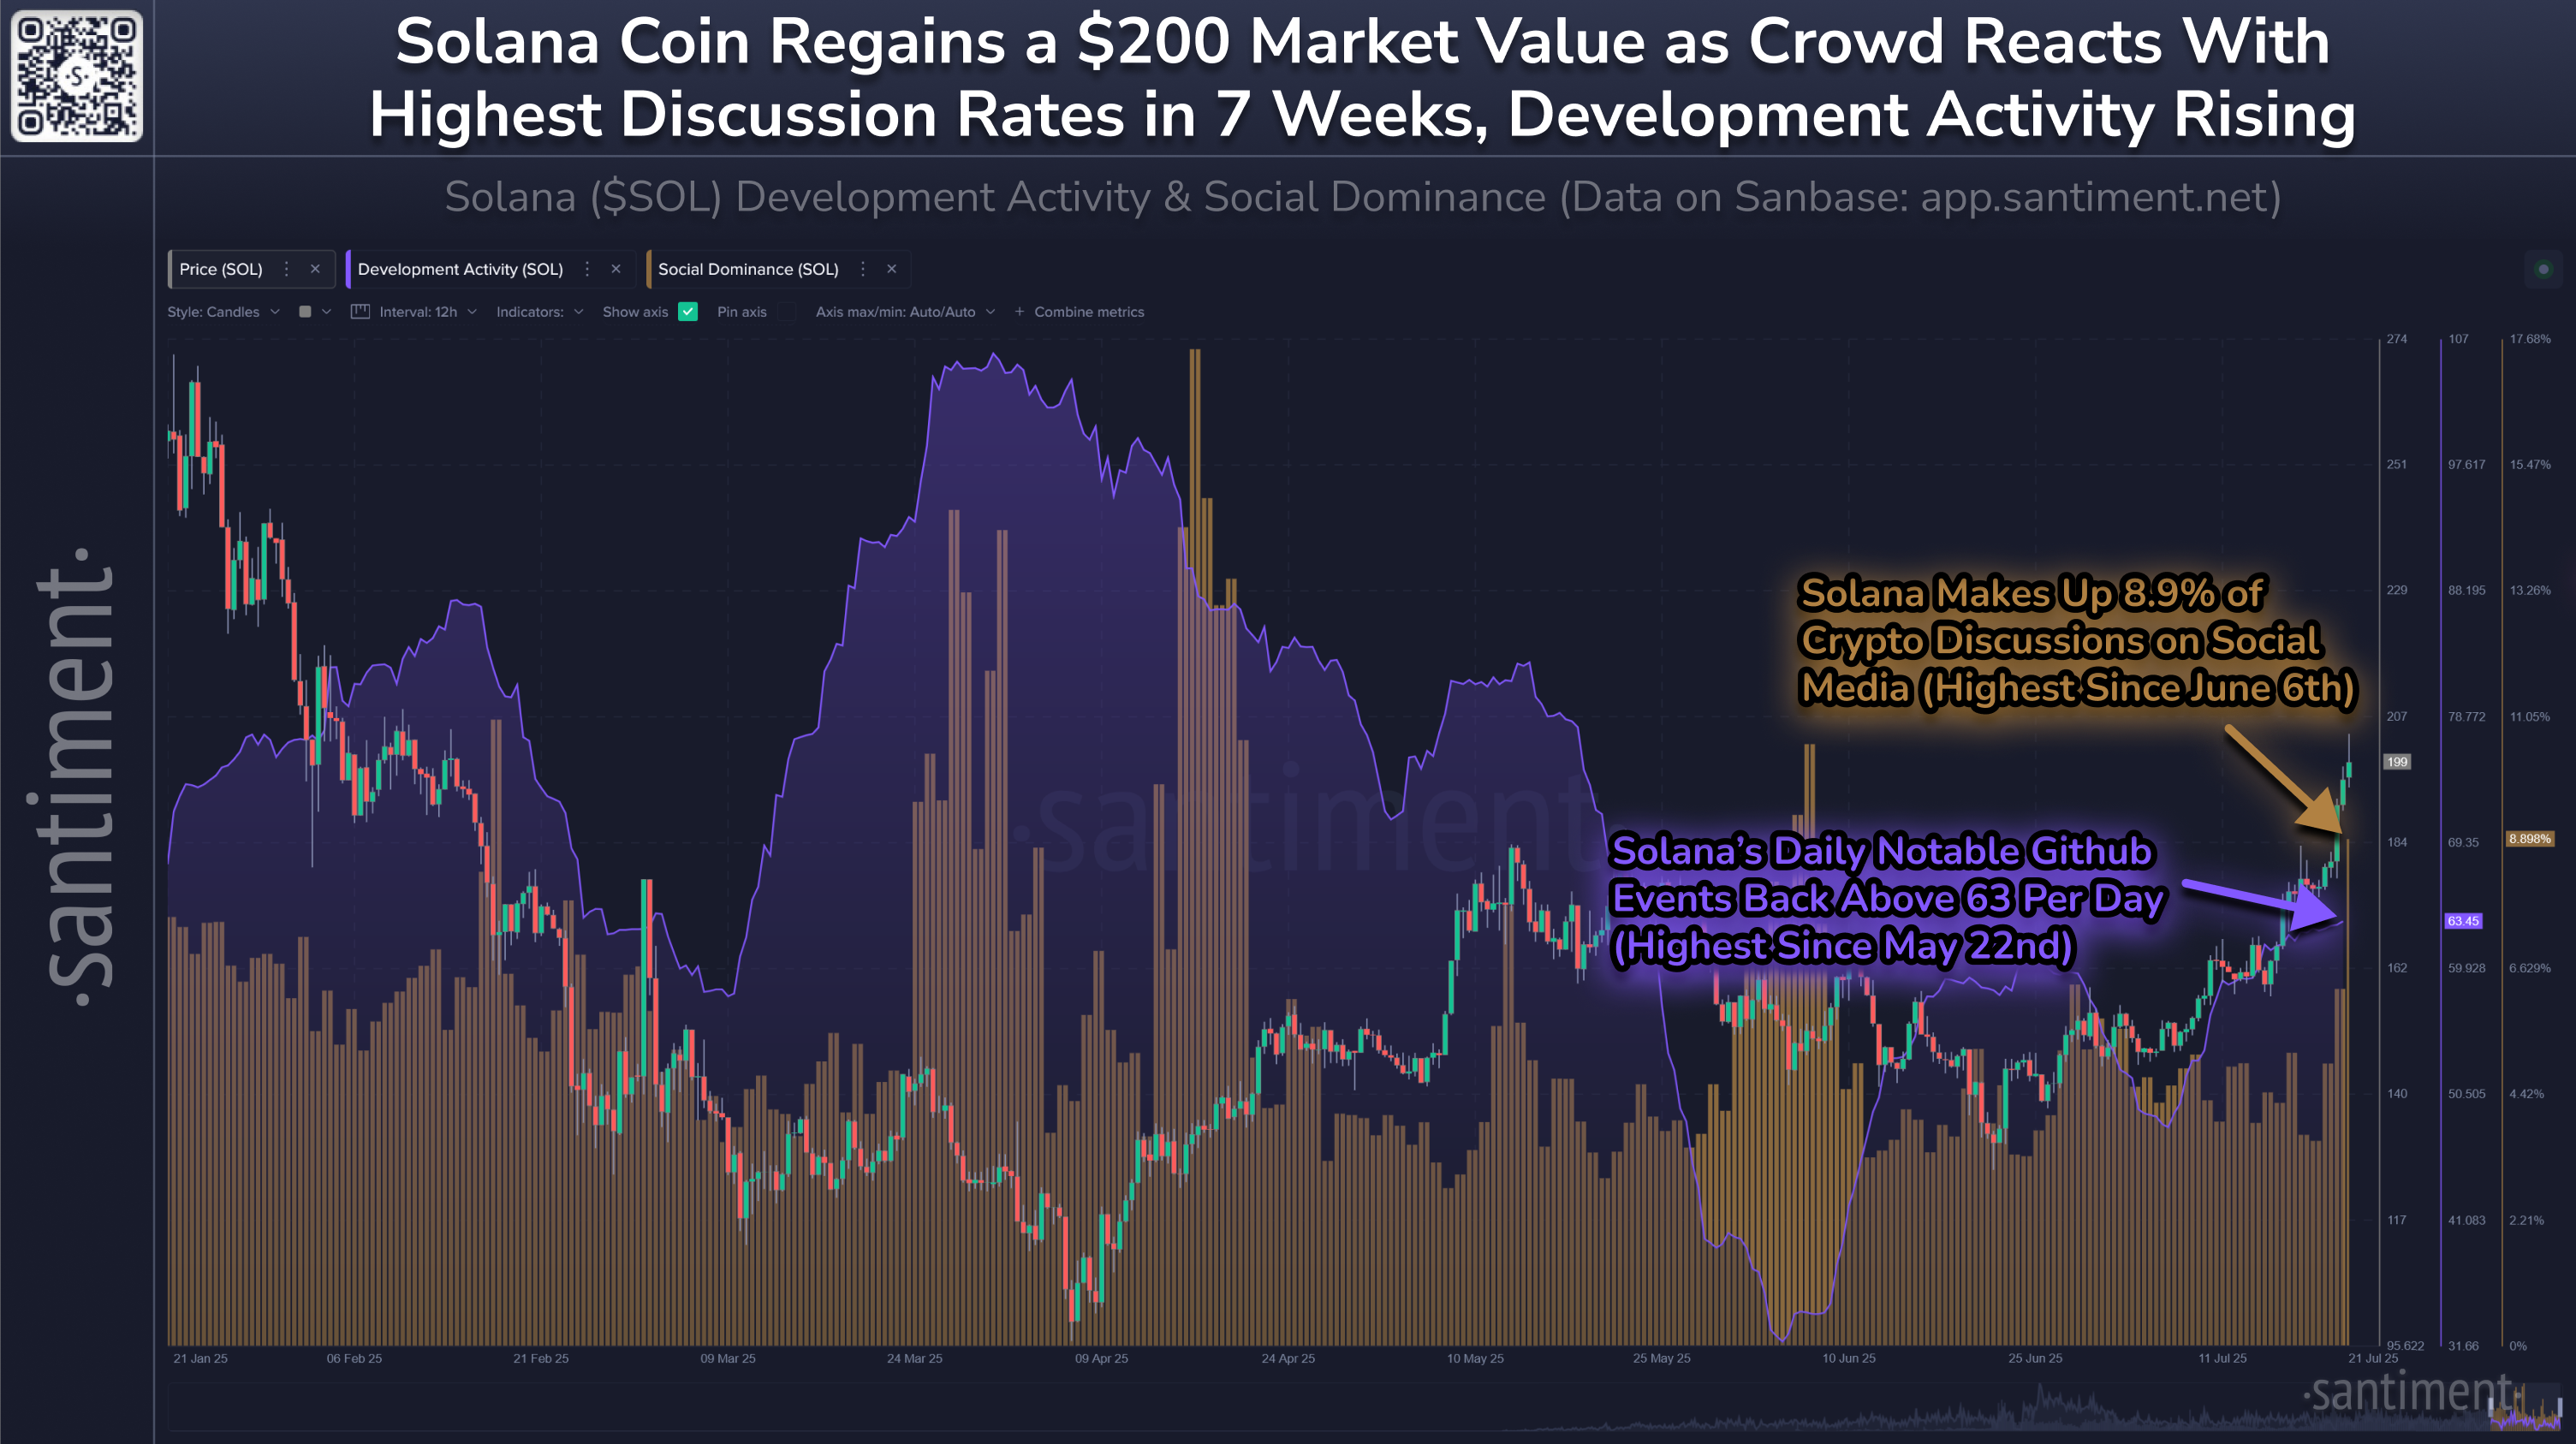
🧑💻 Solana has hit the $200 milestone for the first time since June 6th, resulting in an eruption of crowd interest. Though this will lea...
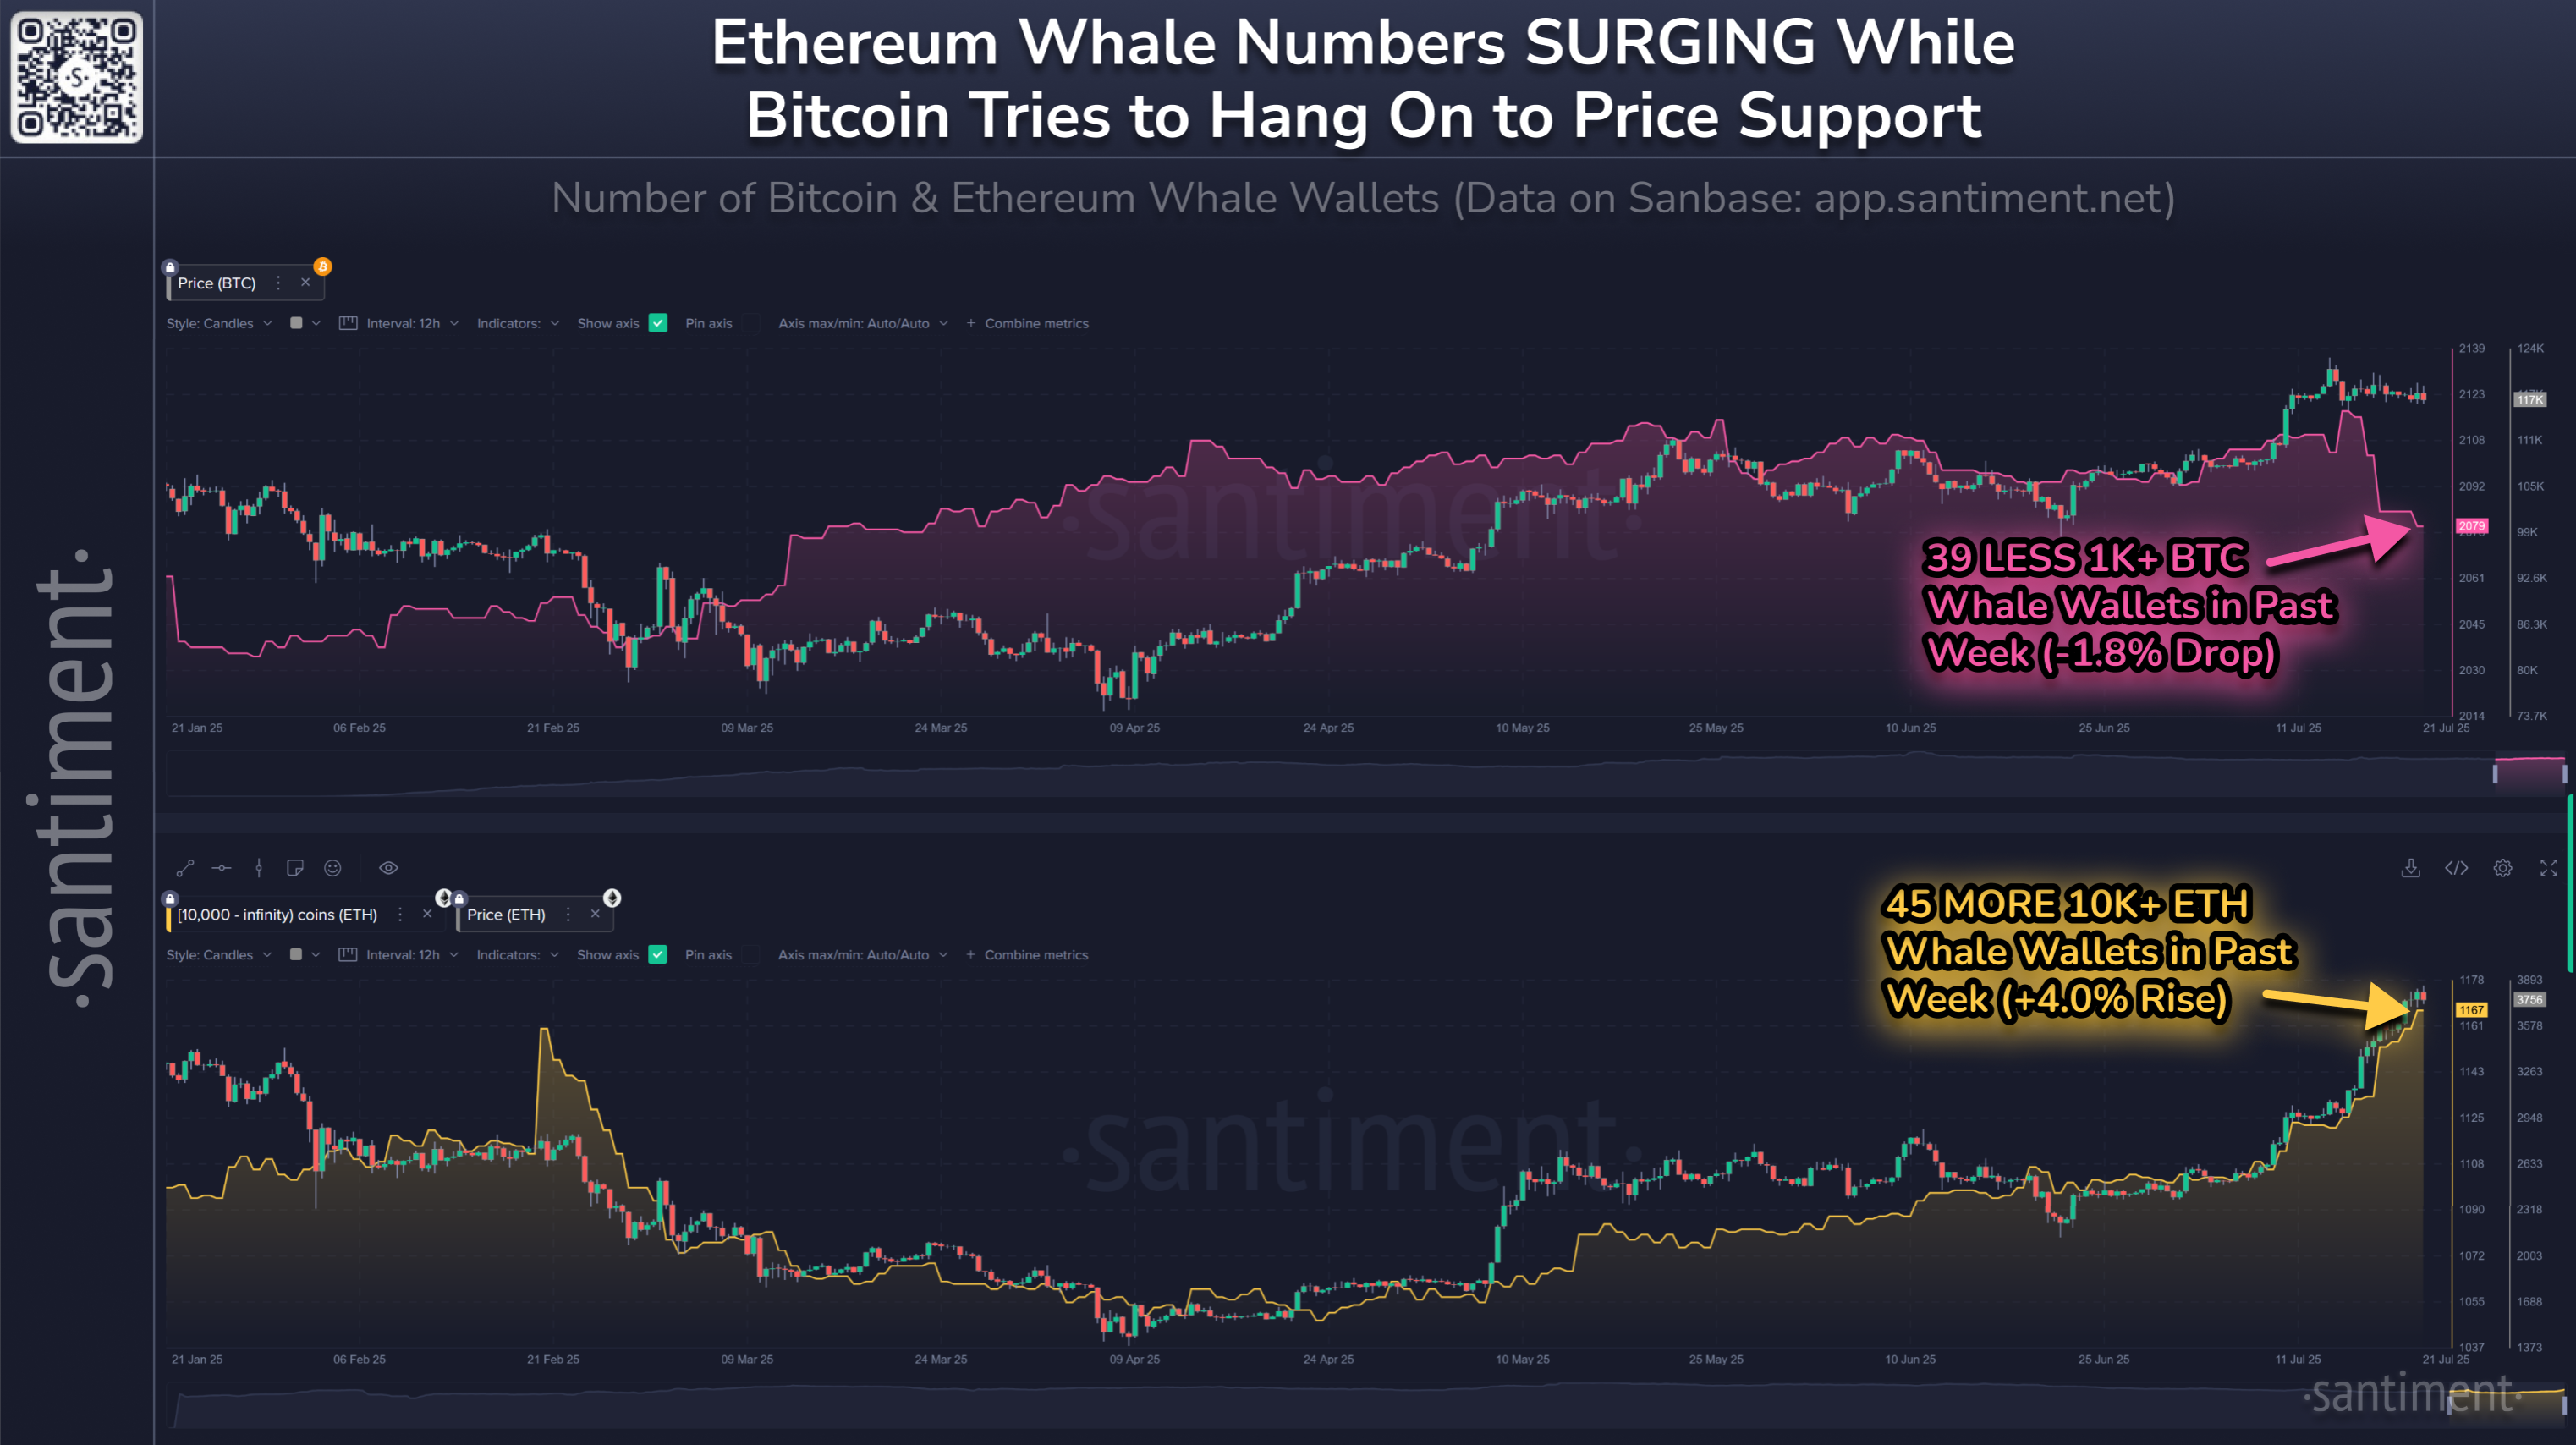
🐳 In the past week, crypto's top market caps are seeing whale numbers move in opposite directions: 📉 Bitcoin's 1K+ $BTC wallets DROP by 3...
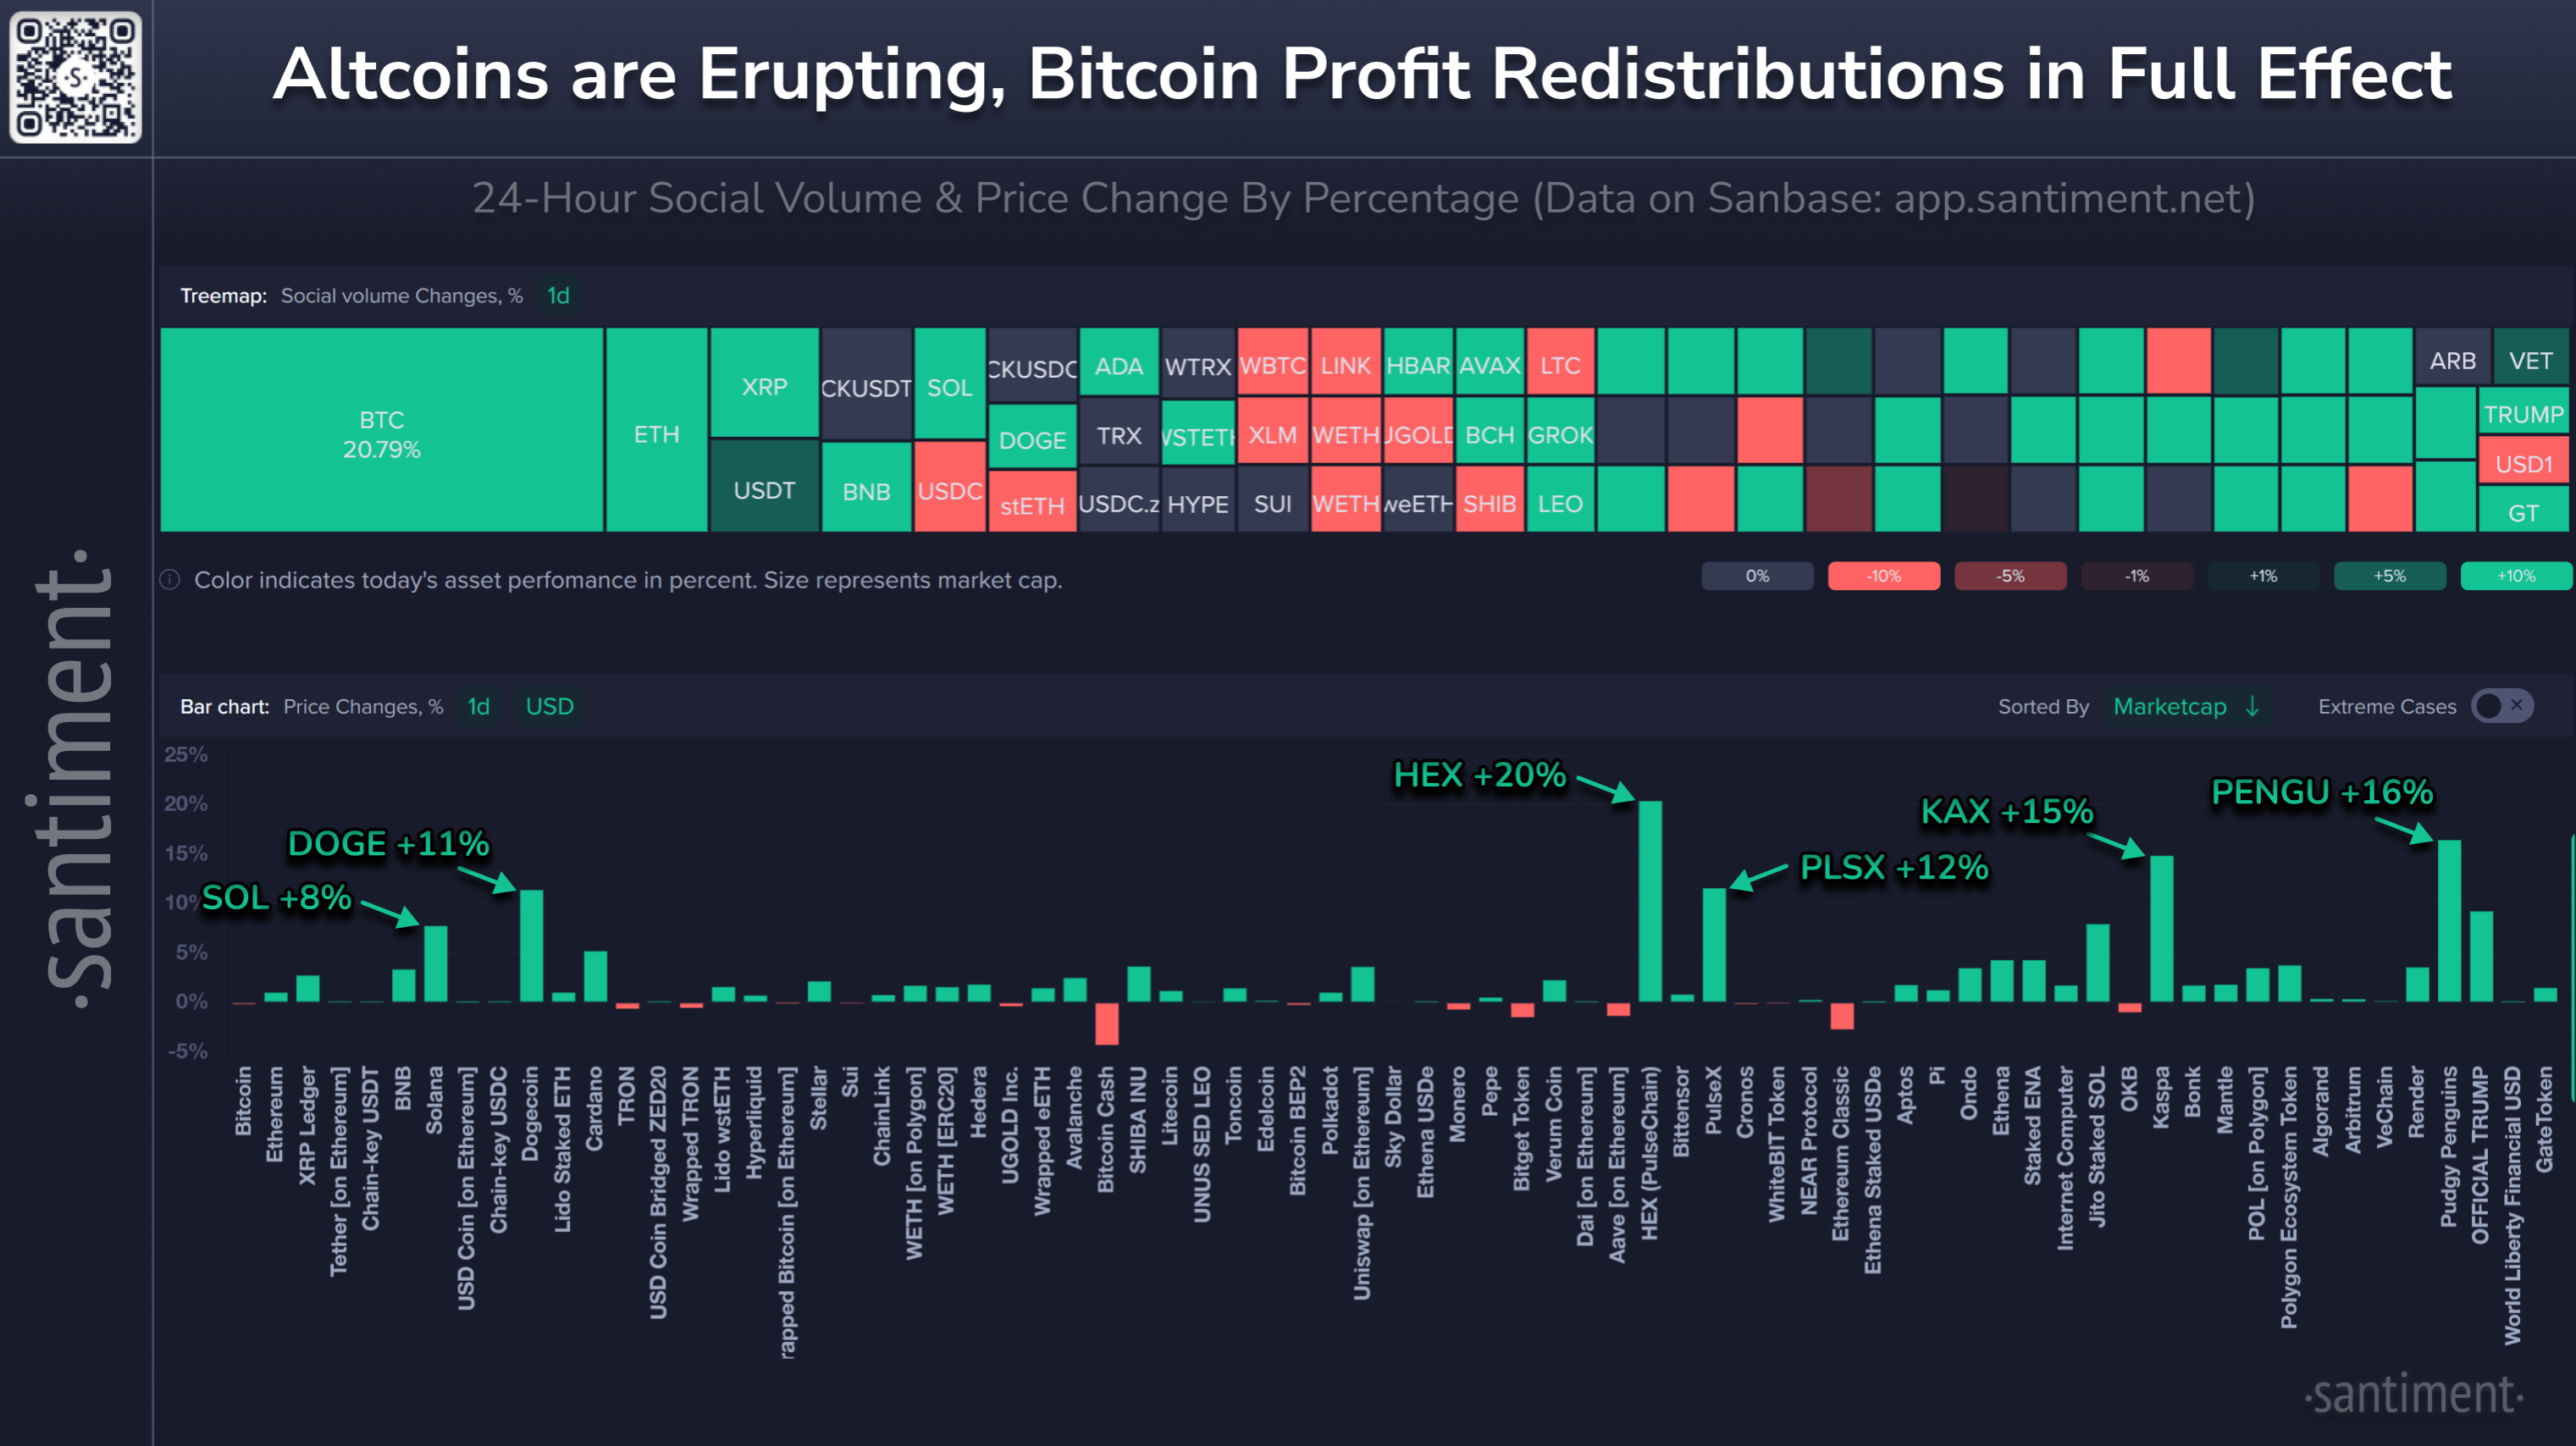
🥳 Altcoins are surging after Bitcoin's ATH led to profit redistributions. In the past 24 hours, gains include: 📈 $SOL +8% 📈 $DOGE +11% �...


Watch Video on Youtube IntroductionThe crypto market has come alive with a strong Ethereum rally, pulling many altcoins along for an excitin...

We enjoy a great discussion on Bitcoin's all-time high, Ethereum's and XRP's ascension, and the fluctuating crowd opinions toward Solana and...
By clicking “Allow all”, you agree to use of all cookies. Visit our Cookies Policy to learn more.