

📈 XRP has risen to as high as $3.26 today, looking to bounce back to its 3-year high of $3.64 made last week. Crypto's #3 market cap asset...
XRP
📈 XRP has risen to as high as $3.26 today, looking to bounce back to its 3-year high of $3.64 made last week. Crypto's #3 market cap asset...
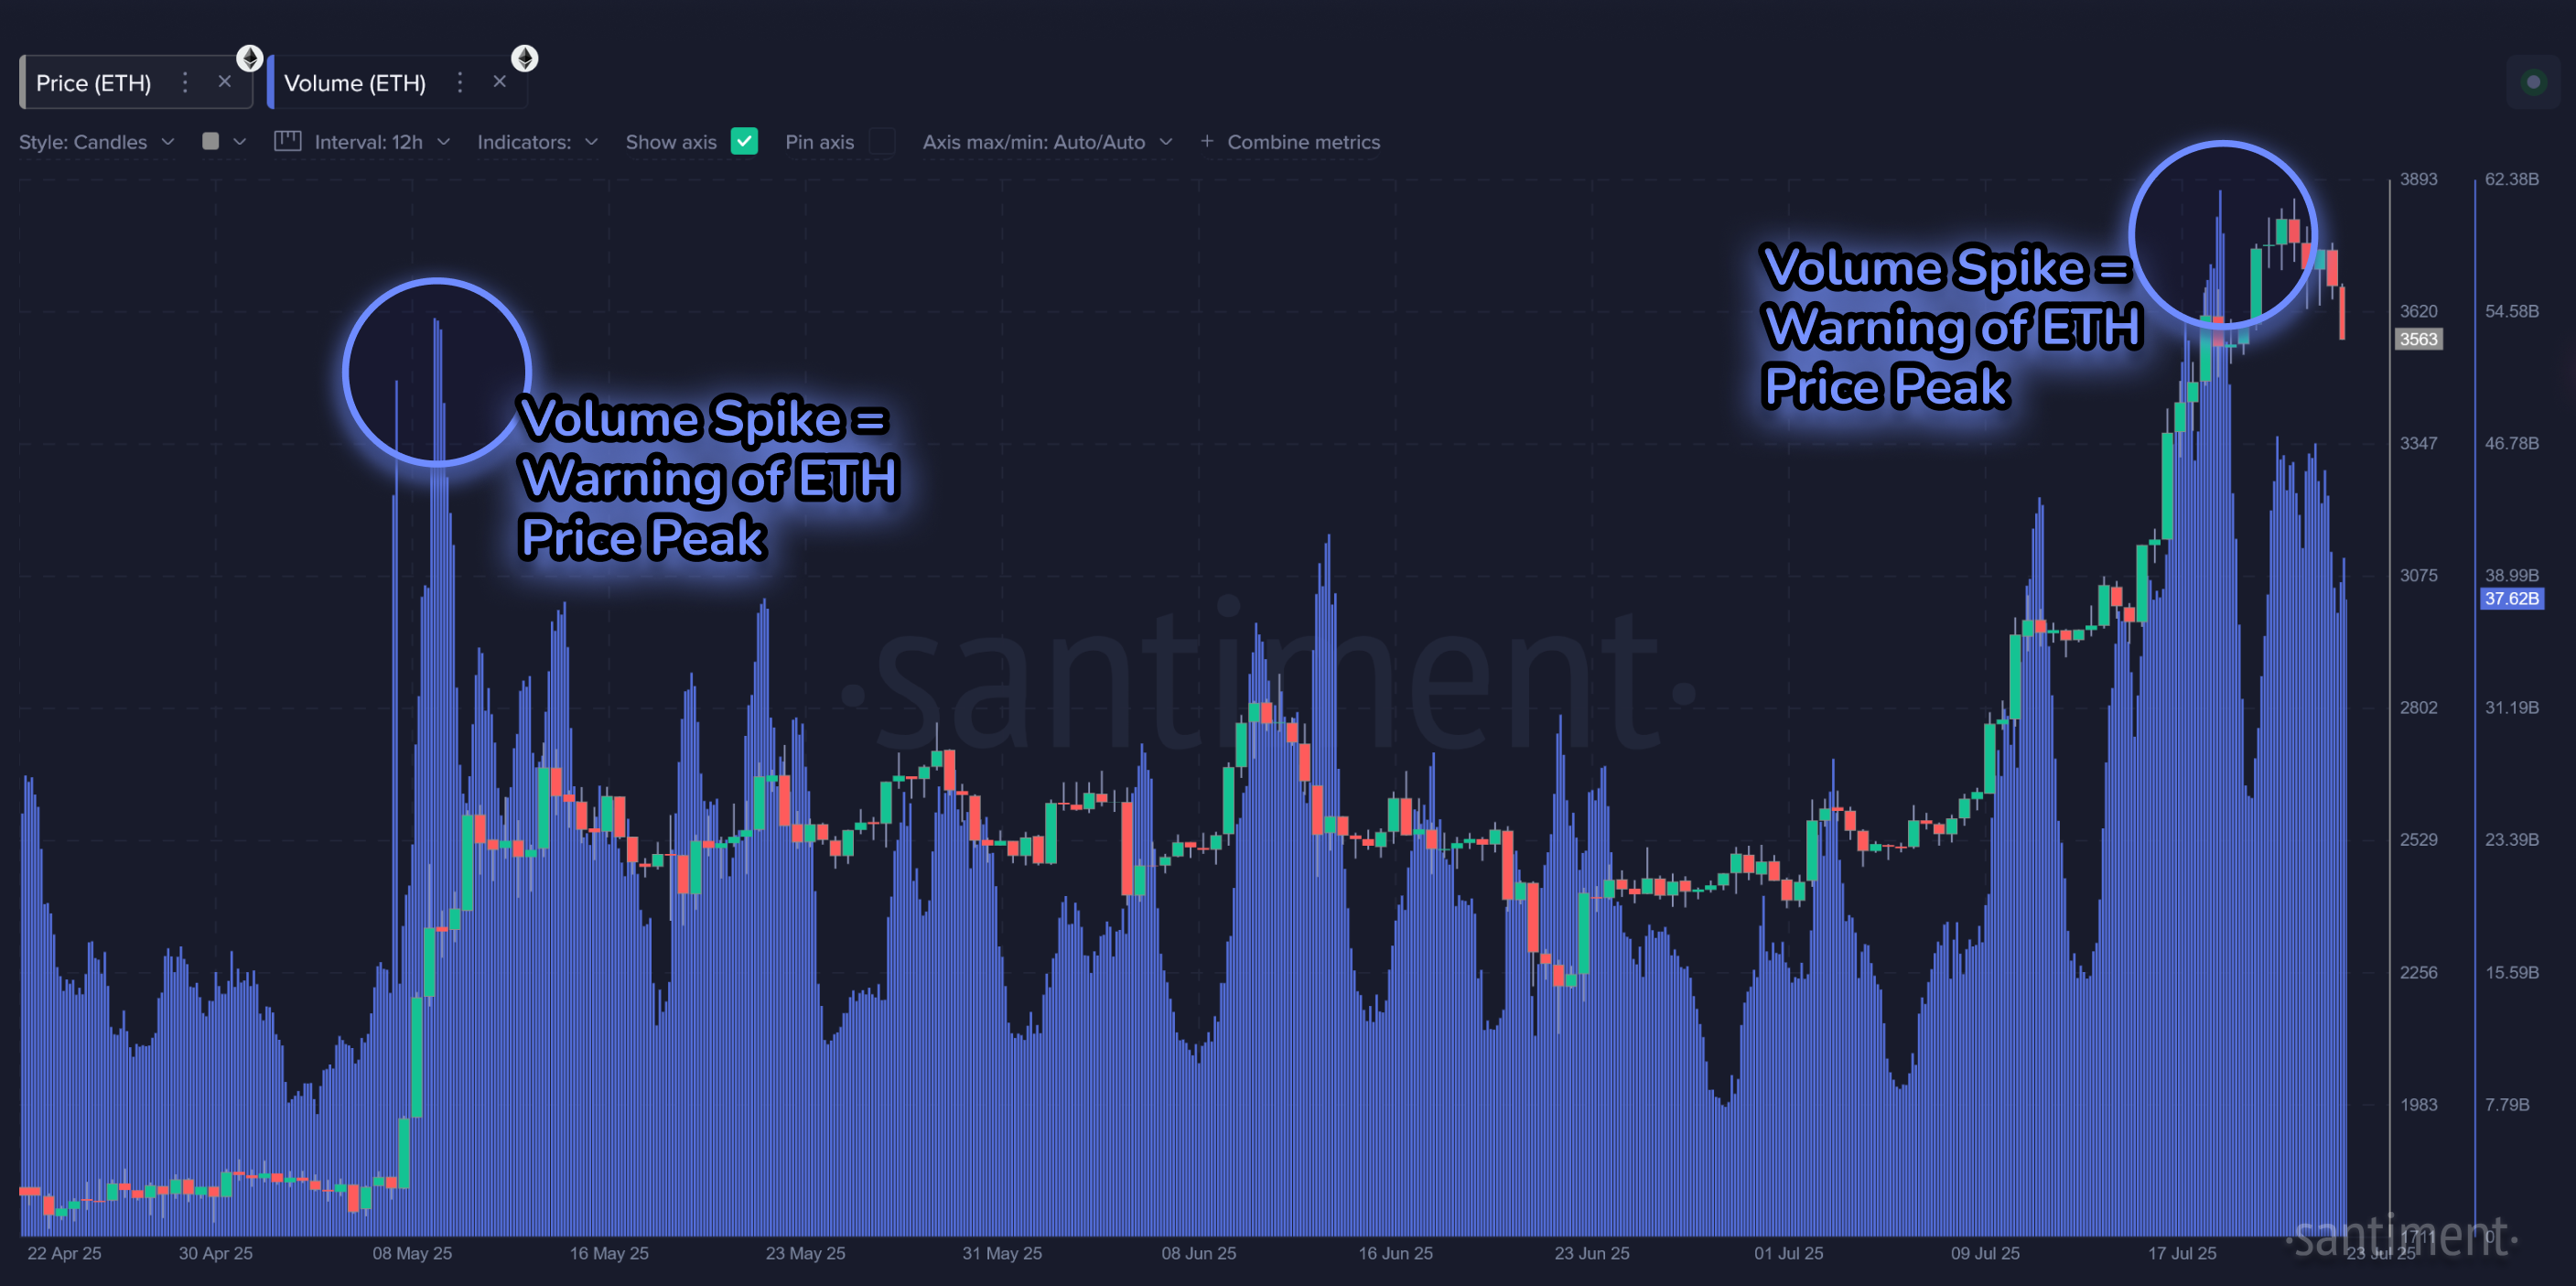
📊 Ethereum's price ratio vs. Bitcoin has fallen -5.8% in the past 60 hours. A major FOMO-driven $ETH trading volume spike, just like we sa...
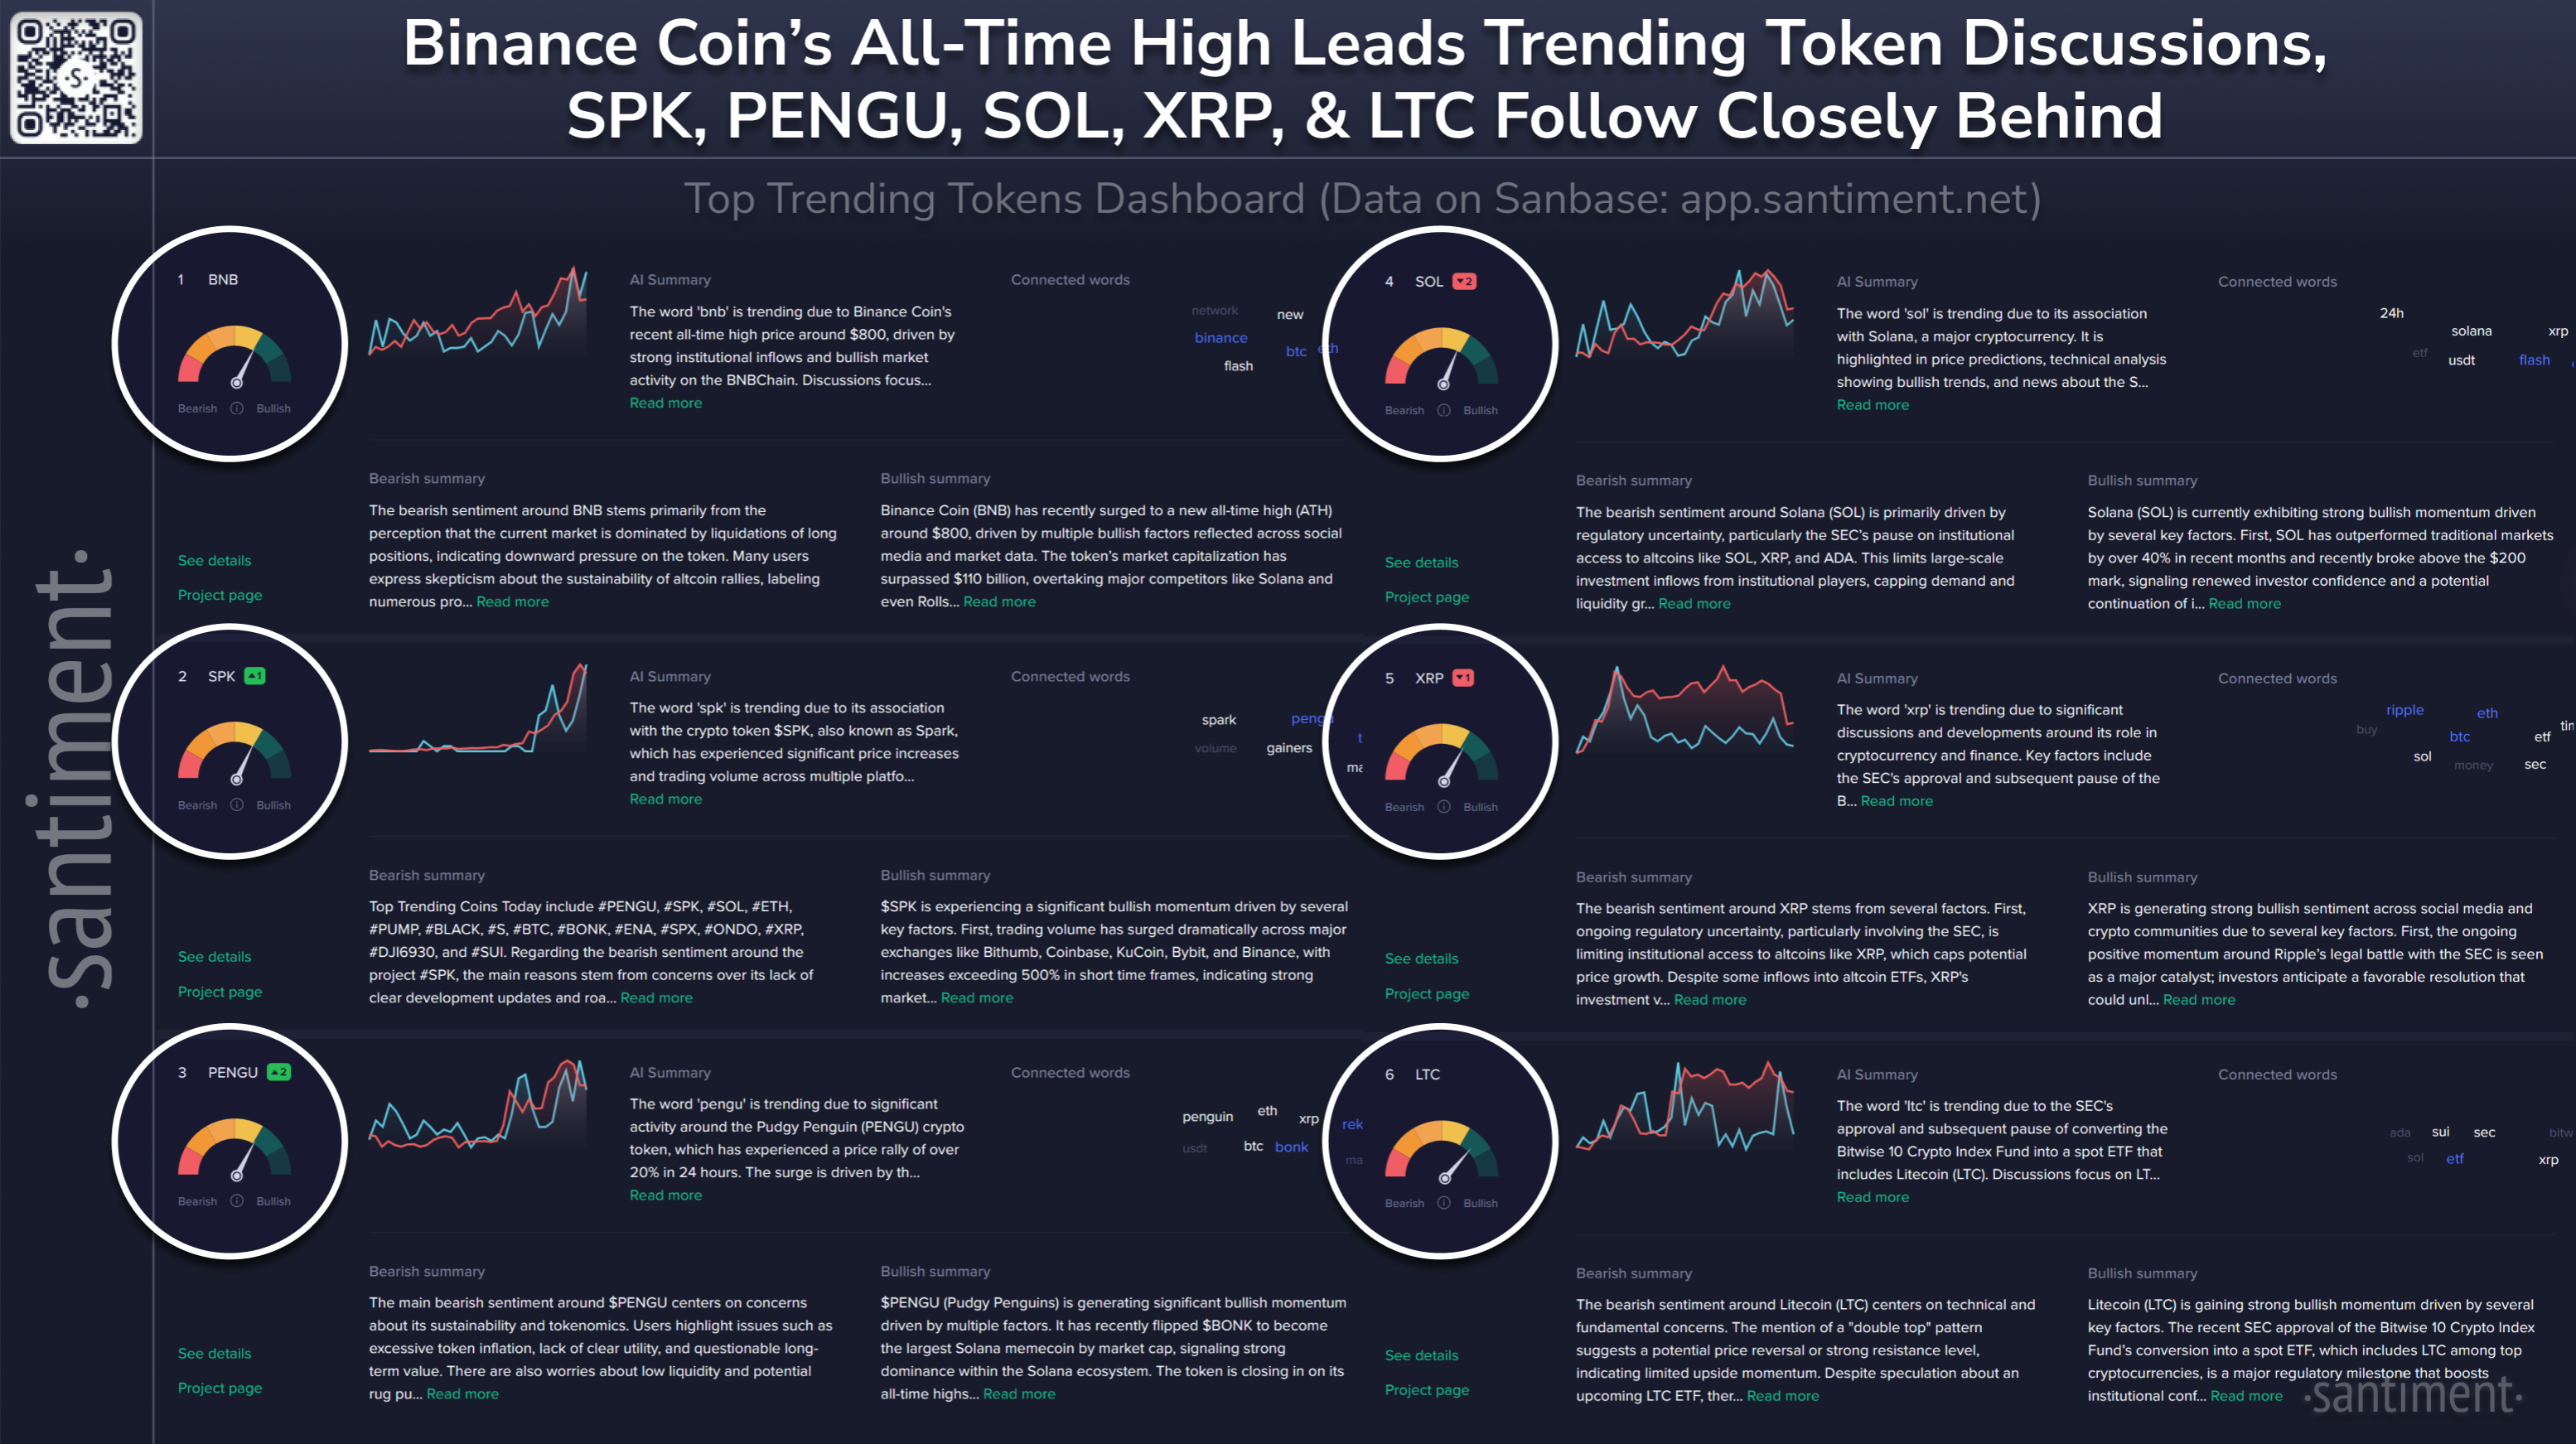
🗣️ The cryptocurrencies seeing the highest rise in traction across social media today are: 🪙 Binance Coin $BNB is trending due to Binanc...
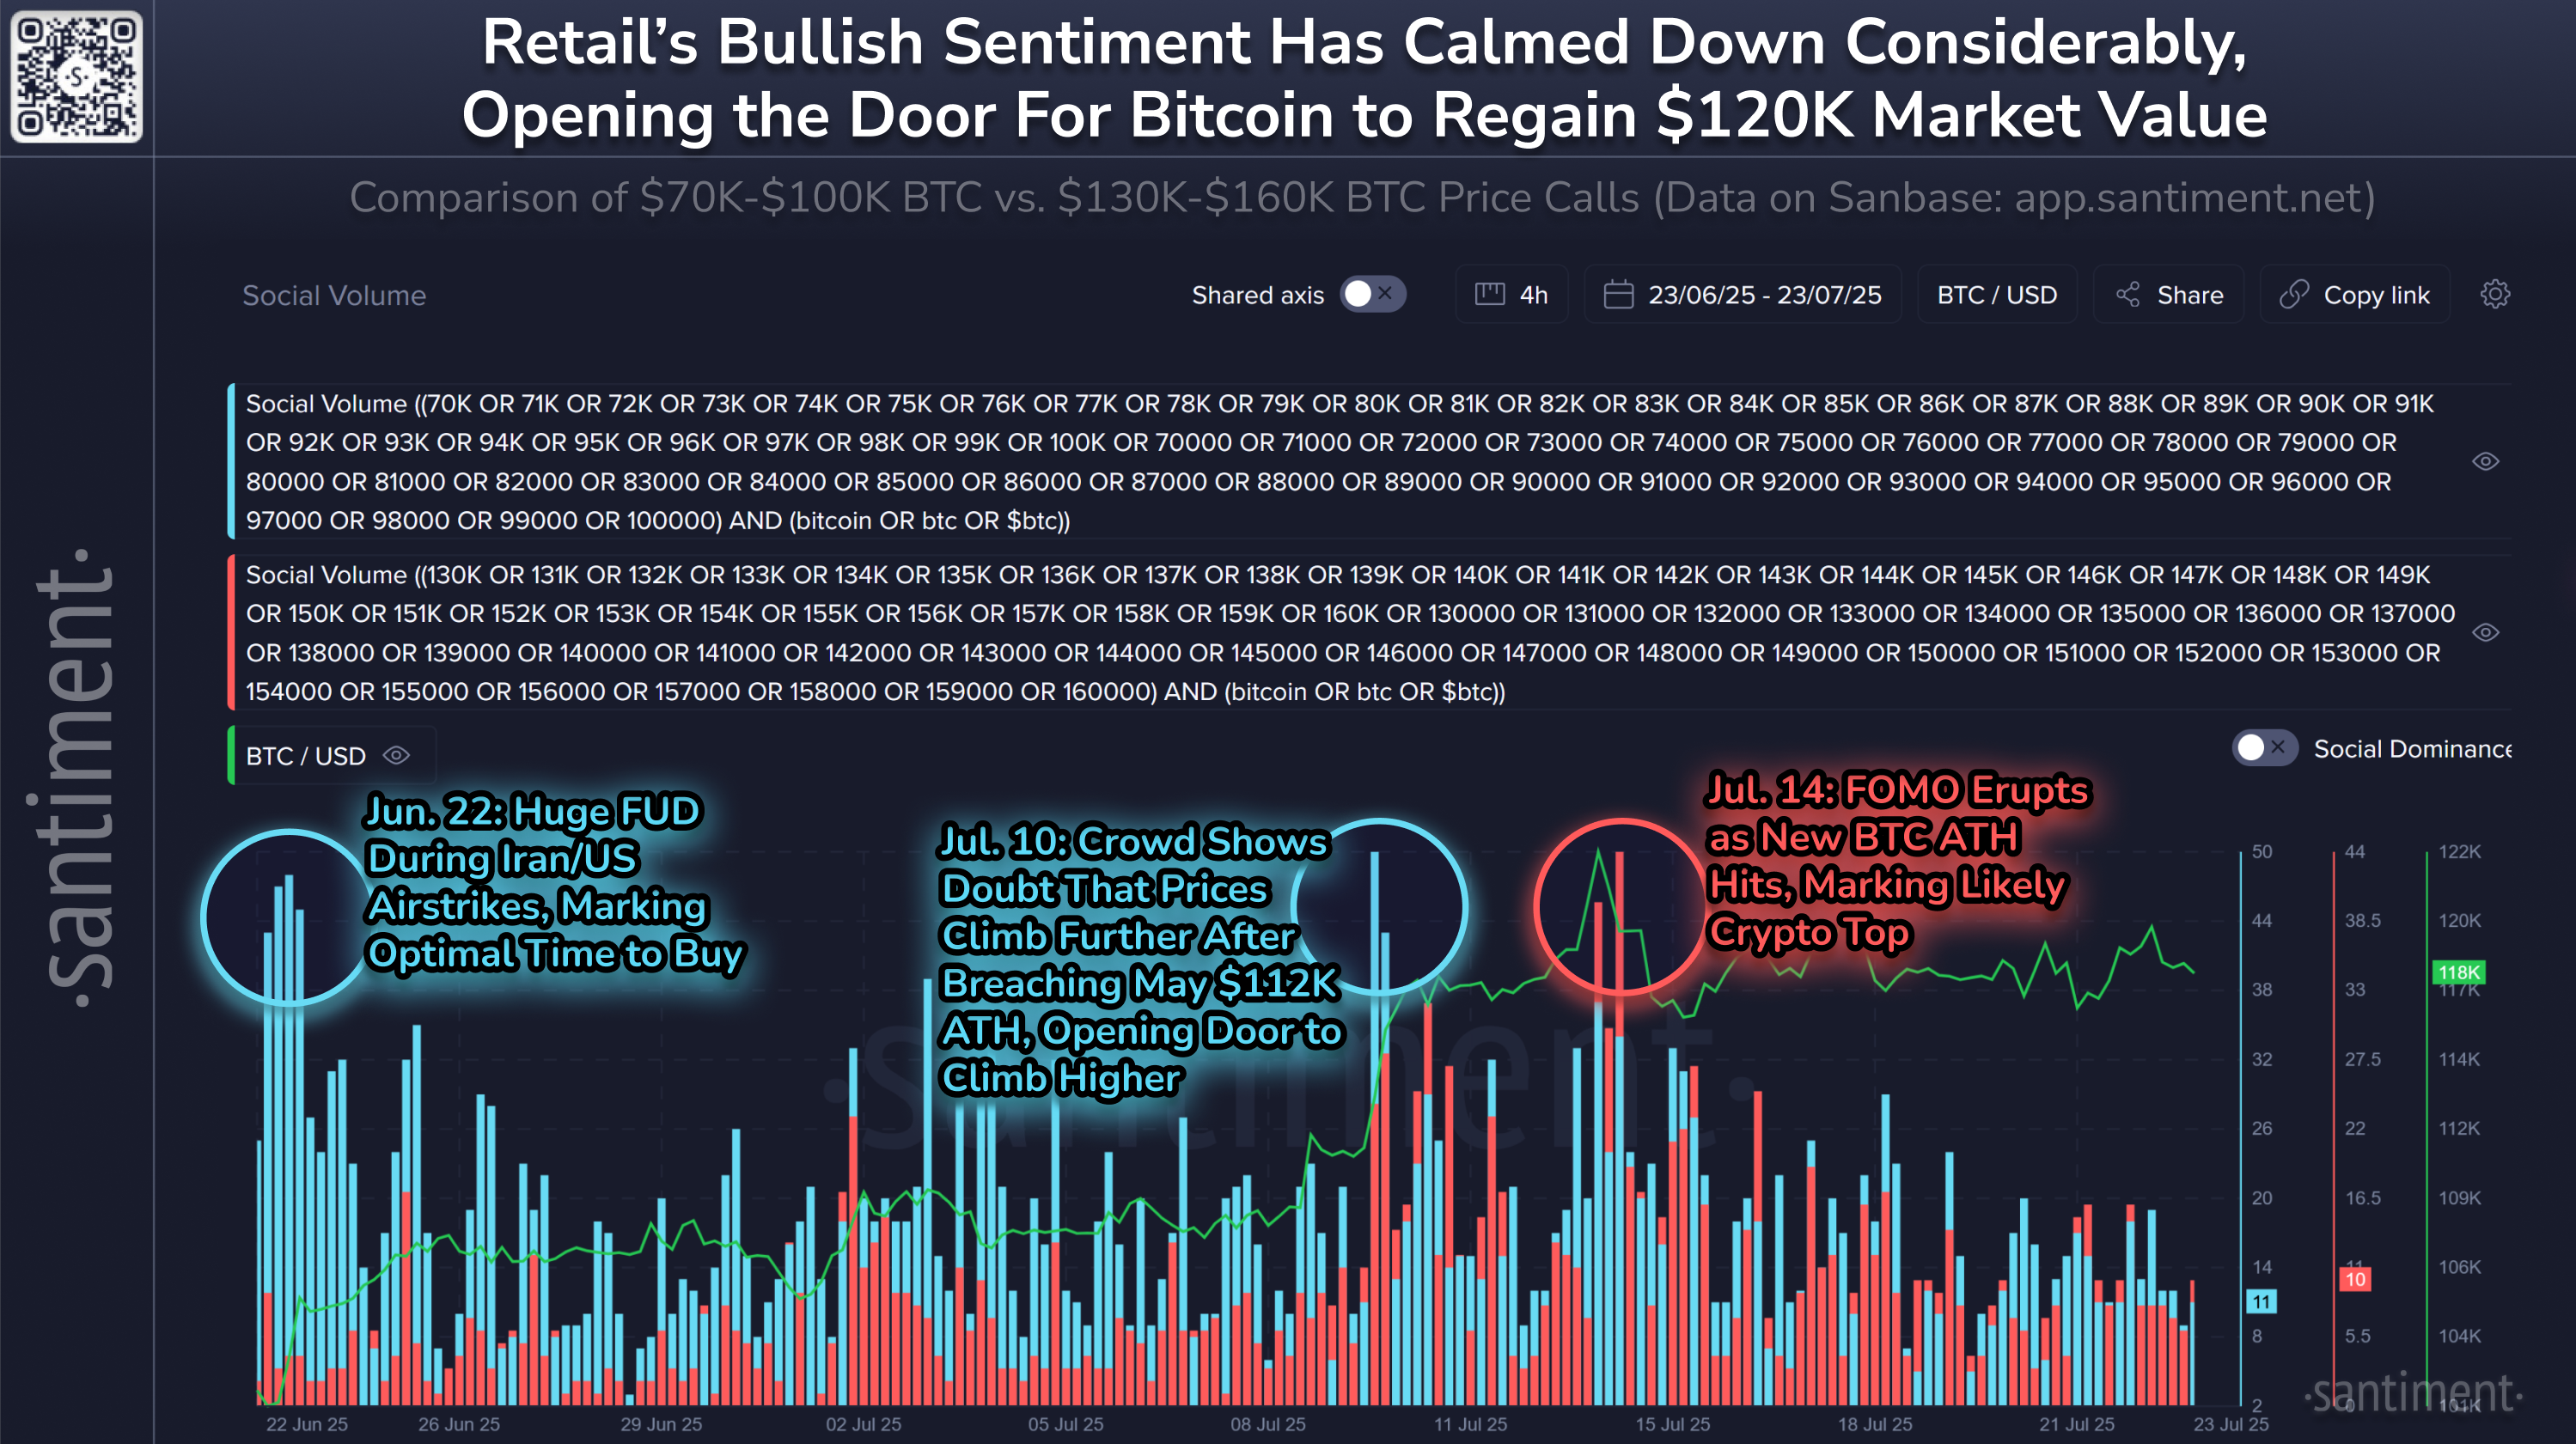
🤫 Bitcoin retail has been quiet, with few calls for higher price levels. The dust has settled from the July 14th $123,077 all-time high, ...

🧑💻 Here are crypto's top overall coins by notable development activity the past 30 days. Directional indicators represent each project'...
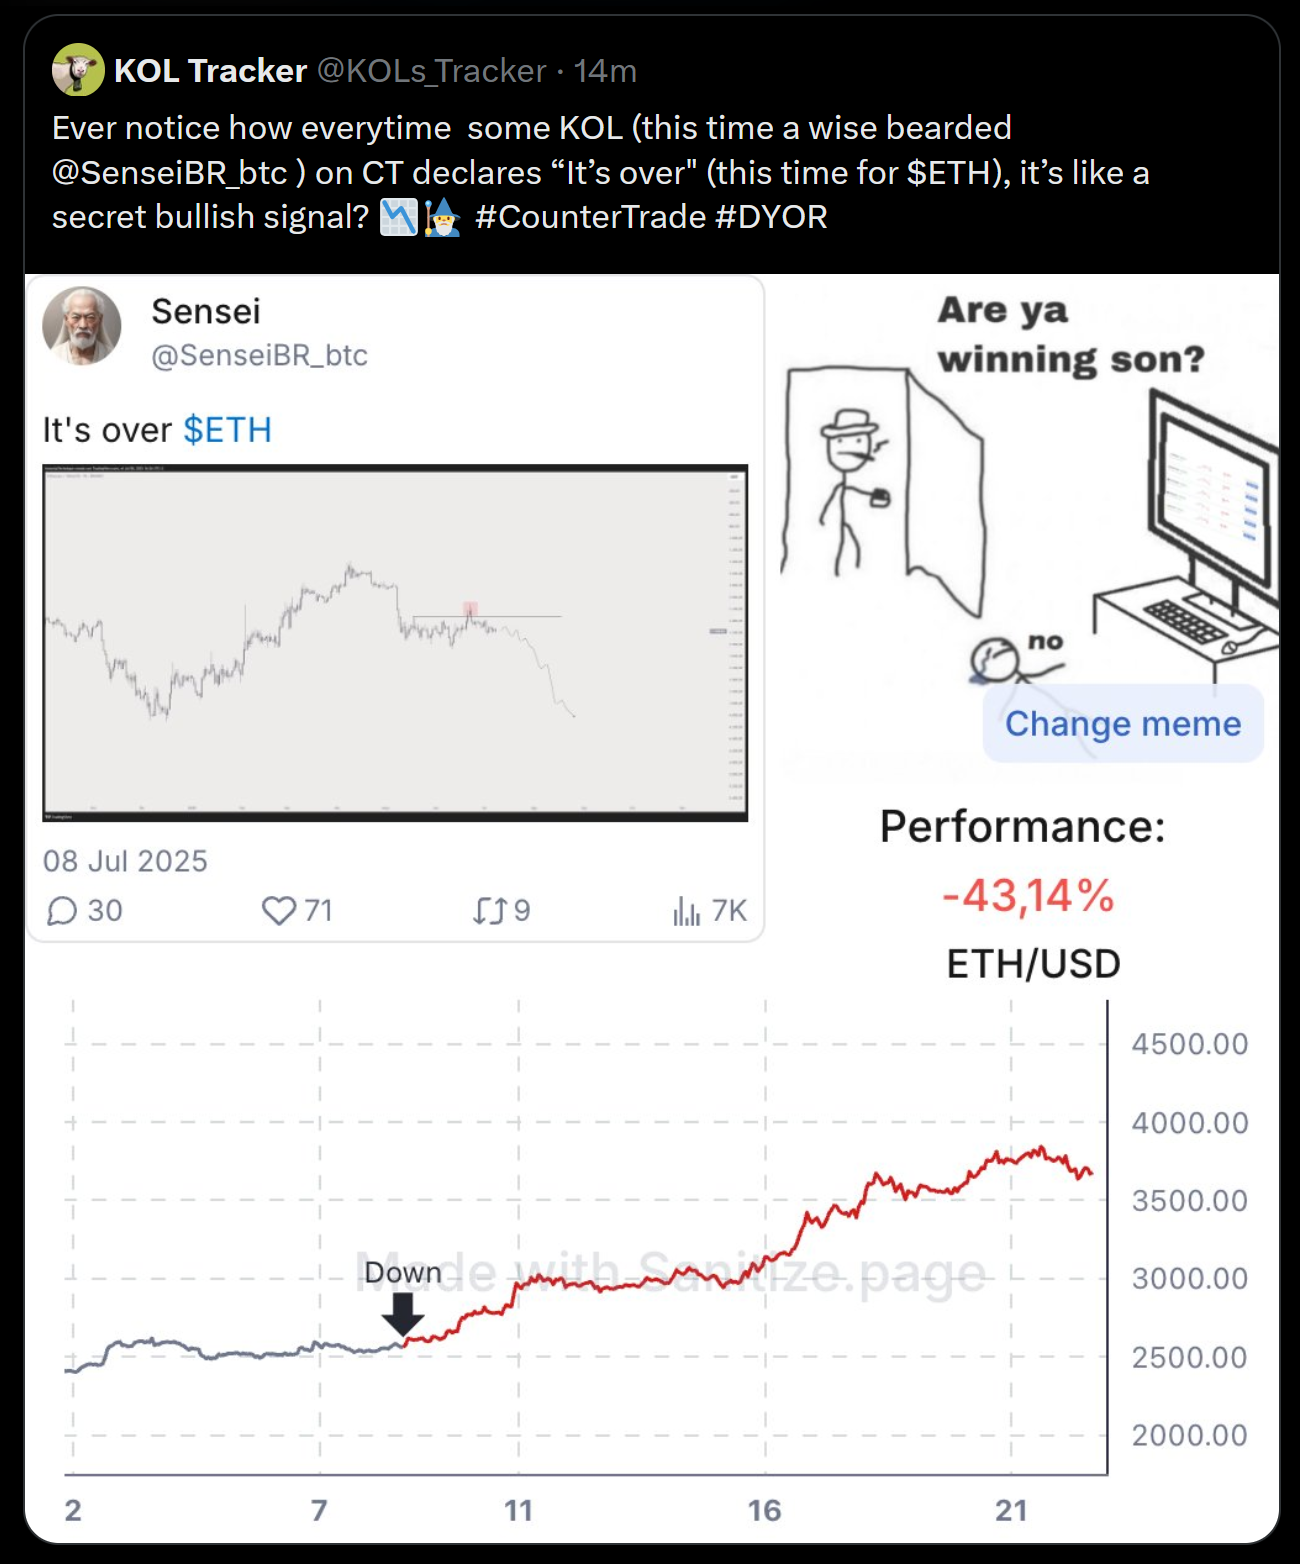
🧐 Ethereum's market value is +46% since this crypto KOL claimed "it's over". As is usually the case, markets move the opposite direction of...
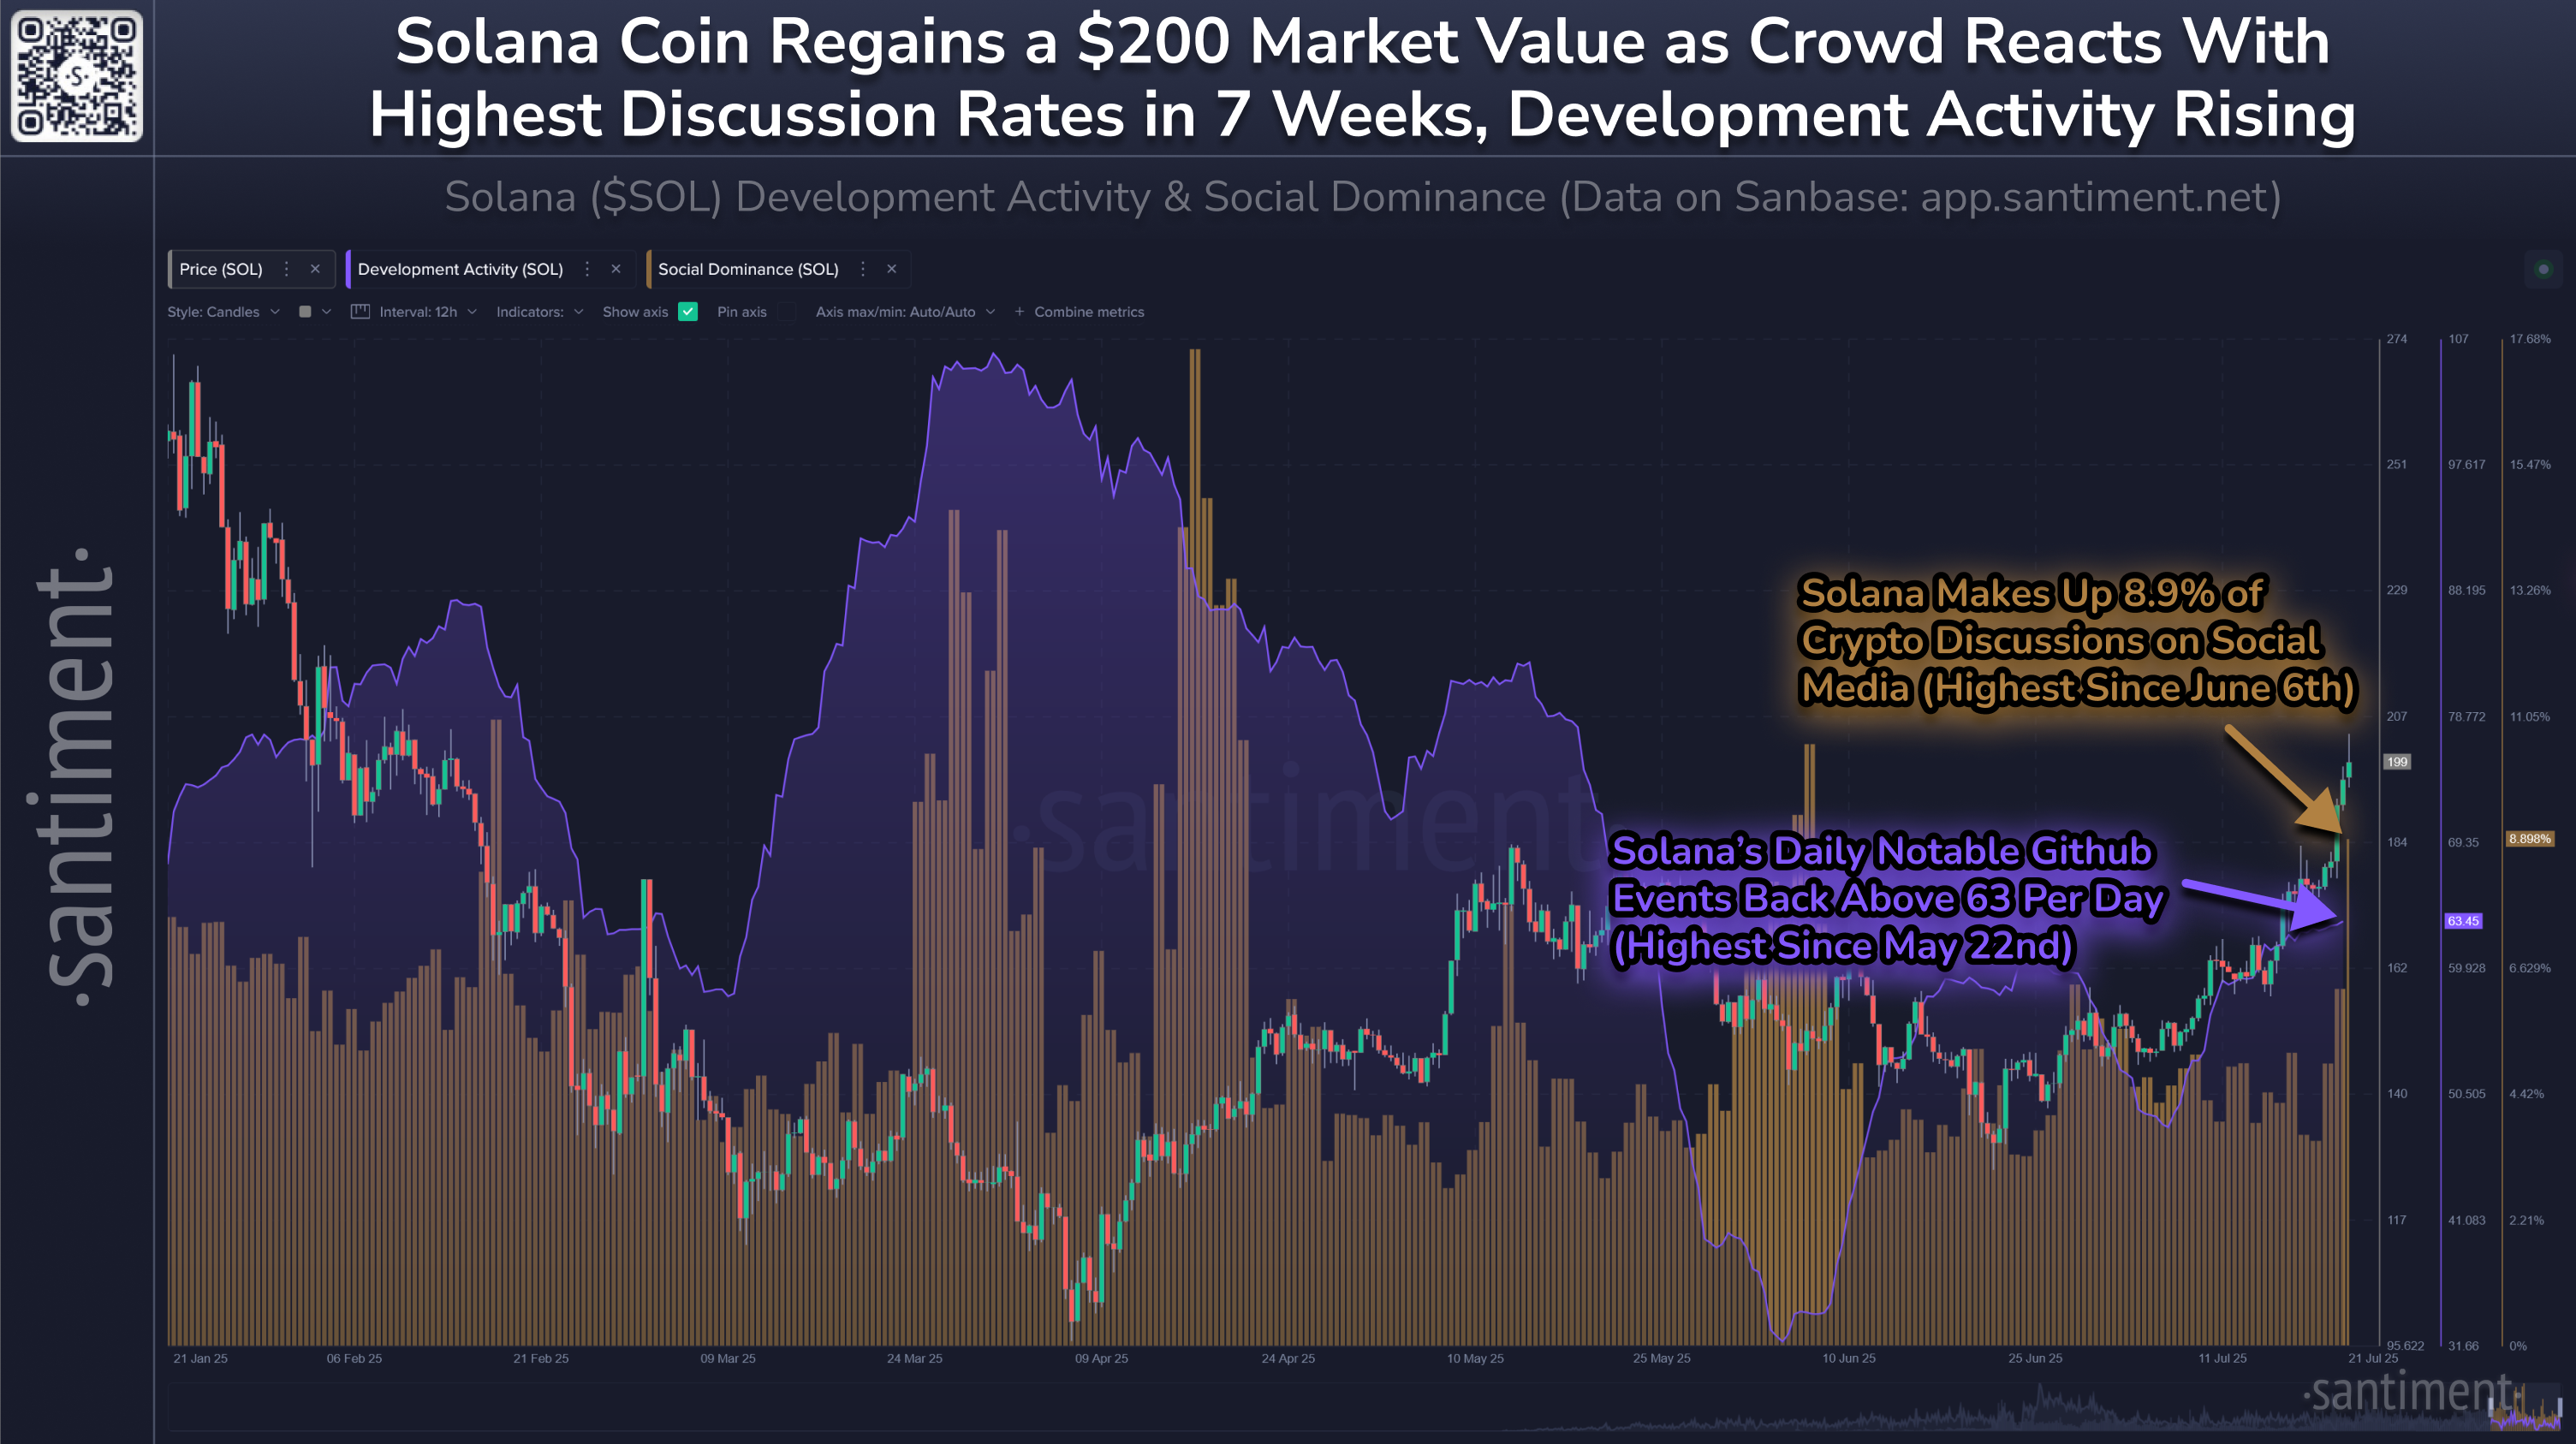
🧑💻 Solana has hit the $200 milestone for the first time since June 6th, resulting in an eruption of crowd interest. Though this will lea...
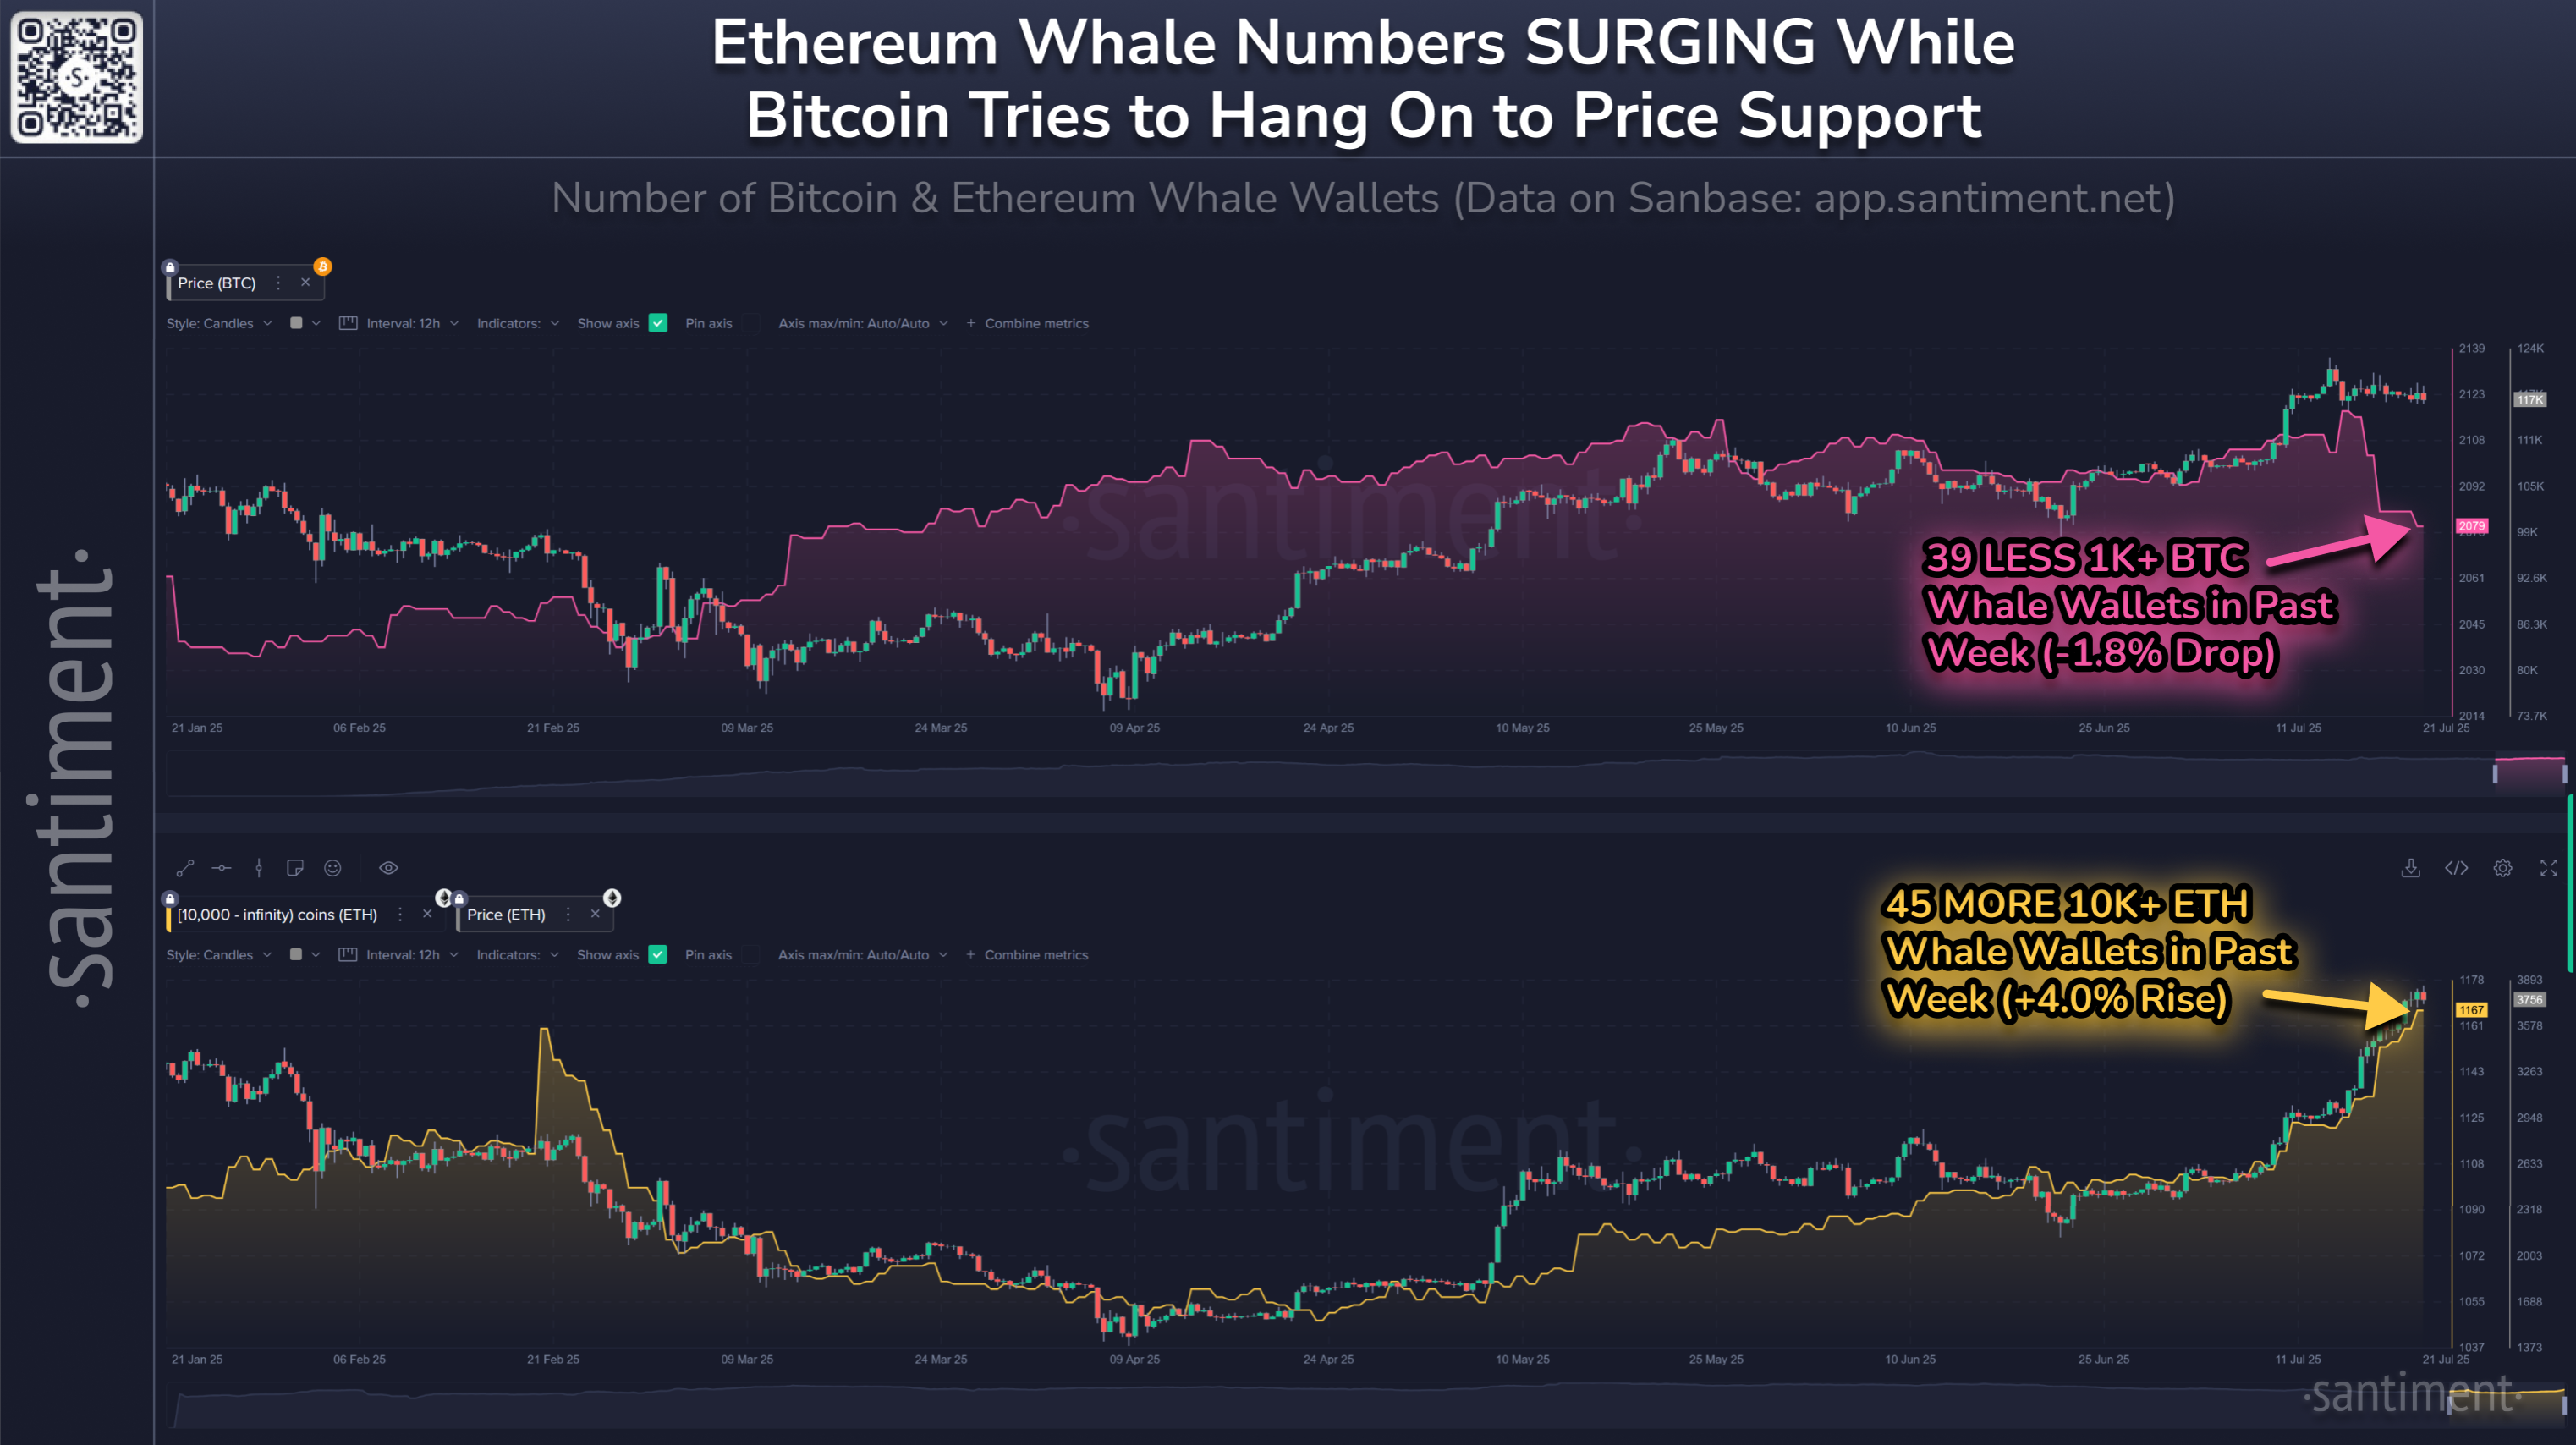
🐳 In the past week, crypto's top market caps are seeing whale numbers move in opposite directions: 📉 Bitcoin's 1K+ $BTC wallets DROP by 3...
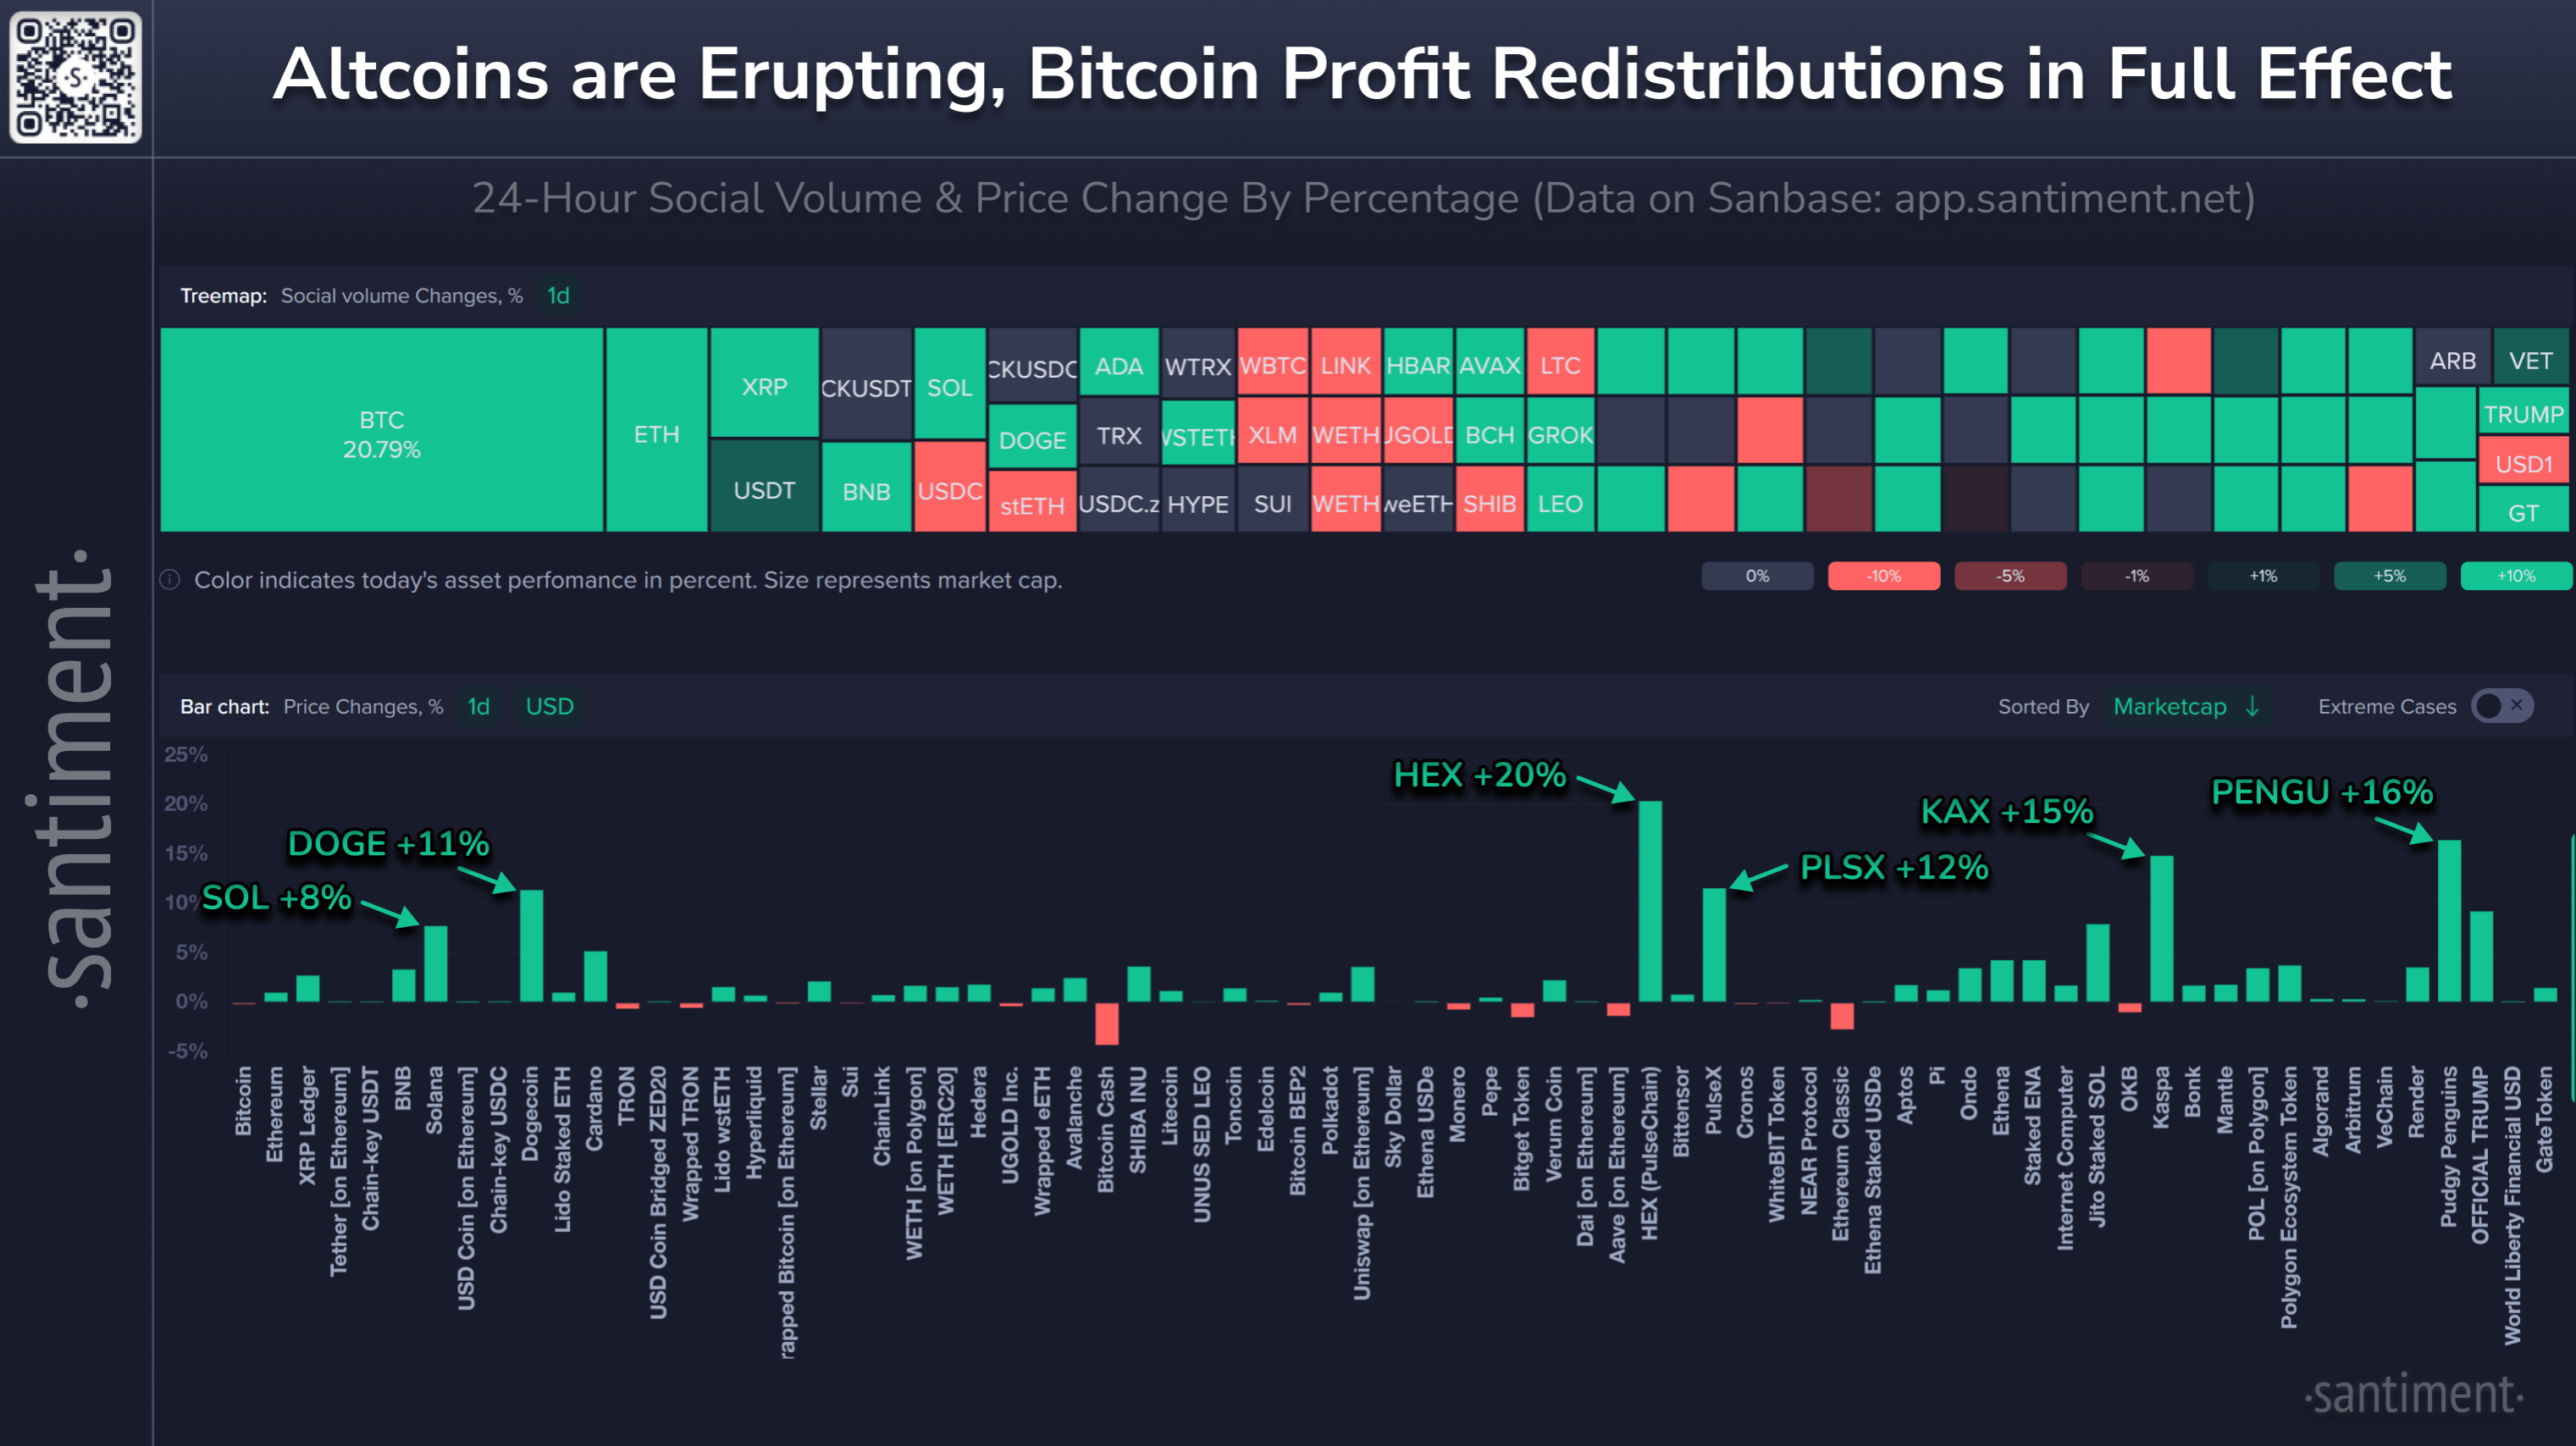
🥳 Altcoins are surging after Bitcoin's ATH led to profit redistributions. In the past 24 hours, gains include: 📈 $SOL +8% 📈 $DOGE +11% �...


Watch Video on Youtube IntroductionThe crypto market has come alive with a strong Ethereum rally, pulling many altcoins along for an excitin...
By clicking “Allow all”, you agree to use of all cookies. Visit our Cookies Policy to learn more.