Santiment's Stablecoin Brand Index: Q2 report

The Stablecoin Brand Index is a quarterly report by Santiment, which ranks all ERC-20 stablecoins with an average market capitalization of $100,000+ and the average daily trading volume of $10,000+ over the previous 4 months.
The Stablecoin Brand Index provides a weighted ranking of all ERC-20 stablecoins based on 6 different on-chain, social and financial indicators, which we at Santiment believe are key to comparing the real growth of top-cap stablecoins, and their adoption over time. These include:
1. Market Cap
While not the end-all metric some like to make it, market capitalization is an important gauge of stablecoin demand and speculative interest over time. Unlike more volatile cryptocurrencies, the stablecoins' market cap primarily depends on their ever-changing token supply.
2. Daily Active Addresses
Daily active addresses (DAA for short) is an on-chain metric that tracks the amount of unique addresses interacting with (i.e. sending or receiving) a stablecoin each day. While the market cap gives a sense of wholesale demand for stablecoins, DAA allows for a more accurate reading of their adoption over time, as well as the stablecoin’s ‘network effect’.
3. Social Volume
Social volume is a custom metric developed by Santiment, and tracks the amount of coin-specific mentions on over 1000 crypto social channels (including Telegram groups, crypto subreddits, Twitter accounts and more). Social volume is especially useful in comparing the reputation and ‘mindshare’ of different stablecoins within the crypto community.
4. Development Activity
Development activity is often an underrated indicator of project success. A developer's time is a relatively expensive resource (especially in crypto), so high development activity demonstrates the project’s month-to-month commitment to creating a working product, continuously polishing and upgrading its features, and staying true to the long-term roadmap.
5. Price outliers
Given the main purpose of stablecoins, a (relatively) high price volatility can have a major impact on their market share and perceived utility.
6. Coin Velocity
Finally, coin velocity is an on-chain metric that tracks the average number of times that each token changes wallets on a daily basis. Similar to the velocity of money in traditional finance, coin velocity can be useful in measuring the usage rate of different stablecoins, and in particular their prevalence as a medium of exchange.
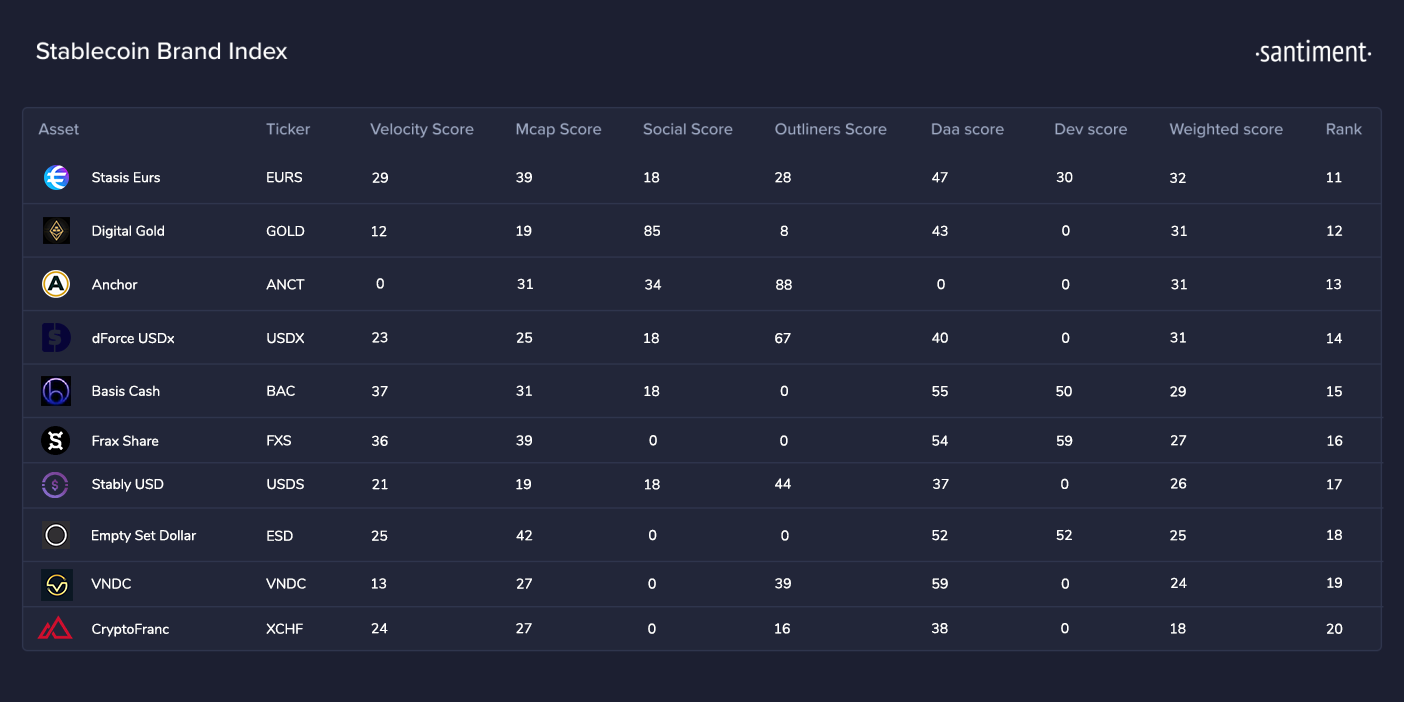
Below are the top 20 Ethereum-based stablecoins for Q2 of 2021 according to our Brand Index:
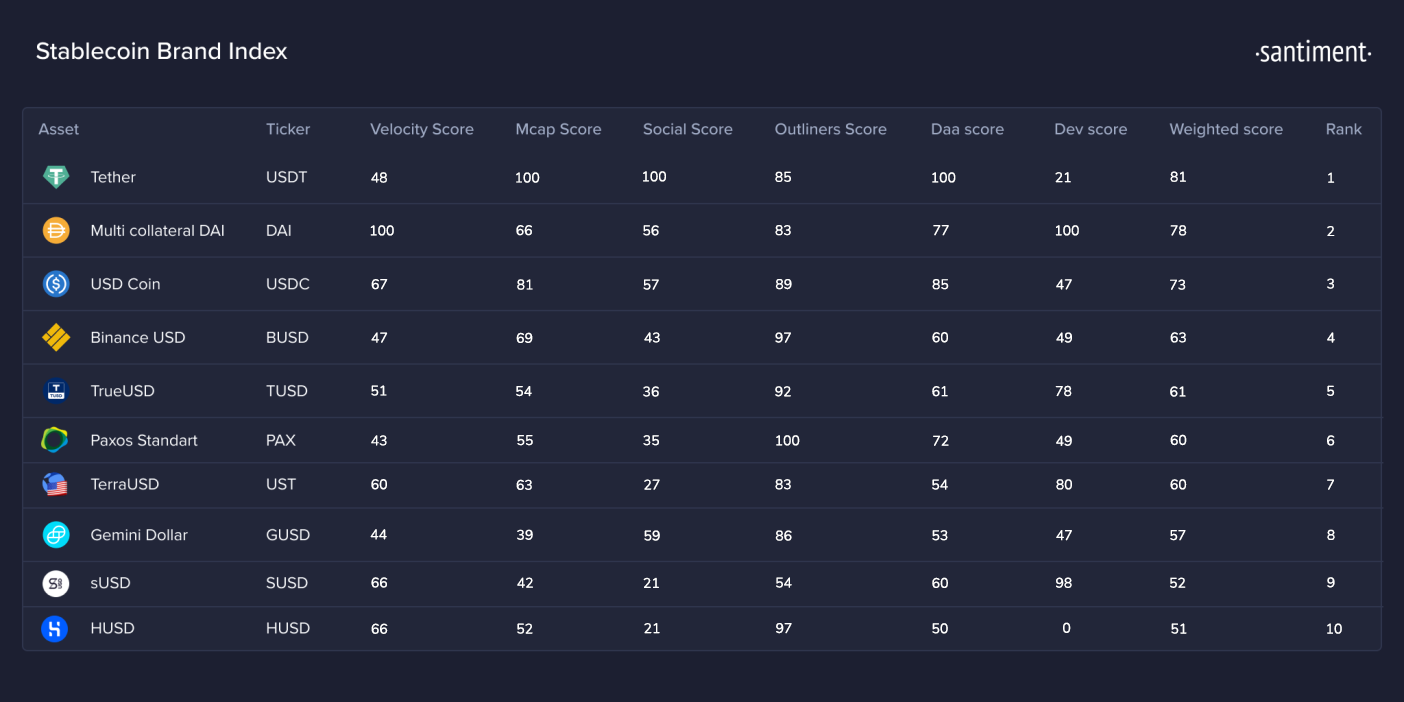
Perhaps unsurprisingly, ERC-20 Tether tops the Stablecoin rankings for yet another fiscal quarter.
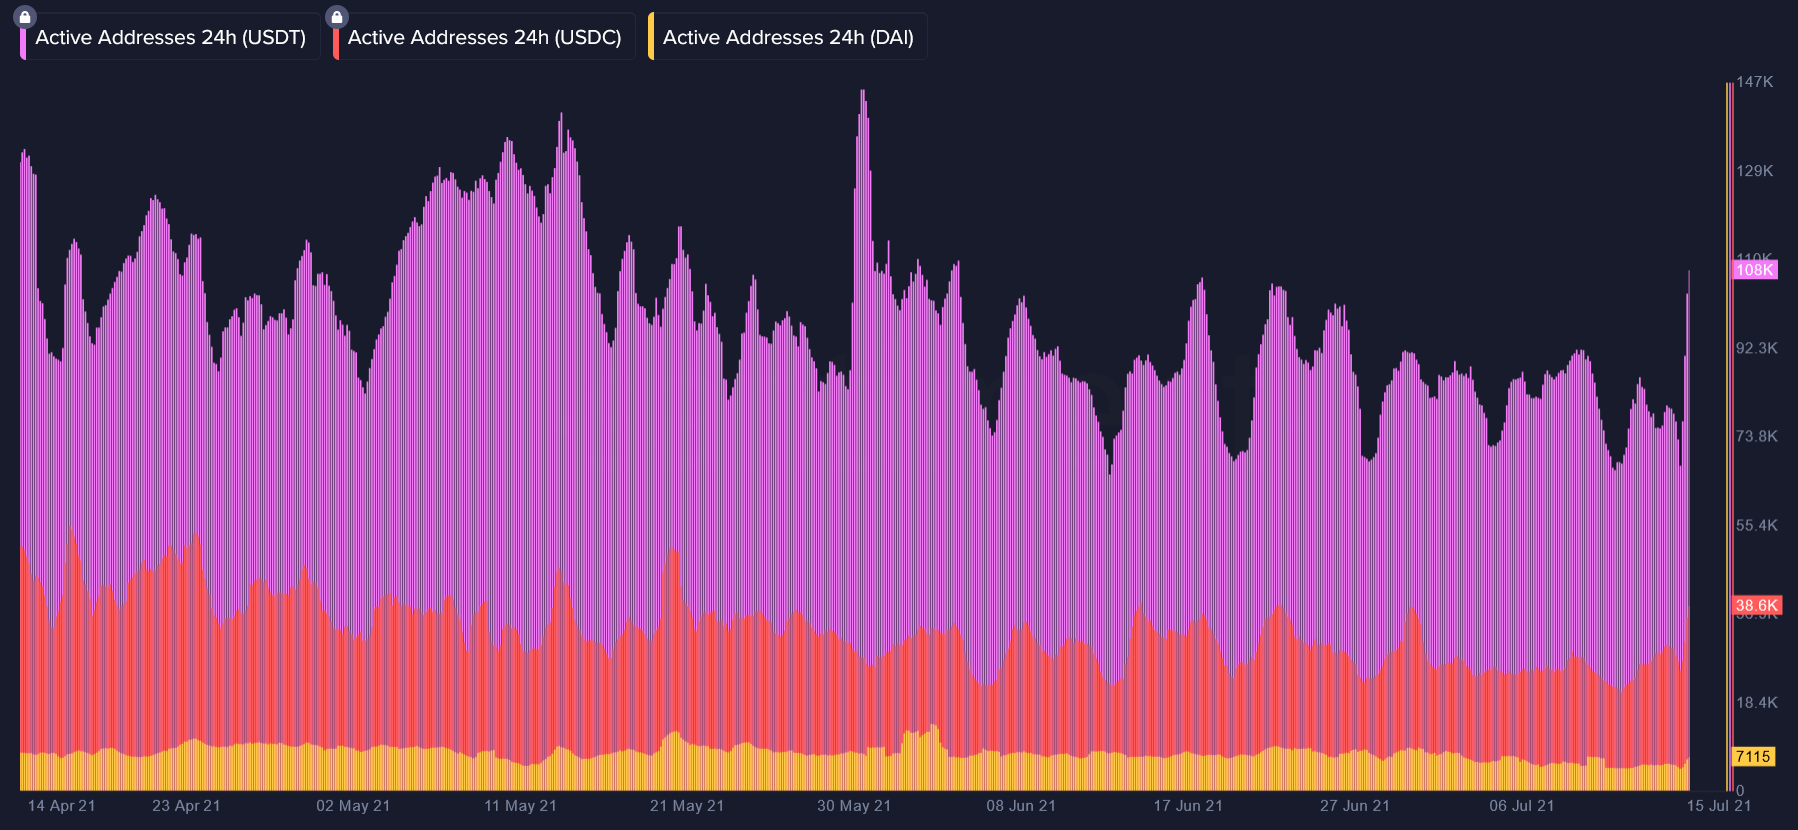
Although it scored fairly low on token velocity (48 compared to DAI’s 100 and USDC’s 67), USDT remains second to none in terms of daily on-chain activity and wholesale demand.
Averaging roughly 85,000 daily active addresses (DAA for short) over the past 3 months, USDT is still easily the most used stablecoin on Ethereum. Tether’s daily on-chain activity continues to tower over the likes of USDC (~30,000 DAA) and DAI (~7500 DAA), fortifying its position as the go-to retail stablecoin for the time being.
Outside of pure network activity, Tether also remains the most prominent stablecoin on crypto social media bar none. According to text data collected from 1000 channels, Tether mentions frequently make up 3%-5% of daily chatter about top cryptocurrencies - a far cry from that of USDC (0.5%-1%) or DAI (0.06%-0.2%):

And while the top berth was no surprise, the runner-up spot actually goes to Multi Collateral DAI, maintained and governed by the MakerDAO.
Although it’s only the fourth largest stablecoin on Ethereum by market cap, DAI’s token velocity and sky-high development activity make up for its current valuation according to the Brand Index.
Unlike the other entries, DAI’s velocity has frequently broken double digits over the past 3 months, suggesting high frequency of use and an ever-recurring serviceability. Paired with an unparalleled amount of activity in the project’s github repository, DAI appears to have successfully established its niche as the DeFi darling, and appears poised to make strong gains moving forward:

The ‘bronze’ goes to Circle’s USDC, whose Q2 parameters reveal a well-rounded stablecoin with few weak points and plenty of room to grow and improve in months to come.
For the moment, USDC remains silver to Tether’s gold - among stablecoins, it's currently #2 in market cap, #2 in daily active addresses, #2 in social media visibility and #2 in on-chain velocity. The coin did prove to be slightly less volatile than Tether (and DAI) in Q2, however, a valuable trait for institutional investors and DeFi enthusiasts alike.
Rounding up the top 5 stablecoins for Q2 of 2021 according to our Brand Index, are Binance USD and TrustToken's TUSD, respectively.
Overall, we believe that the Brand Index rating can provide a more comprehensive overview of the current stablecoin ecosystem, as well as its growth and evolution over time.
Thanks for reading!
If you enjoyed this insight please leave a like, join discussion in the comments and share it with your friends!
Never miss a post from Ibis!
Get 'early bird' alerts for new insights from this author

Conversations (0)