Is ENJ setting up for a deja-vu dump?

It’s been an unusually slow weekend for crypto news - as the market continues to thaw, it looks like the community is looking elsewhere to find fresh, non-price narratives:
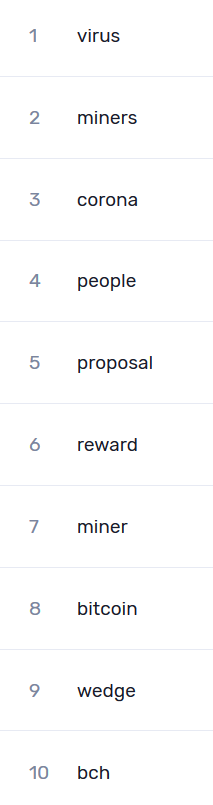
Based on our top emerging words on crypto social media above, there’s been a lot of community talk today about the ongoing spread of coronavirus - yes, even on (sigh) whether the possible pandemic is actually ‘good for Bitcoin’:

Meanwhile, over on BCH subreddits, the debate continues to rage about the network’s upcoming 12.5% tax on all block rewards, imposed by what some have dubbed the ‘BCH mining cartel’. You can read all about that in our Thursday insight.
That said, there’s no shortage of market storylines if you know where to look. Yesterday, Garry wrote a great analysis about the recent performance of Enjin (ENJ) which gained over 13% in the last week, and what it might mean for the coin’s short-term outlook.
Garry makes a solid case for a conservative approach to ENJ moving forward. It made me take a closer look into the coin’s fundamentals and price over the past 3 months, only to find some striking similarities between its current chart setups and the ones recorded during its December 6th top, after its partnership with Microsoft went public.
So in this post I wanted to latch on to Garry’s findings and talk about the many similarities between the two ENJ rallies, as well as some notable (read: concerning) whale movements over the last 24 hours.
Part 1. Drawing parallels between recent ENJ pumps
On December 6th, 2019, ENJ spiked to a 6-month high $0.102 before crashing soon thereafter and losing 28.4% of its value:

This event appears to share a number of similarities with Enjin’s current fundamentals that we’ll explore below.
Do note that some of the recent signals are relatively humble compared to Enjin’s December pump, which is to be expected given the context.
The December rally was due to Enjin partnering with Microsoft, one of the biggest companies in the world. On the other hand, this week’s rally is driven by...market magic? To be honest, there are no good fundamental justifications for Enjin’s 12% gain in the past 7 days. So keep that in mind as we go over these indicators.
So far, I count 7 fundamental similarities between the two events. In no particular order, these are:
1. Same divergence in Enjin’s price and network activity:

Two on-chain indicators great at highlighting overall network activity are:
1. Daily Active Addresses (DAA) - the total number of unique network addresses involved in daily transactions
2. Network Growth - the number of new addresses created on the network each day
When these indicators inflate during a pump - signalling a rise in speculative interest - but begin to decline shortly after, it can often signal an incoming correction.
As you can see, Enjin’s recent network behavior is mirroring its December levels - and general trends - to a tee. Both times the activity spiked halfway through the rally (as word got out of the pump) and started to peter out almost immediately.
Back in December, this soon proved to be the end of the road for ENJ pump - with a waning speculative interest, the price was no longer able to muster another move upward.
2. Same divergence in on-chain transaction volumes

In a similar vein, the total amount of ‘value’ transferred on the Enjin network has ballooned during both rallies, but failed to sustain itself long-term - typical of one-and-done pumps.
ENJ’s on-chain transaction volume at the December top is double that of its latest spike, but as I mentioned before - context matters.
Given that context, it’s also not surprising to see some big differences between Enjin’s transaction volume (all ENJ tokens used in all transactions on the network) and token circulation (only unique ENJ tokens active) levels in December compared to today.

On December 6th, ENJ’s total transaction volume was 103M, and its token circulation at a solid 46.3M. In other words, almost half of all the tokens transferred on that day were unique, common for a healthy, organic pump, driven primarily by the Microsoft news.
In comparison, on January 23rd, ENJ’s total transaction volume was 45.4M, but its token circulation was at just 11.9M. That means that only about a quarter of all tokens transferred on the day were actually unique, indicative of, shall we say, less natural pumps.
3. Same spike in Token Age Consumed

As a metric, Token Age Consumed gives more weight to coins that have not moved for a (relatively) long time. Spikes on the TAC graph, then, often indicate long-term HODLers or even ICO participants moving their bags.
The idea is that veteran traders like these very rarely make rash decisions, and execute most trades based on extensive analysis and/or intimate market knowledge.
Therefore, when their dormant coins finally begin to move, it’s always a notable event.
Bar for that massive outlier between the two pumps (which I’ll maybe cover in another post), January 23rd recorded the biggest spike in Token Age Consumed for Enjin since its December top. On the same day, there’s been a corresponding spike in ENJ tokens moved to centralized exchanges:

Assuming that the two events are connected, these are not weak hands looking to make a quick buck - these are (one or more) seasoned ENJ holders offloading their bags during a pump. The same behavior was observed back in December and swiftly marked the end of the ENJ rally.
4. Same dump among top ENJ whales

Within the top 100 ENJ-holding addresses, those that are not tied to exchanges have exhibited the same dump-happy behavior during both tops.
Between December 3rd (start of the rally) and December 6th (end of the rally) the biggest ENJ whales reduced their total balance by 15M coins (worth ~$1.53 million near the top). At the very same time, the top exchange addresses increased their bags by about the same amount:

I think it’s fair to assume that this amount of sell pressure in such a short time span must have at least contributed to the end of ENJ’s Microsoft pump. Now, we’re seeing the same pattern develop again on the charts.
Since January 21st (start of the rally) until today, top 100 non-exchange addresses reduced their ENJ holdings by 7M coins. During the same time, we’re seeing top exchange addresses add about 5M ENJ to their bags.
5. Similar dump among 1m-10m wallets

As an addendum to the above, it’s also worth looking at the broader ENJ whale ecosystem. This time, we’re observing all addresses holding between 1m and 10m ENJ in their wallets.
This demographic also dumped hard during the Microsoft spike, moving around 15M ENJ in 2 days time. More recently, there’s been a similar, albeit smaller dump on January 24th, where the cumulative balance of these addresses declined by 2.7M ENJ.
Again, the context matters here - while the move is much smaller, so is the rally, as well as the (zero) justifications for it. As a result, smaller moves might still impact the market in similar ways.
6. Same spike in Deposit volumes

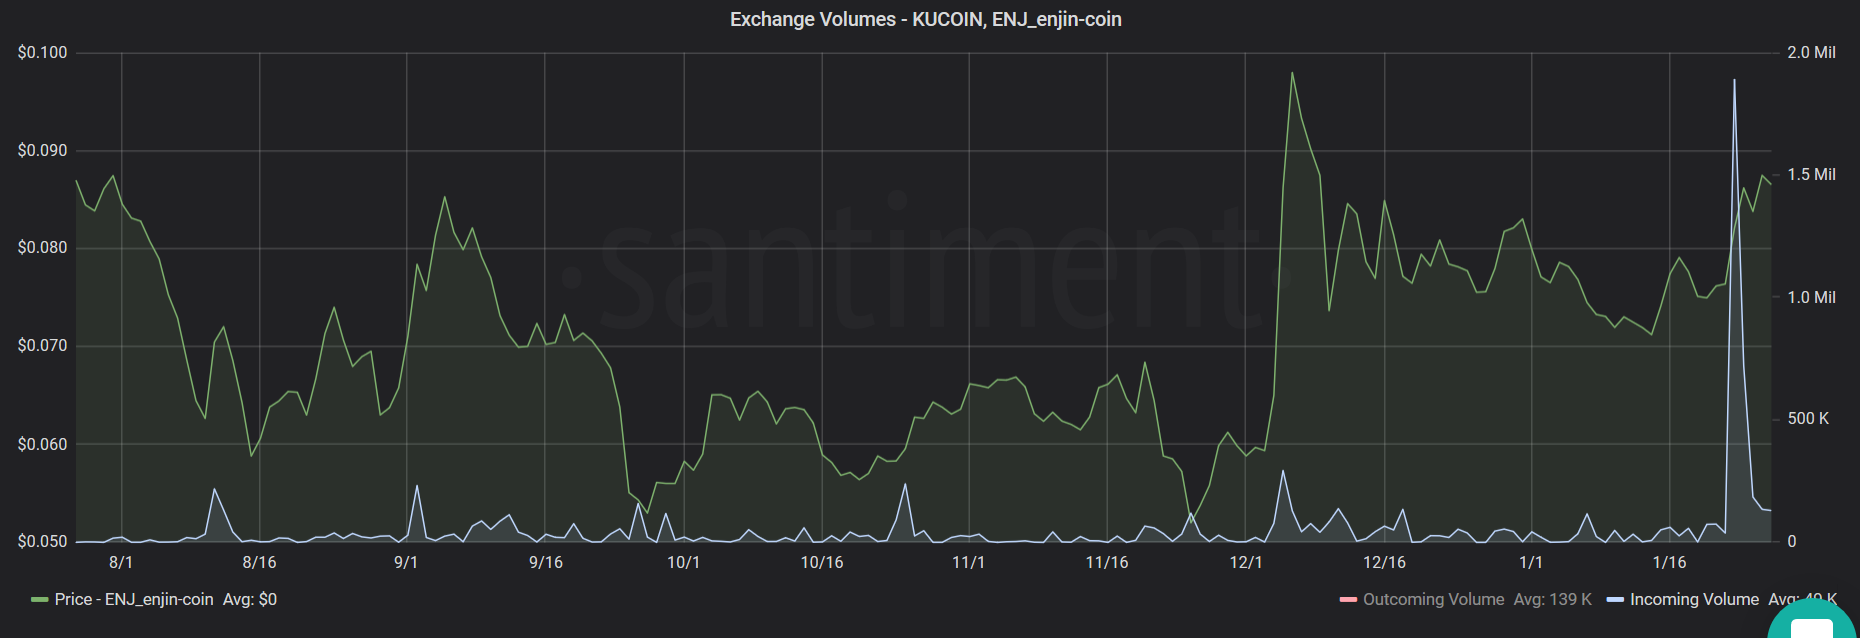
Again disregarding that early January spike (more on that another time), we’ve seen the same growth in the amount of ENJ moving through deposit addresses and to main exchange volumes as during the December pump.
While there’s been a small bump in ENJ inflow to Binance (traditionally the most active Enjin exchange) much of this heightened deposit activity seems to be taking place on another exchange instead - Kucoin:
This corresponds with what we’re seeing on the side of Binance-related activity. There’s been an uptick in ENJ withdrawals from CZ’s exchange, similar to the one observed at the December rally:

Perhaps Kucoin provided solid arbitrage opportunities in the past few days? Whatever the case, a spike in deposit volumes points to a growing speculative interest in a coin, and can often precede short-term price corrections.
7. Similar spike in social volume
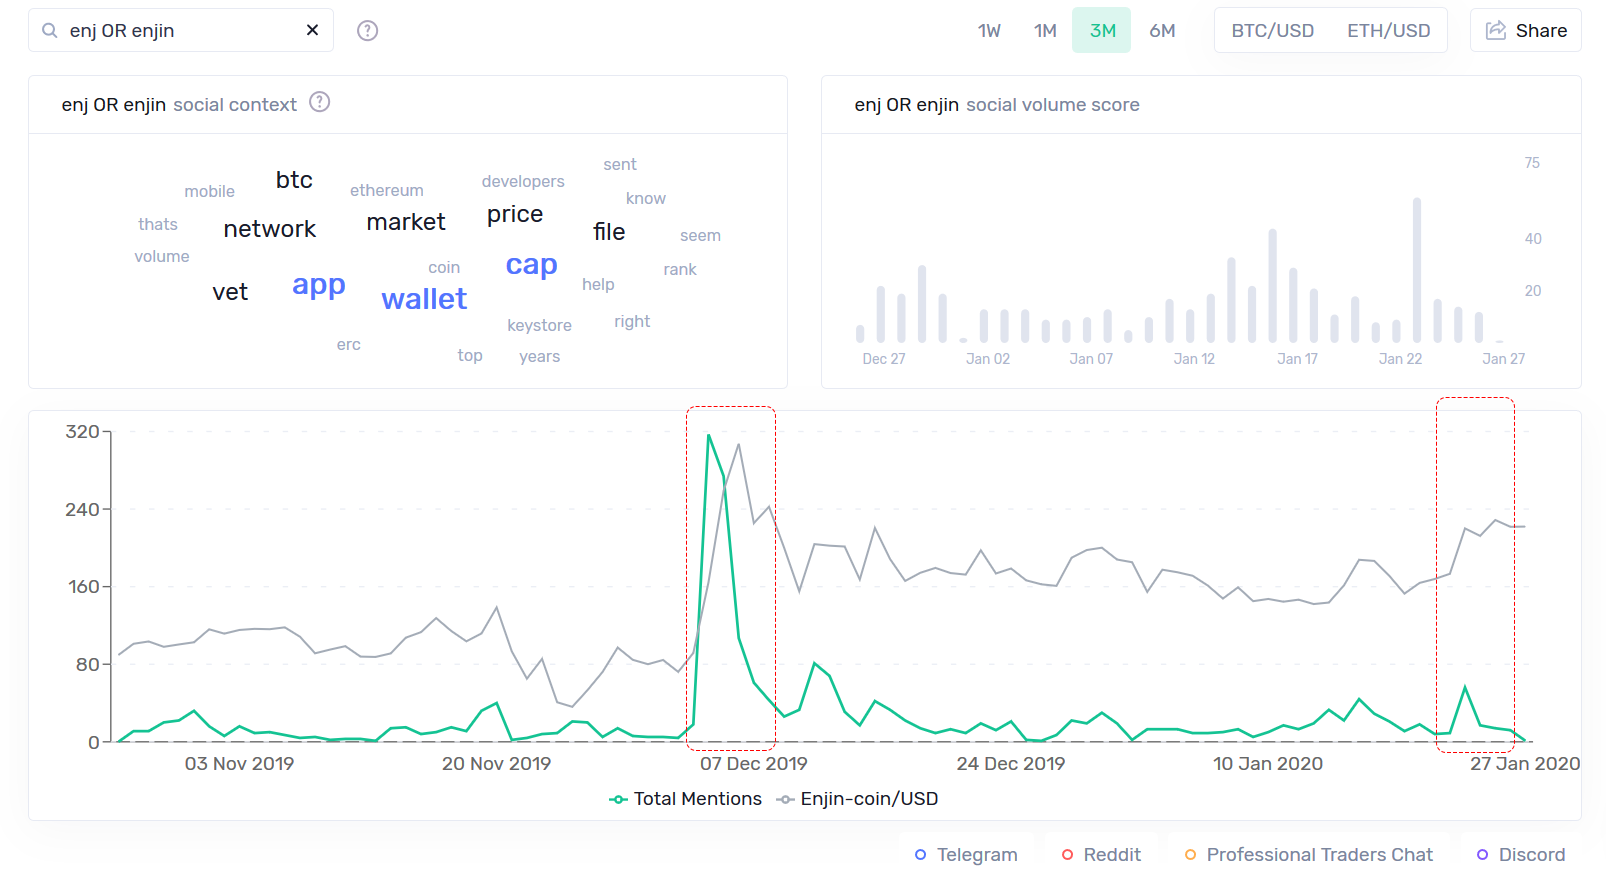
On January 24th, Sanbase recorded a 6-week high in mentions of ENJ or Enjin on crypto social media. While the bump is timid compared to December, it’s worth noting that the Microsoft collab was much bigger news, prompting all kinds of community chatter - not just price-related, but also focusing on the project’s long term outlook.
This time around, there’s not much ENJ-related news to discuss, so the uptick in social chatter still deserves a mention.
Shortly after the Microsoft announcement, ENJ also landed on our list of top emerging trends on crypto social media - in our experience, a strong bearish indicator for most mid-cap coins. Here’s a quick signal if you want to be alerted the next time ENJ makes an appearance on the list.
Part 2. Whale activity in the past 24 hours
Finally, I wanted to take a quick look at the biggest ENJ transactions over the past 24 hours, and what they may tell us about the coin.
Sandata tells us that there were 5 noteworthy transactions on January 26th:
Transactions #1 and #5 in the screenshot are transfers between different Binance wallets, so we’ll disregard those. That leaves three major transactions, of which transactions #2 and #3 track the same coins as they move across different addresses.
Let’s look at that transfer chain first. On 18:54, 264.98k ENJ (~$23000) was sent from 0x4b[...] to 0x62c[...]. 14 minutes later, this address transfers the received ENJ to 0x3f[...], a known Binance wallet.
If we enter the first address in that chain into our Historical Balance tool, we can see this was a long-term ENJ holder, coming into the money back in January 2018:

Looks like they’ve grown tired of HODLing and finally decided to sell while ENJ is rallying, even though they still sold at a loss. Definitely not a confident move by a long-time whale.
The second transfer is even more interesting, and also by far the biggest transfer of the day (and in fact the week). 11M ENJ ($952,700) was transferred early on Sunday to this address. While those coins have yet to move, the address’ historical activity is fascinating in itself.
For the past several months, the owner of this address has sent millions of ENJ in dozens of smaller transactions - always first to this interim address, which would quickly forward the coins to this address.
From there, the received ENJ was split into even smaller transactions and sent to one of several addresses which would then, finally, transfer said coins to various Binance or Kucoin-owned wallets.
The coin journey between these wallets is kinda mesmerising, just like the original address’ historical activity:

Whoever this is, we can see they dumped over 30M ENJ right before the December top, and have moved another 11M in the past 24 hours. As I mentioned, these 11M have yet to make their way to any of the other mentioned addresses in the chain, but you can see how its previous moved correlated with the Enjin’s short-term price action.
To keep track of this 11M, here's a quick signal that will notify you once that receipient address starts moving its coins.
So there you have it. In the end, I can’t help but agree with Garry’s advice about ENJ: based on its recent on-chain activity relative to its December pump, as well as some of its recent whale behavior, a conservative outlook feels justified.
Be safe out there!
Thanks for reading!
If you enjoyed this insight please leave a like, join discussion in the comments and share it with your friends!
Never miss a post from Ibis!
Get 'early bird' alerts for new insights from this author

Conversations (0)